Pension Quiz
Source: Pension Quiz
Is it better to have 10% ROA or reduce Funding Costs by 10%?
The primary objective of a pension is to secure benefits (Retired Lives) in a cost-efficient manner with prudent risk. The secondary objective is to enhance the funded status by maximizing the efficiency of asset allocation. However, most pensions have the stated objective as a… target absolute % return on assets (ROA).
Achieving a 10% ROA
History has proven that achieving the ROA does not mean you achieved a fully funded plan or even enhanced the funded status such that the $ deficit and contribution costs have been reduced. Simple math can prove this assertion as shown in Exhibit 1 where pension assets achieved the ROA growth target of 8% consistently for last 6 years. Liabilities are assumed to have the same 8% growth rate (actuarial discount rate = ROA). As a result, the funded ratio stays stable at 60% but the funded status $ deficit increases by 59.6% ($40 to 63.44) which would increase contribution costs accordingly. In order for contribution costs to remain stable or go lower, assets would have to match or outgrow liabilities by 5.33% annually (13.33% ROA minimum):
Exhibit 1
Funded Ratio = 60% ($40 Deficit)
Assets and Liabilities grow at ROA = 8%
| Assets | Liabilities | Funded Status/Ratio | ||||
|---|---|---|---|---|---|---|
| Year | Begin | End | Begin | End | $ Deficit | Funded Ratio |
| 1 | $60.00 | $64.80 | $100.00 | $108.00 | $43.20 | 60% |
| 2 | 64.80 | 69.98 | 108.00 | 116.64 | 46.66 | 60% |
| 3 | 69.98 | 75.58 | 116.64 | 125.97 | 50.39 | 60% |
| 4 | 75.58 | 81.63 | 125.97 | 136.05 | 54.42 | 60% |
| 5 | 81.63 | 88.16 | 136.05 | 146.93 | 58.77 | 60% |
| 6 | 88.16 | 95.21 | 146.93 | 158.65 | 63.44 | 60% |
If the actual asset growth rate was 10% instead of 8% (Exhibit 2), assets would grow to $106.29 over six years which creates a 67% funded ratio but a growing deficit of $52.36 or 30.9% greater than the initial $40 underfunding which increases contribution costs accordingly. Even a 70% funded ratio would increase the deficit to $45.91 or 14.78% greater. The pension return objective should be for assets to outgrow liabilities in economic dollars not actuarial dollars… it is relative $ returns that count not an absolute % return (ROA)! It is the economic funded status that counts not the funded ratio! Asset allocation needs to know the economic relative return needed to enhance the economic funded status.
Exhibit 2
Funded Ratio = 60% ($40 Deficit)
Assets grow at 10% but Liabilities grow at ROA = 8%
| Assets | Liabilities | Funded Status/Ratio | ||||
|---|---|---|---|---|---|---|
| Year | Begin | End | Begin | End | $ Deficit | Funded Ratio |
| 1 | $60.00 | $66.00 | $100.00 | $108.00 | $42.00 | 61% |
| 2 | 64.80 | 72.60 | 108.00 | 116.64 | 44.04 | 62% |
| 3 | 69.98 | 79.86 | 116.64 | 125.97 | 46.11 | 63% |
| 4 | 75.58 | 87.85 | 125.97 | 136.05 | 48.19 | 65% |
| 5 | 81.63 | 96.63 | 136.05 | 146.93 | 50.30 | 66% |
| 6 | 88.16 | 106.29 | 146.93 | 158.65 | 52.36 | 67% |
If we use market (economic) values for liabilities (ASC 715 discount rates), liabilities become highly interest rate sensitive… the economic truth. Using ASC 715 (AA corporates as a zero-coupon yield curve) as the discount rate for liabilities, a small increase in interest rates (+60 bp per year) would create negative growth in liabilities! Accordingly, any positive growth in assets would enhance the economic funded ratio and funded status. In just five years a 60% funded ratio could be 91% funded with just 5% asset growth while a 70% funded ratio would be 106% funded… and at no time did assets earn the ROA!
5-year Horizon
Liabilities ASC 715 Discount rate goes from 2.00% to 5.00%
Liabilities Growth Rate = (3.40%) at 12-year duration
| ----- Annual Growth Rate ----- | |||
|---|---|---|---|
| Assets | 5.00% | 6.00% | 7.00% |
| Liabilities | -3.40% | -3.40% | -3.40% |
| Alpha (Annual) | 8.40% | 9.40% | 10.40% |
| Funded Ratio @ 60% ... | 91.0% | 94.5% | 100.1% |
| @ 70% ... | 106.2% | 111.4% | 116.7% |
Achieving a 10% Funding Cost Savings
The primary objective of a pension is to fund liabilities in a cost-effective manner. It is a liability objective with cost considerations. Since 1999, most pensions have been hard hit by spiking contribution costs which were unexpected and not a budget forecast. For many plan sponsors, the contribution cost has risen as much as 5x to 10x from the fiscal 1999 level. Such costs are a product of the size of the funded status deficit where asset $ growth did not match liability $ growth over time. Indeed, it is the relative $ growth of pension assets vs. liability $ growth that is critical… not the absolute % return on pension assets.
The pension objective is best achieved by separating the assets into liquidity (Beta) and growth (Alpha) assets. The job of the liability Beta (liquidity) assets is to secure benefits (Retired Lives) in a cost-efficient manner with prudent risk. This is best accomplished through cash flow matching net liabilities chronologically. Ryan ALM has built a liability cash flow matching product, named the Liability Beta Portfolio™ (LBP), as a cost optimization model that matches and funds the net liability benefit payment schedule (minus contributions) at the lowest cost given the investment policy restrictions of our clients.
Since liabilities are funded initially by contributions, using the LBP model to cash flow match net liabilities chronologically may be able to fund more liabilities than you think. Assume that a 15% bond allocation could cash flow match the next 10 years of net Retired Lives payments chronologically. Based on the Ryan ALM Liability Beta Portfolio™ (LBP) model we show a cost savings of about 8% to 15% on cash flow matching the first 10 years of liabilities versus the ASC 715 discount rates (AA corporate zero-coupon bonds). For every $100 million in bonds used in our LBP model could save about $10 million or 10% in funding cost savings vs. the projected net liabilities. This cost savings is received immediately upon implementation of the Liability Beta Portfolio™ rather than over several years as forecasted returns suggest would happen, if at all. This is a serious cost reduction that reduces the volatility of the funded status and contributions and should be a major consideration of any pension asset allocation as the core portfolio.
Matching liabilities chronologically should also buy time for the growth assets (Alpha assets) to perform and outgrow liabilities without being diluted or unencumbered to partially fund liabilities as is the case so often today. Given time (10 years) most non-bond asset classes tend to outperform bonds. Since liabilities behave like bonds there is a high probability that Alpha assets (i.e. equities) could outperform liability growth over an extended time horizon especially at today’s low yield on bonds (and liabilities).
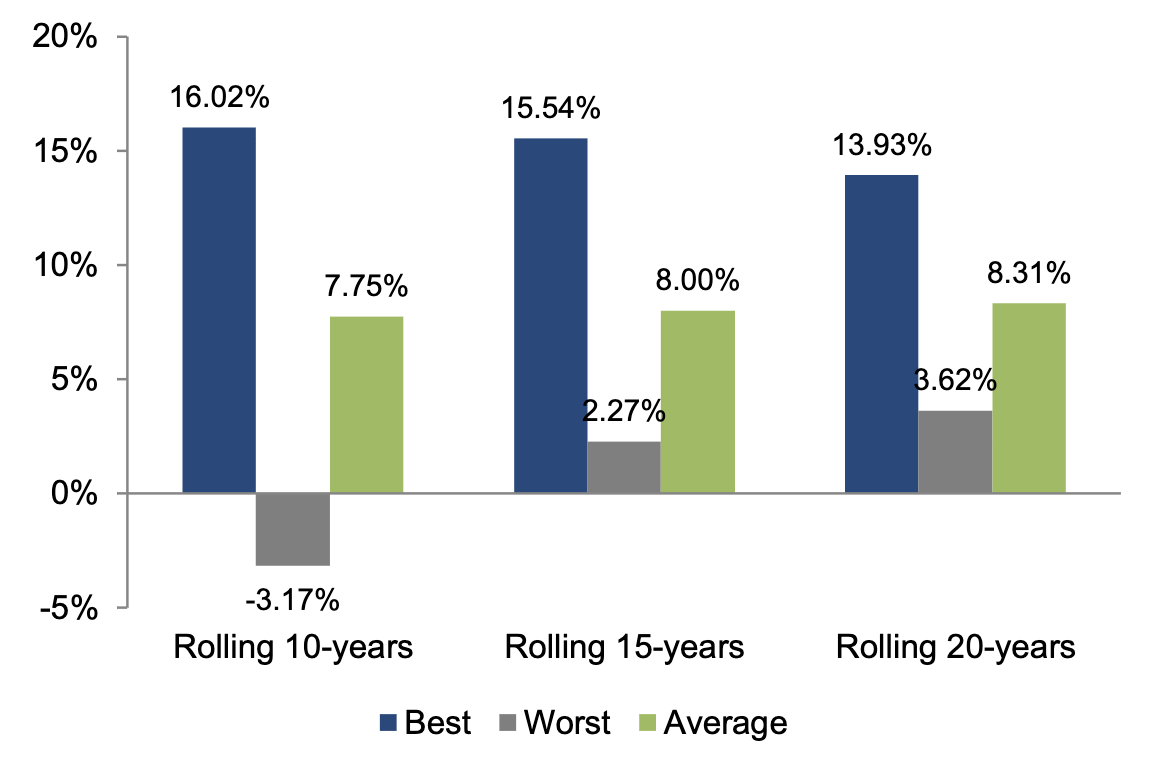
Given time, equities (S&P 500) perform well. The more time you give equities… the better the returns. Below are historical average S&P 500 return measurements for rolling 10-year, 15-year and 20-year periods ending 12/31/19 over a 50-year horizon starting 1969. The table shows an average return of 7.75% for rolling 10-years, 8.00% for rolling 15-years and 8.31% for rolling 20-years. The table below also suggests how difficult it is to average a 10% return for any extended period of time… even 9.00% is not a proven performance attainment:
Best, worst, and average returns
Solution: BUY TIME!
So how do you buy time? The answer is… cash flow match liabilities
How do you buy time? Cash flow match liabilities for the time you need.for the time you need. We recommend funding net Retired Lives out 10-years or more chronologically as the historical equity returns document. Our cash flow matching model (Liability Beta Portfolio™ or LBP) will calculate with precision the cost to fund net liabilities + expenses in a cost-effective manner chronologically.for the time you need. We recommend funding net Retired Lives out 10-years or more chronologically as the historical equity returns document. Our cash flow matching model (Liability Beta Portfolio™ or LBP) will calculate with precision the cost to fund net liabilities + expenses in a cost-effective manner chronologically.
Benefits: Cash Flow Matching
Our LBP also has numerous benefits that enhance the pension plan:
Secures Benefits
Cash flow match monthly Retired Lives benefits chronologically
Reduces Costs
LBP reduces Contribution, Funding and Asset Management Costs:
(LBP Fee = 15 bps… much less than most active bond managers)
Reduces Volatility
Reduces volatility of Contributions and Funded Ratio
Reduces Risk
Risk = Uncertainty of Funding Benefit Payments
(LBP funds benefits with certainty)Projected Benefit Payments are Future Values
(FV have NO Interest Rate Sensitive)
Enhances ROA
LBP should out yield most active management bond portfolios
Buys Time
LBP matches & funds liabilities chronologically
Moves deficit out longer extending the investment horizon
Buys Time for Non-bond assets (Alpha assets) to grow
No dilution of Alpha assets to fund benefits
However, most bond allocations are for active bond management versus a generic index benchmark(s). As the designer of the Lehman bond indexes from my days as the Director of Fixed Income Research at Lehman, I can tell you unequivocally that generic bond indexes look nothing like a projected pension benefit payment schedule. Such a mismatch will distort the cash flows and risk/reward behavior of assets vs. liabilities. The major issues and differences are:
Bond Assets Managed Versus Generic Bond Indexes
Does not fund benefits + expenses
Aggregate Index = low yielding @ 1.42%
Generic bond index =/= plan sponsor’s liabilities
Cash flows do not match plan sponsor’s liabilities
Index skewed to long bonds + Government securities
Performance (value added) = small to none (after fees)
But the worst difference and discrepancy is… all about cash flows. Active bond management is usually focused on outperforming the returns of a generic bond index benchmark. As a result, cash flows are not a consideration. But no matter what generic bond index is chosen; the fixed income assets cannot produce enough income cash flow to fund benefits + expenses. As a result, bonds will require help from performance (Alpha) assets to fund benefits + expenses. This will create dilution and disruption of the growth rate of such performance assets. With the Liability Beta Portfolio™ in place as the core portfolio to fund the shorter Retired Lives net liabilities (1-10 years), the Alpha assets are now free to grow long-term without being diluted or unencumbered to pay any benefits. The example below shows the cash flow difference of bonds managed to a generic index versus cash flow matching to liabilities:
It’s All about Cash Flows!
Bond allocation = $150 million
Liabilities (Net Benefits + Expenses) = $20 million per year
Bond management vs. generic bond index
YTM = 2.50%
Income Cash flow = $3.75 million annual ($2.50% x $150m)
Annual cash flow shortfall= $16.25 million ($20m - $3.75m)
Requires dilution of Alpha assets cash flow to fully fund liabilities
Cash Flow Matching next 10 years
YTM = 3.50% (skewed to A/BBB corporate bonds)
Cash flow = $20 million annual (fully funds liabilities)
(Cash flow includes principal + income + income reinvested)
No dilution of Alpha assets (allowed to grow unencumbered)
Observations:
Generic bond indexes cash flows look nothing like the projected benefit payment schedule of a pension
This leads to mismatch of cash flows and risk/reward behaviors … serious issue over time
Alpha assets need time to perform without any dilution of their cash flows to pay benefits
Cash flow matching (Beta assets) matches plus funds benefit payments chronologically
Cash flow matching will out yield current bond managers and enhance ROA
Cash flow matching buys time for Alpha assets to grow unencumbered
Let the performance (Alpha) assets perform (grow) as the liquidity (Beta) assets provide cash flow sufficient to fund net benefits plus expenses. Pension consultants and plan sponsors should consider installing an LBP as the core portfolio in asset allocation. The best value in bonds is the certainty of their cash flows. Bonds are usually not considered performance assets especially vs. pension liabilities which behave like bonds. As the Alpha assets perform vs. liability growth, enhancing the funded ratio, such excess returns could be transferred over to the Liability Beta Portfolio™ (LBP) to fund and de-risk more liabilities… Portable Alpha. Had this Portable Alpha discipline been in place during the 1990s when funded ratios grew to their highest historical levels with true surpluses… there would be no U.S. pension crisis today!
Conclusion (Logic)
So, is it better to have a 10% cost savings that is immediate and certain with numerous benefits itemized in this report? Or is it better to have an uncertain 10% ROA in the future that may or may not enhance funding (could increase the deficit)?
10% cost savings = $100 million reduced funding costs per $1 billion
10% ROA = 60% funded ratio on $1b = $400m deficit that grows to $522.60m in 6 years or 30.7% higher contribution costs = $122.6m.
Compare: $122.6m more in costs vs. $100m cost savings!!!
I think the facts speak clearly that… cost savings is the better goal and better fit with the primary objective of a pension… but you can have both:
To achieve the primary and secondary pension objective:
Primary = cash flow match net Retired Lives chronologically (Beta assets)
Secondary = have asset growth > liability growth not % ROA (Alpha assets)