
Ryan ALM
White Papers
Browse
The Pension Crisis of 2000-02
In my 2013 book “The U.S. Pension Crisis” I detailed the causes of the 2000-02 pension crisis where funded ratios deteriorated significantly from a surplus position in the 1990s. This...
Source: The Pension Crisis of 2000-02
In my 2013 book “The U.S. Pension Crisis” I detailed the causes of the 2000-02 pension crisis where funded ratios deteriorated significantly from a surplus position in the 1990s. This created a spike in contribution costs for many years which I labeled as the U.S. pension crisis… it was actually a contribution cost crisis. Contribution costs for many pensions rose quickly by 5x to 10x or even more in a short period of time. This led many cities and states into a budget shock and some even filed for bankruptcy (i.e. Detroit, Harrisburg, Jefferson County, Stockton).
The major cause of this dilemma, I reasoned, was the asset allocation objective of achieving a ROA (about 8.00% then). This was in sharp contrast and conflict with the true pension objective… to fund benefits (liabilities) in a cost-effective manner with prudent risk.
With funded ratios in a surplus position in the late 1990s. most pension plans could have defeased their liabilities with a bond allocation that used a cash flow matching (CFM) strategy. This CFM strategy would have secured benefit payments and kept contribution costs very low. This used to be called Dedication in the 1970s and 1980s and was a widespread strategy then. CFM gives certainty that the asset cash flows will fully fund the liability cash flows at the lowest cost to the plan sponsor. But because interest rates were well below the ROA of 8.0% in the late 1990s, asset allocation models heavily skewed their weights to equities and other non-bond risky assets to try to earn this 8.0% ROA hurdle rate.
When the equity correction hit in 2000 it was quite severe for pensions. Not only did the equity assets have negative growth but due to a secular decline in interest rates from 1982 this translated into high pension liability growth since they behave like bonds. According to Federal Reserve calculations, the average asset growth for public pensions underperformed the average liability growth by about 73% in the period 2000-02 as follows:
| Assets | Liabilities | Difference | Cumulative | |
|---|---|---|---|---|
| 2000 | -2.50% | 25.96% | -28.46% | -28.46% |
| 2001 | -5.40% | 3.08% | -8.48% | -37.60 |
| 2002 | -11.41% | 19.47% | -30.88% | -73.40% |
2000AssetsLiabilitiesDifferenceCumulative2000-2.50%25.96%-28.46%-28.46%2001-5.40%3.08%- 8.48%-37.602002-11.41%19.47%-30.88%-73.40%
This underperformance caused pension funded ratios to go from a nice surplus to a deep deficit creating the spike in contribution costs. According to the Federal Reserve System data the average funded ratio for state pension funds was 58.9% as of 2002 from a surplus position in 1999.
for their asset allocation models. According to the 2024 Milliman study the average asset allocation for public pensions is skewed to equities at 76% with bonds at 21% down from 24% 10 years ago.
Given the performance of equities in recent years, we may be nearing a correction similar to 2000-02 based on some key criteria:
Reversion to the Mean
This is a common and logical concept. The S&P 500 has a mean return of 9.75% for 20 years and 9.90% for 30 years with dividends. The last 5 years has a mean return of 11.33% and 10 years = 12.39%. This suggests a possible negative growth for the near future to revert to the mean.
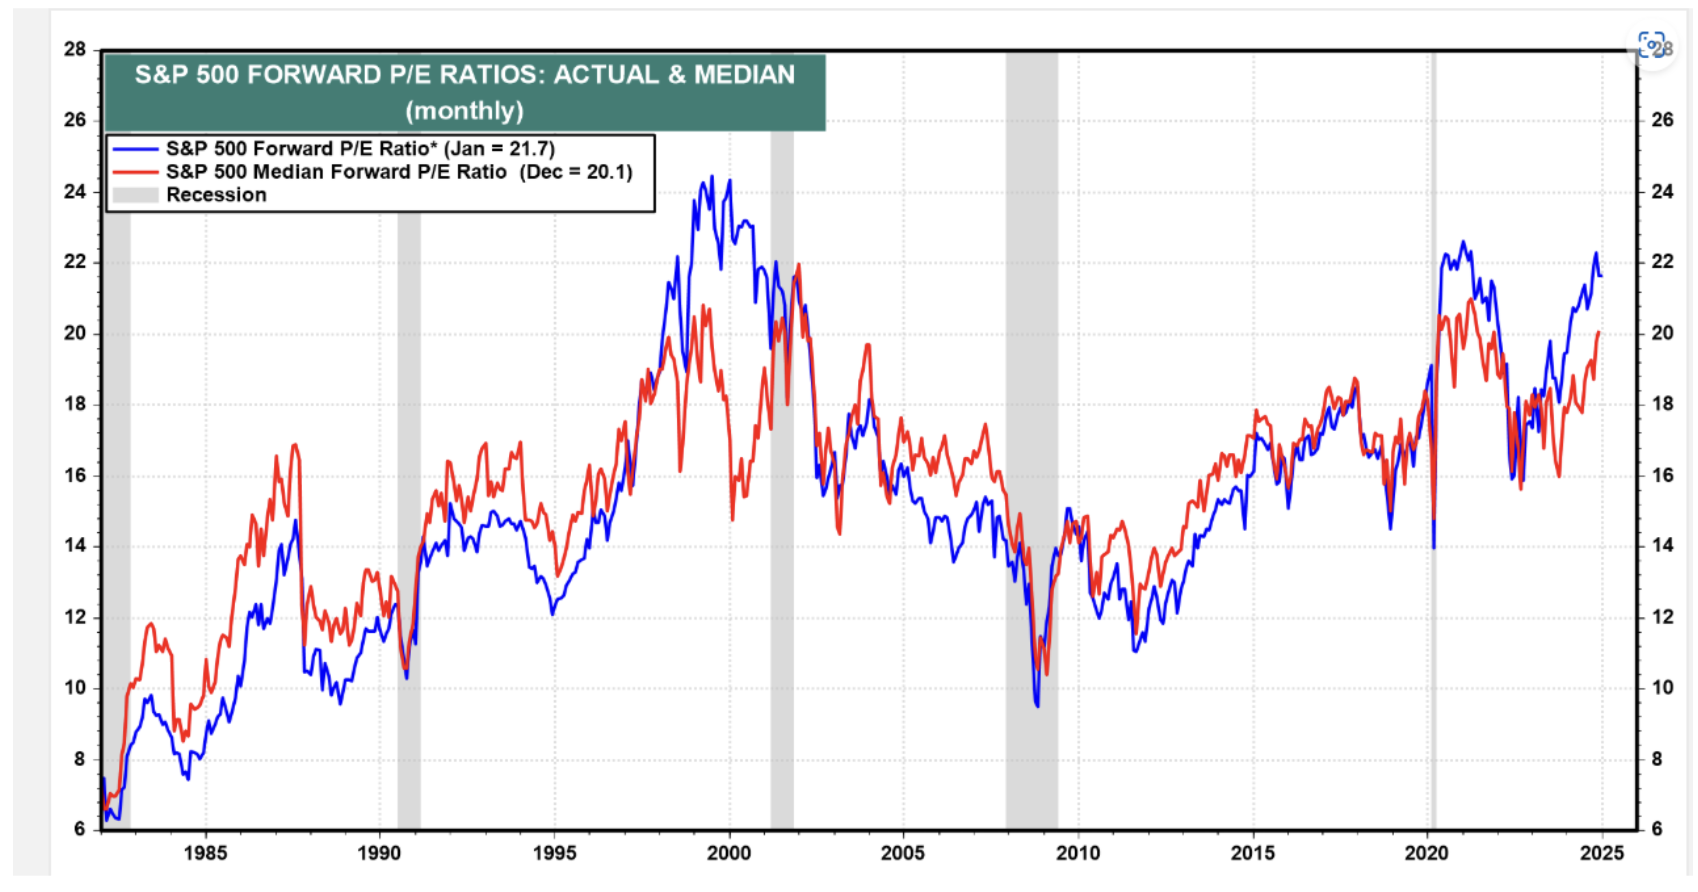
P/E Multiple
Valuation is another key determinant. Based on forward earnings, the current forward P/E for the S&P 500 is around 24.26x today. The graph below by Yardeni shows it at 21.7x on Jan. 23. The point here is that the forward P/E today is above the median P/E of 20.1x and is near a 25 year high which happened in 2000.
Déjà Vu
Pensions need to protect and enhance their funded status. They cannot afford volatility in the funded ratio and contribution costs. Now is the time to address asset allocation by shifting assets to a cash flow matching strategy. We recommend a minimum of defeasing the 1-10 year liability cash flows. This would buy time for the risky assets to grow unencumbered and recover from any correction. It also eliminates the need for a cash sweep that reduces the ROA of stocks significantly.
What’s Better For a Pension?
Asset returns are uncertain and very volatile. The S&P 500 is a good example. Since 1990 this index has enjoyed 13 years of 20% + growth. Unfortunately, it was accompanied...
Source: What’s Better For a Pension?
Asset returns are uncertain and very volatile. The S&P 500 is a good example. Since 1990 this index has enjoyed 13 years of 20% + growth. Unfortunately, it was accompanied with several negative return years which brought the average 20 year return down to 9.75%:
The decades of the 2000s began with three negative return years for the S&P 500 as follows:
2000 = (9.03%) 2001 = (11.85%) 2002 = (21.97%)
This combined with a secular decline in interest rates made liability growth spike by 55.12% in those three years (according to the Ryan ALM Liability Index) causing funded ratios to drop significantly by as much as 47%. This brings up the commonsense math… if funded ratios go down about 50%, they need to have assets outgrow liabilities by about 100% to get back to full funding. Since the return on assets (ROA) forecast is not based on the funded status but on the expected return of the plan’s asset allocation, the actuarial projections must make up the funded status deficit by increasing contributions. Most pension plans have experienced spiking contributions costs since 2000 which I proclaimed as the primary impetus for the US pension crisis in my 2013 book (The U.S. Pension Crisis). The uncertainty and volatility of the actual ROA has plagued pensions forever and will continue if this remains the focus of asset allocation.
Since the true objective of a pension is to secure benefits in a cost-efficient manner with prudent risk then asset allocation should be focused on this objective and not an ROA objective, which doesn’t guarantee success. This is best accomplished by bifurcating assets into liquidity (Beta) and growth (Alpha) assets. The liquidity or Beta assets should fully fund the liability cash flows (benefits + expenses) chronologically with certainty for as long as the allocation will cover. We define risk as the uncertainty of achieving the objective. So, the least risky asset strategy is to cash flow match (defease) the liability cash flows with certainty. Depending on the plan’s funded status will dictate the asset allocation between the liquidity and growth assets. The funded status is best measured by the
Asset Exhaustion Test (AET) which compares the annual asset cash flows (including contribution) versus the annual liability cash flows (including benefits + expenses).
Ryan ALM recommends starting with an allocation to liquidity or Beta assets that fully funds the liability cash flows for the next 10 years. Then we run the AET to see what ROA is needed for the residual growth assets to fully fund the residual liability cash flows. If the calculated ROA is lower than the current ROA assumption, you can allocate more to the liquidity assets and vice versa.
The benefits of the Ryan ALM cash flow matching strategy (Liability Beta Portfolio™) are numerous and significant:
Reduces risk (de-risks) by cash flow matching liability cash flows with certainty
No interest rate risk since it is funding future values (B+E liability payments)
Provides timely and proper liquidity to fully fund benefits + expenses (B+E)
AET will calculate proper allocation between liquidity and growth assets
AET will calculate ROA needed to fully fund liability cash flows
Reduces funding costs by about 2% per year (1-10 years = 20%)
Reduces asset management costs (Ryan ALM fee = 15 bps)
Reduces volatility of the funded ratio and contributions
Buys time for the Alpha assets to grow unencumbered
No need for a cash sweep to meetliquidity needs
In summary, a LBP cash flow matching strategy for liquidity assets will reduce funding costs by about 2% per year (1-10 years = 20%) while fully funding the liability cash flows with certainty. This will reduce the volatility of the funded status and allow plan sponsors and their consultants to better plan asset allocation for the growth assets. By eliminating a cash sweep, the growth assets can now reinvest their income and enhance their ROA. So, I ask once again: What is better for a pension plan? A 20% asset gain or a 20% liability cost reduction? It is clearly the cost reduction given the certainty of the outcome!
Pension Confusion - Find the Liabilities
Securing and funding liabilities in a cost-efficient manner with prudent risk is the true pension objective. Although liabilities should be the focus of pensions, it is hard to find liabilities...
Source: Pension Confusion - Find the Liabilities
Securing and funding liabilities in a cost-efficient manner with prudent risk is the true pension objective. Although liabilities should be the focus of pensions, it is hard to find liabilities in asset allocation, asset management and performance measurement… especially forPublic and Multiemployer Plans,as theseplans are asset only focused. Private plans are very much liability driven although they have opted out of pensions to buy Insurance BuyOut annuities as a major trend for over ten years.Given the 500 bps increase in the Fed Funds rate in the last two years, Private plans need to revisit the economics of BuyOut annuities versus a defeasance strategy (cash flow matching). I think they may find that a defeasance strategy has definite cost advantages today.
So, what’s the matter? There is an obvious disconnect between assets and liabilities because liabilities are missing from every critical asset function:
Asset Allocation (AA)
Liabilities are like snowflakes, you never find two alikeas each pension plan has a different labor force, salaries, mortality and plan amendments. There can never be a generic market index to replicate any plan sponsor’s unique liability cash flows. Liabilities are the domain of the actuary. They produce a very thorough annual report detailing and itemizing numerous liability calculations. The actuaries do an amazing job given the huge number of calculations. They have a tedious and most important function as the calculator and custodian of the liabilities. This voluminous work is usually presented as an annual report a few months after the end of the fiscal year. More importantly, the actuary calculates the funded status which should be the focus of asset allocation, asset management, and performance measurement.
Most pension asset allocations are based on earning a target ROA or hurdle rate. The ROA is calculated by weighing the expected return for a series of asset classes. Each asset class has its own ROA based on its index benchmark estimated return. Pension consultants are quite diligent in analyzing each asset class and assigning the proper weight to achieve the target ROA and risk behavior. Thorough quarterly reports are presented by the consultants to plan sponsors detailing the risk/reward of every asset manager versus the index benchmark assigned to that asset class as the bogey. As a result, generic market indexes are the driver and focus of asset allocation.
AA should be responsive to the funded status of each client. A 90% funded plan should have a much more conservative AA than a 60% funded plan. But most, if not all, asset allocation models ignore the funded status and focus on achieving the target ROA with the highest probability of success and prudent risk based on historical returns of a database that is almost 100% generic market indexes. The historical risk/reward behavior of numerous generic market indexes are
inputs into an AA optimization model that provides a baseline allocation of each asset class. The pension consultant will then massage those weights to best fit each client. Too often plan sponsors have similar asset allocations no matter what their funded status is because they have similar ROA targets. This has led to inappropriate AA especially in the late 1990s and early 2000s that were heavily skewed to risky assets although the pension plans were greatly overfunded then. Had pensions defeased their liabilities then through a cash flow matching strategy with investment grade bonds, they could have secured their surplus victory and stabilized low contribution costs. Instead, the equity correction of 2000-02 wrecked the funded status of almost all pensions causing spiking contribution costs which have not subsided even today.
Without knowledge of the economic funded status on a frequent and accurate basis, AA cannot function effectively. If the market value of assets is the most accurate measurement of asset valuation then the same is true for liabilities. The Society of Actuaries (SoA) delivered a research paper “Principles Underlying Asset Liability Management (ALM)” years ago that warns of erroneous accounting valuations and recommends that pensions create a set of economic books:
“A consistent ALM structure can only be achieved for economic objectives. Accounting measures can sometimes distort economic reality and produce results inconsistent with economic value. Because ALM is concerned with the future asset and liability cash flows, the natural focus of ALM is economic value.”
Ryan ALM Translation: Pension plans need to create a set of “economic books” so ALM can function effectively. It’s all about asset cash flows funding liability cash flows. A Custom Liability Index (CLI) is the method and proper benchmark to create economic books.
With a CLI in place, consultants and plan sponsors can now know monthly the true economic funded status and liability growth rate. With a CLI, consultants now possess pertinent and private information for each of their clients that no other consultant would have…. a significant advantage over competition. The CLI allows consultants to now customize the AA to best fit the clients dynamic funded status with timely adjustments. Although the actuaries don’t produce a CLI, it is based on the private actuarial projections of benefits, administrative expenses and contributions. Ron Ryan and his team created the first CLI in 1991 as the true benchmark of a pension. The Ryan ALM CLI provides all of the calculations needed for efficient AA, ALM, and performance measurement.
Asset Liability Management (ALM)
It would be hard, if not impossible, for an asset manager to manage assets versus a generic market index if it came out annually, months after the end of the fiscal year with no transparency (index constituents not shown) and it wasn’t priced at the market. Well welcome to the pension world of liabilities. Liabilities are an annual actuarial calculation that has little or no transparency (projections usually not shown) and is priced at the ROA (GASB) as the discount rate. The ROA discount rate is certainly not a market rate you can buy to settle the liabilities. The ROA discount rate is one of the accounting distortions of economic reality the SoA referenced.
This was the message from the SoA. You need to create a set of economic books for ALM to function effectively. This is why a CLI is the critical step in ALM. Assets need to know what they are funding. The answer is usually net liabilities defined as (benefits + expenses) – (contributions) since contributions are the first source to fund the liability cash flows. Because net liabilities are not calculated in the actuarial report, the CLI should be a requirement to understand the net liability cash flows that asset cash flows must fund. Such net liability cash flows are also monthly which is another calculation made by the CLI.
If the true pension objective is to secure benefits in a cost-efficient manner with prudent risk, then cash flow matching (CFM) must be the proper and best ALM strategy. CFM used to be called dedication and has been a stable approach to pension investing for over 50 years. Bonds are the only asset class with the certainty of its cash flows. That is the intrinsic value in bonds and the reason why CFM should be the core portfolio of any pension. As the funded ratio improves, a higher allocation should be given to CFM to secure more and more benefits while stabilizing the funded ratio and contributions.
Performance Measurement
Once the CLI is in place, it will provide monthly calculations of the net liability growth rate (returns). Total asset growth (returns) versus the total net liability growth rate is the critical performance measurement. If all of the asset managers outperformed their generic market index benchmarks but total asset growth underperformed total net liability growth rate… the plan loses. This lost shows up in higher pension expense (contribution costs) and a lower funded status.
With a liability objective, the terms Alpha and Beta now take on a different perspective. Liability Alpha is the excess return of asset growth rate versus the liability growth rate. Liability Beta is now the portfolio that matches the liability cash flows it is funding. With the CLI, liability Beta is now a Liability Index Fund. Without a CLI, performance measurement is comparing assets versus assets… this is in sharp contrast to the pension objective of assets versus liabilities.
Pension Quiz
Is it better to have 10% ROA or reduce Funding Costs by 10%? The primary objective of a pension is to secure benefits (Retired Lives) in a cost- efficient manner...
Source: Pension Quiz
Is it better to have 10% ROA or reduce Funding Costs by 10%?
The primary objective of a pension is to secure benefits (Retired Lives) in a cost-efficient manner with prudent risk. The secondary objective is to enhance the funded status by maximizing the efficiency of asset allocation. However, most pensions have the stated objective as a… target absolute % return on assets (ROA).
Achieving a 10% ROA
History has proven that achieving the ROA does not mean you achieved a fully funded plan or even enhanced the funded status such that the $ deficit and contribution costs have been reduced. Simple math can prove this assertion as shown in Exhibit 1 where pension assets achieved the ROA growth target of 8% consistently for last 6 years. Liabilities are assumed to have the same 8% growth rate (actuarial discount rate = ROA). As a result, the funded ratio stays stable at 60% but the funded status $ deficit increases by 59.6% ($40 to 63.44) which would increase contribution costs accordingly. In order for contribution costs to remain stable or go lower, assets would have to match or outgrow liabilities by 5.33% annually (13.33% ROA minimum):
Exhibit 1
Funded Ratio = 60% ($40 Deficit)
Assets and Liabilities grow at ROA = 8%
| Assets | Liabilities | Funded Status/Ratio | ||||
|---|---|---|---|---|---|---|
| Year | Begin | End | Begin | End | $ Deficit | Funded Ratio |
| 1 | $60.00 | $64.80 | $100.00 | $108.00 | $43.20 | 60% |
| 2 | 64.80 | 69.98 | 108.00 | 116.64 | 46.66 | 60% |
| 3 | 69.98 | 75.58 | 116.64 | 125.97 | 50.39 | 60% |
| 4 | 75.58 | 81.63 | 125.97 | 136.05 | 54.42 | 60% |
| 5 | 81.63 | 88.16 | 136.05 | 146.93 | 58.77 | 60% |
| 6 | 88.16 | 95.21 | 146.93 | 158.65 | 63.44 | 60% |
If the actual asset growth rate was 10% instead of 8% (Exhibit 2), assets would grow to $106.29 over six years which creates a 67% funded ratio but a growing deficit of $52.36 or 30.9% greater than the initial $40 underfunding which increases contribution costs accordingly. Even a 70% funded ratio would increase the deficit to $45.91 or 14.78% greater. The pension return objective should be for assets to outgrow liabilities in economic dollars not actuarial dollars… it is relative $ returns that count not an absolute % return (ROA)! It is the economic funded status that counts not the funded ratio! Asset allocation needs to know the economic relative return needed to enhance the economic funded status.
Exhibit 2
Funded Ratio = 60% ($40 Deficit)
Assets grow at 10% but Liabilities grow at ROA = 8%
| Assets | Liabilities | Funded Status/Ratio | ||||
|---|---|---|---|---|---|---|
| Year | Begin | End | Begin | End | $ Deficit | Funded Ratio |
| 1 | $60.00 | $66.00 | $100.00 | $108.00 | $42.00 | 61% |
| 2 | 64.80 | 72.60 | 108.00 | 116.64 | 44.04 | 62% |
| 3 | 69.98 | 79.86 | 116.64 | 125.97 | 46.11 | 63% |
| 4 | 75.58 | 87.85 | 125.97 | 136.05 | 48.19 | 65% |
| 5 | 81.63 | 96.63 | 136.05 | 146.93 | 50.30 | 66% |
| 6 | 88.16 | 106.29 | 146.93 | 158.65 | 52.36 | 67% |
If we use market (economic) values for liabilities (ASC 715 discount rates), liabilities become highly interest rate sensitive… the economic truth. Using ASC 715 (AA corporates as a zero-coupon yield curve) as the discount rate for liabilities, a small increase in interest rates (+60 bp per year) would create negative growth in liabilities! Accordingly, any positive growth in assets would enhance the economic funded ratio and funded status. In just five years a 60% funded ratio could be 91% funded with just 5% asset growth while a 70% funded ratio would be 106% funded… and at no time did assets earn the ROA!
5-year Horizon
Liabilities ASC 715 Discount rate goes from 2.00% to 5.00%
Liabilities Growth Rate = (3.40%) at 12-year duration
| ----- Annual Growth Rate ----- | |||
|---|---|---|---|
| Assets | 5.00% | 6.00% | 7.00% |
| Liabilities | -3.40% | -3.40% | -3.40% |
| Alpha (Annual) | 8.40% | 9.40% | 10.40% |
| Funded Ratio @ 60% ... | 91.0% | 94.5% | 100.1% |
| @ 70% ... | 106.2% | 111.4% | 116.7% |
Achieving a 10% Funding Cost Savings
The primary objective of a pension is to fund liabilities in a cost-effective manner. It is a liability objective with cost considerations. Since 1999, most pensions have been hard hit by spiking contribution costs which were unexpected and not a budget forecast. For many plan sponsors, the contribution cost has risen as much as 5x to 10x from the fiscal 1999 level. Such costs are a product of the size of the funded status deficit where asset $ growth did not match liability $ growth over time. Indeed, it is the relative $ growth of pension assets vs. liability $ growth that is critical… not the absolute % return on pension assets.
The pension objective is best achieved by separating the assets into liquidity (Beta) and growth (Alpha) assets. The job of the liability Beta (liquidity) assets is to secure benefits (Retired Lives) in a cost-efficient manner with prudent risk. This is best accomplished through cash flow matching net liabilities chronologically. Ryan ALM has built a liability cash flow matching product, named the Liability Beta Portfolio™ (LBP), as a cost optimization model that matches and funds the net liability benefit payment schedule (minus contributions) at the lowest cost given the investment policy restrictions of our clients.
Since liabilities are funded initially by contributions, using the LBP model to cash flow match net liabilities chronologically may be able to fund more liabilities than you think. Assume that a 15% bond allocation could cash flow match the next 10 years of net Retired Lives payments chronologically. Based on the Ryan ALM Liability Beta Portfolio™ (LBP) model we show a cost savings of about 8% to 15% on cash flow matching the first 10 years of liabilities versus the ASC 715 discount rates (AA corporate zero-coupon bonds). For every $100 million in bonds used in our LBP model could save about $10 million or 10% in funding cost savings vs. the projected net liabilities. This cost savings is received immediately upon implementation of the Liability Beta Portfolio™ rather than over several years as forecasted returns suggest would happen, if at all. This is a serious cost reduction that reduces the volatility of the funded status and contributions and should be a major consideration of any pension asset allocation as the core portfolio.
Matching liabilities chronologically should also buy time for the growth assets (Alpha assets) to perform and outgrow liabilities without being diluted or unencumbered to partially fund liabilities as is the case so often today. Given time (10 years) most non-bond asset classes tend to outperform bonds. Since liabilities behave like bonds there is a high probability that Alpha assets (i.e. equities) could outperform liability growth over an extended time horizon especially at today’s low yield on bonds (and liabilities).
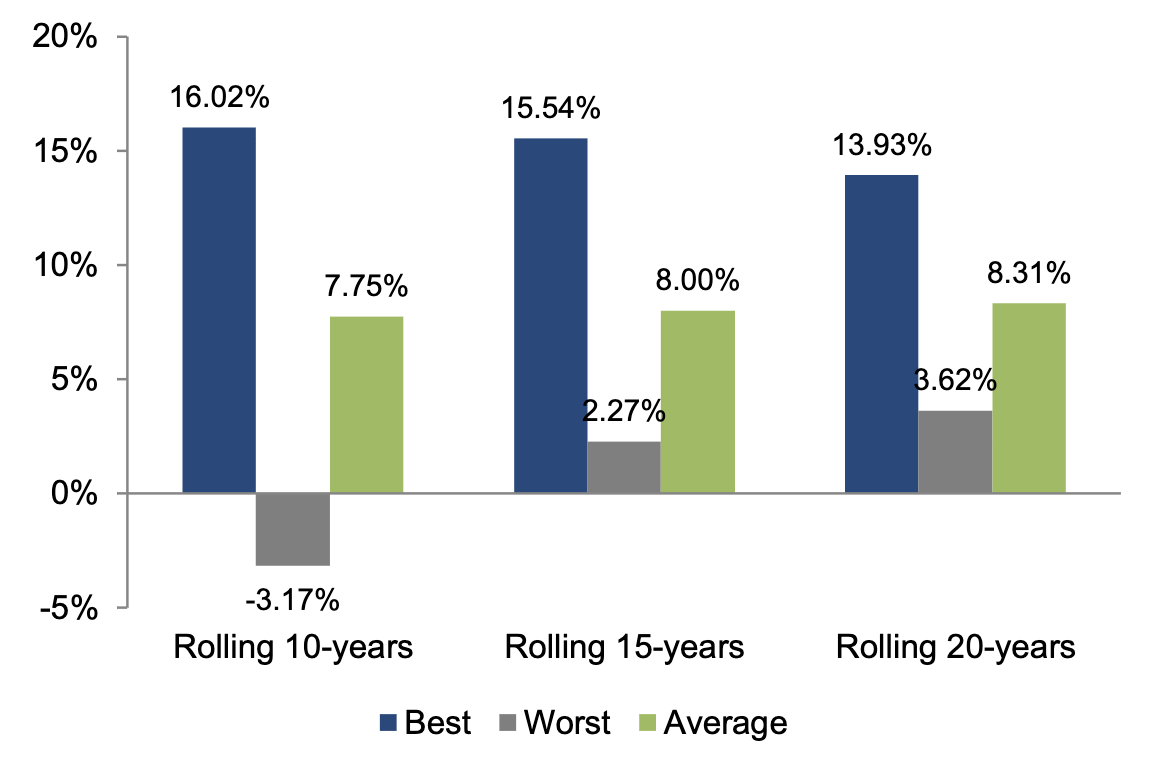
Given time, equities (S&P 500) perform well. The more time you give equities… the better the returns. Below are historical average S&P 500 return measurements for rolling 10-year, 15-year and 20-year periods ending 12/31/19 over a 50-year horizon starting 1969. The table shows an average return of 7.75% for rolling 10-years, 8.00% for rolling 15-years and 8.31% for rolling 20-years. The table below also suggests how difficult it is to average a 10% return for any extended period of time… even 9.00% is not a proven performance attainment:
Best, worst, and average returns
Solution: BUY TIME!
So how do you buy time? The answer is… cash flow match liabilities
How do you buy time? Cash flow match liabilities for the time you need.for the time you need. We recommend funding net Retired Lives out 10-years or more chronologically as the historical equity returns document. Our cash flow matching model (Liability Beta Portfolio™ or LBP) will calculate with precision the cost to fund net liabilities + expenses in a cost-effective manner chronologically.for the time you need. We recommend funding net Retired Lives out 10-years or more chronologically as the historical equity returns document. Our cash flow matching model (Liability Beta Portfolio™ or LBP) will calculate with precision the cost to fund net liabilities + expenses in a cost-effective manner chronologically.
Benefits: Cash Flow Matching
Our LBP also has numerous benefits that enhance the pension plan:
Secures Benefits
Cash flow match monthly Retired Lives benefits chronologically
Reduces Costs
LBP reduces Contribution, Funding and Asset Management Costs:
(LBP Fee = 15 bps… much less than most active bond managers)
Reduces Volatility
Reduces volatility of Contributions and Funded Ratio
Reduces Risk
Risk = Uncertainty of Funding Benefit Payments
(LBP funds benefits with certainty)Projected Benefit Payments are Future Values
(FV have NO Interest Rate Sensitive)
Enhances ROA
LBP should out yield most active management bond portfolios
Buys Time
LBP matches & funds liabilities chronologically
Moves deficit out longer extending the investment horizon
Buys Time for Non-bond assets (Alpha assets) to grow
No dilution of Alpha assets to fund benefits
However, most bond allocations are for active bond management versus a generic index benchmark(s). As the designer of the Lehman bond indexes from my days as the Director of Fixed Income Research at Lehman, I can tell you unequivocally that generic bond indexes look nothing like a projected pension benefit payment schedule. Such a mismatch will distort the cash flows and risk/reward behavior of assets vs. liabilities. The major issues and differences are:
Bond Assets Managed Versus Generic Bond Indexes
Does not fund benefits + expenses
Aggregate Index = low yielding @ 1.42%
Generic bond index =/= plan sponsor’s liabilities
Cash flows do not match plan sponsor’s liabilities
Index skewed to long bonds + Government securities
Performance (value added) = small to none (after fees)
But the worst difference and discrepancy is… all about cash flows. Active bond management is usually focused on outperforming the returns of a generic bond index benchmark. As a result, cash flows are not a consideration. But no matter what generic bond index is chosen; the fixed income assets cannot produce enough income cash flow to fund benefits + expenses. As a result, bonds will require help from performance (Alpha) assets to fund benefits + expenses. This will create dilution and disruption of the growth rate of such performance assets. With the Liability Beta Portfolio™ in place as the core portfolio to fund the shorter Retired Lives net liabilities (1-10 years), the Alpha assets are now free to grow long-term without being diluted or unencumbered to pay any benefits. The example below shows the cash flow difference of bonds managed to a generic index versus cash flow matching to liabilities:
It’s All about Cash Flows!
Bond allocation = $150 million
Liabilities (Net Benefits + Expenses) = $20 million per year
Bond management vs. generic bond index
YTM = 2.50%
Income Cash flow = $3.75 million annual ($2.50% x $150m)
Annual cash flow shortfall= $16.25 million ($20m - $3.75m)
Requires dilution of Alpha assets cash flow to fully fund liabilities
Cash Flow Matching next 10 years
YTM = 3.50% (skewed to A/BBB corporate bonds)
Cash flow = $20 million annual (fully funds liabilities)
(Cash flow includes principal + income + income reinvested)
No dilution of Alpha assets (allowed to grow unencumbered)
Observations:
Generic bond indexes cash flows look nothing like the projected benefit payment schedule of a pension
This leads to mismatch of cash flows and risk/reward behaviors … serious issue over time
Alpha assets need time to perform without any dilution of their cash flows to pay benefits
Cash flow matching (Beta assets) matches plus funds benefit payments chronologically
Cash flow matching will out yield current bond managers and enhance ROA
Cash flow matching buys time for Alpha assets to grow unencumbered
Let the performance (Alpha) assets perform (grow) as the liquidity (Beta) assets provide cash flow sufficient to fund net benefits plus expenses. Pension consultants and plan sponsors should consider installing an LBP as the core portfolio in asset allocation. The best value in bonds is the certainty of their cash flows. Bonds are usually not considered performance assets especially vs. pension liabilities which behave like bonds. As the Alpha assets perform vs. liability growth, enhancing the funded ratio, such excess returns could be transferred over to the Liability Beta Portfolio™ (LBP) to fund and de-risk more liabilities… Portable Alpha. Had this Portable Alpha discipline been in place during the 1990s when funded ratios grew to their highest historical levels with true surpluses… there would be no U.S. pension crisis today!
Conclusion (Logic)
So, is it better to have a 10% cost savings that is immediate and certain with numerous benefits itemized in this report? Or is it better to have an uncertain 10% ROA in the future that may or may not enhance funding (could increase the deficit)?
10% cost savings = $100 million reduced funding costs per $1 billion
10% ROA = 60% funded ratio on $1b = $400m deficit that grows to $522.60m in 6 years or 30.7% higher contribution costs = $122.6m.
Compare: $122.6m more in costs vs. $100m cost savings!!!
I think the facts speak clearly that… cost savings is the better goal and better fit with the primary objective of a pension… but you can have both:
To achieve the primary and secondary pension objective:
Primary = cash flow match net Retired Lives chronologically (Beta assets)
Secondary = have asset growth > liability growth not % ROA (Alpha assets)
Ryan ALM Pension Monitor 4Q’22
4Q 2022 Ryan ALM Pension Monitor (Through December 31, 2022) Pension plan liabilities need to be measured and monitored regularly. Without knowledge of plan liabilities, the allocation of plan assets...
Source: Ryan ALM Pension Monitor 4Q’22
(Through December 31, 2022)
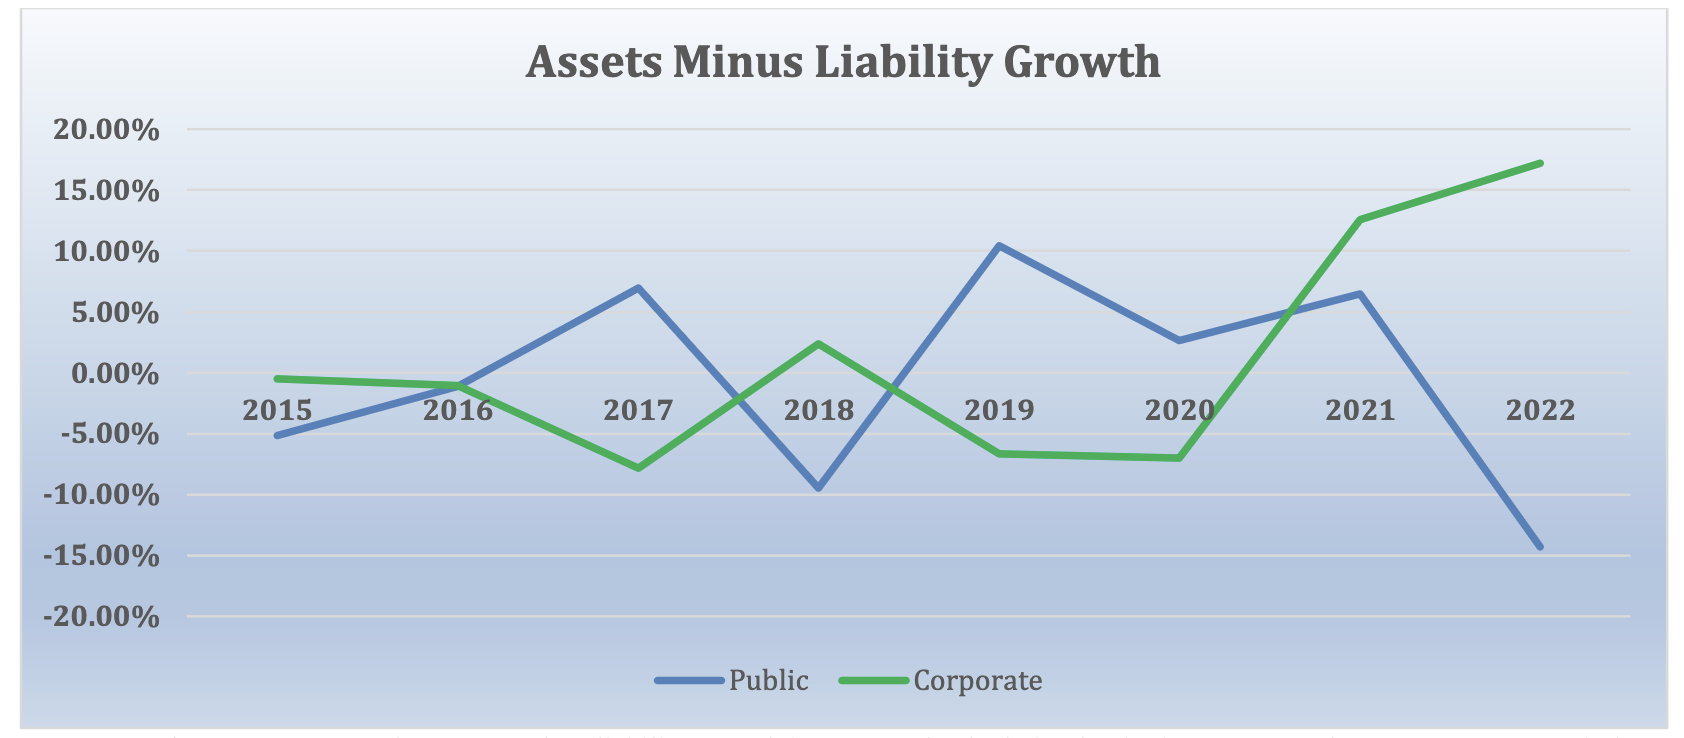
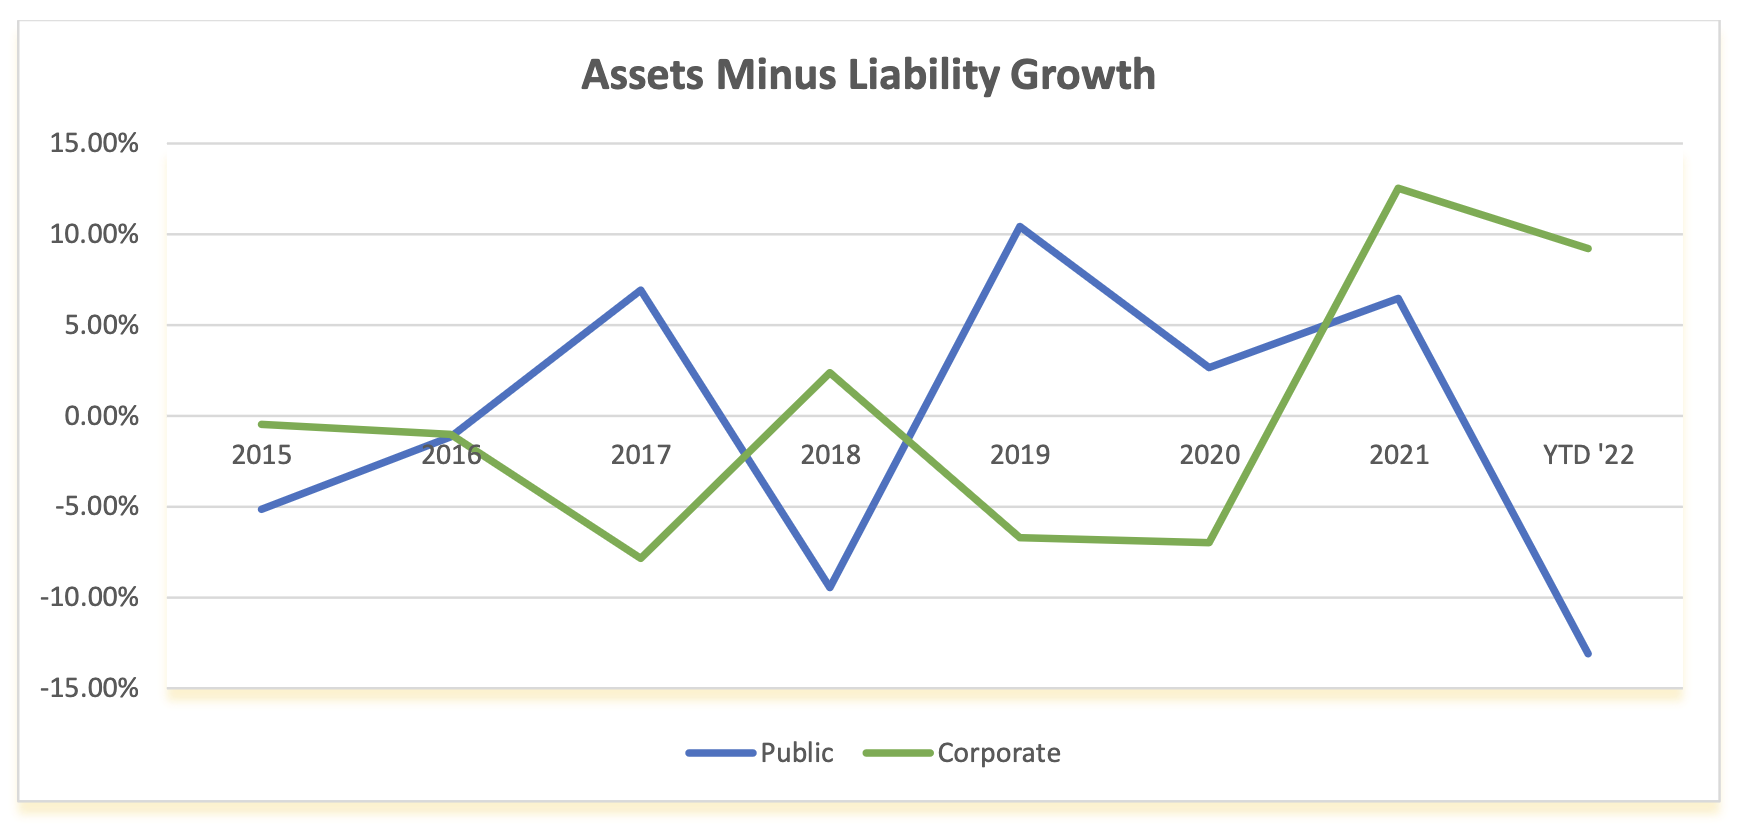
Pension plan liabilities need to be measured and monitored regularly. Without knowledge of plan liabilities, the allocation of plan assets cannot be done efficiently or appropriately. The funded ratio/status of pension plans are present value calculations. Each type of plan is governed by accounting rules and actuarial practices, which determine the discount rate used to calculate the present value of liabilities. Single employer corporate plans are under ASC 715 (FASB) discount rates (AA corporate zero-coupon yield curve); multiemployer plans and public plans use the ROA (return on asset assumption) as the liability discount rate. The difference in liability growth between these plans can be quite significant (see 2022), which will affect funded status and contribution levels.
The table below compares these different liability growth rates (based on a 12-year average duration) versus the asset growth rate based on the P&I asset allocation survey of the top 1,000 plans which is updated each year. The graph below shows the contrasting annual differences of asset versus liability growth for corporate and public plans since 2015. The impact of different accounting rules is massive, and none greater than this year.
| ASSET ALLOCATION | YTD Return | Corporate | Public | Union |
|---|---|---|---|---|
|
Domestic Stock International Stock Global Equity Domestic Fixed Income Global Fixed Income Cash Private Equity Real Estate Equity* Other |
-18.1% -14.0% -18.0% -13.0% -18.3% 1.1% 12.0% 10.8% 10.3% |
11.1% 6.5% 10.4% 46.7% 1.3% 2.0% 8.5% 4.1% 9.4% |
24.4% 16.3% 5.3% 20.2% 1.7% 2.0% 12.7% 7.9% 9.5% |
24.7% 8.6% 11.4% 28.0% 0.9% 0.6% 8.2% 9.3% 8.3% |
| TOTAL ASSETS Growth Rate | -8.7% | -7.2% | -8.7% | |
| LIABILITIES Growth Rate | -26.6% | 7.0% | 7.3% | |
| Asset Growth – Liability Growth | 17.9% | -14.2% | -16.0% |
Index Benchmarks: Domestic Stock = S&P 500; Int’l Stock = EAFE, Global Equity = All Country World; Domestic Fixed Income = BB Aggregate; Global Fixed Income = FTSE World Gov’t (unhedged); Cash = Ryan ALM Cash Index; Private Equity =10-year return for the R2500 + 2%; *Real estate Equity =NFI-DP Index (delayed one month); Alternative Investments and Other = CPI-U & 3%.
Footnote: The measurement of asset growth to liability growth is an annual calculation beginning on December 31, 2015. For periods shorter than 1-year, the observation is a YTD calculation.
The question that must be asked: If two pension systems (one public and the other private) have similar asset allocations and are investing in the same markets, how is it possible that they have such meaningful differences in outcomes? These differences, caused by different reporting requirements, may distort contributions and funded status, and may influence benefit decisions unnecessarily.
Ryan ALM Pension Monitor 3Q’22
3Q 2022 Ryan ALM Pension Monitor (Through September 30, 2022) Pension plan liabilities need to be measured and monitored regularly. Without knowledge of plan liabilities, the allocation of plan assets...
Source: Ryan ALM Pension Monitor 3Q’22
(Through September 30, 2022)
Pension plan liabilities need to be measured and monitored regularly. Without knowledge of plan liabilities, the allocation of plan assets cannot be done efficiently or appropriately.
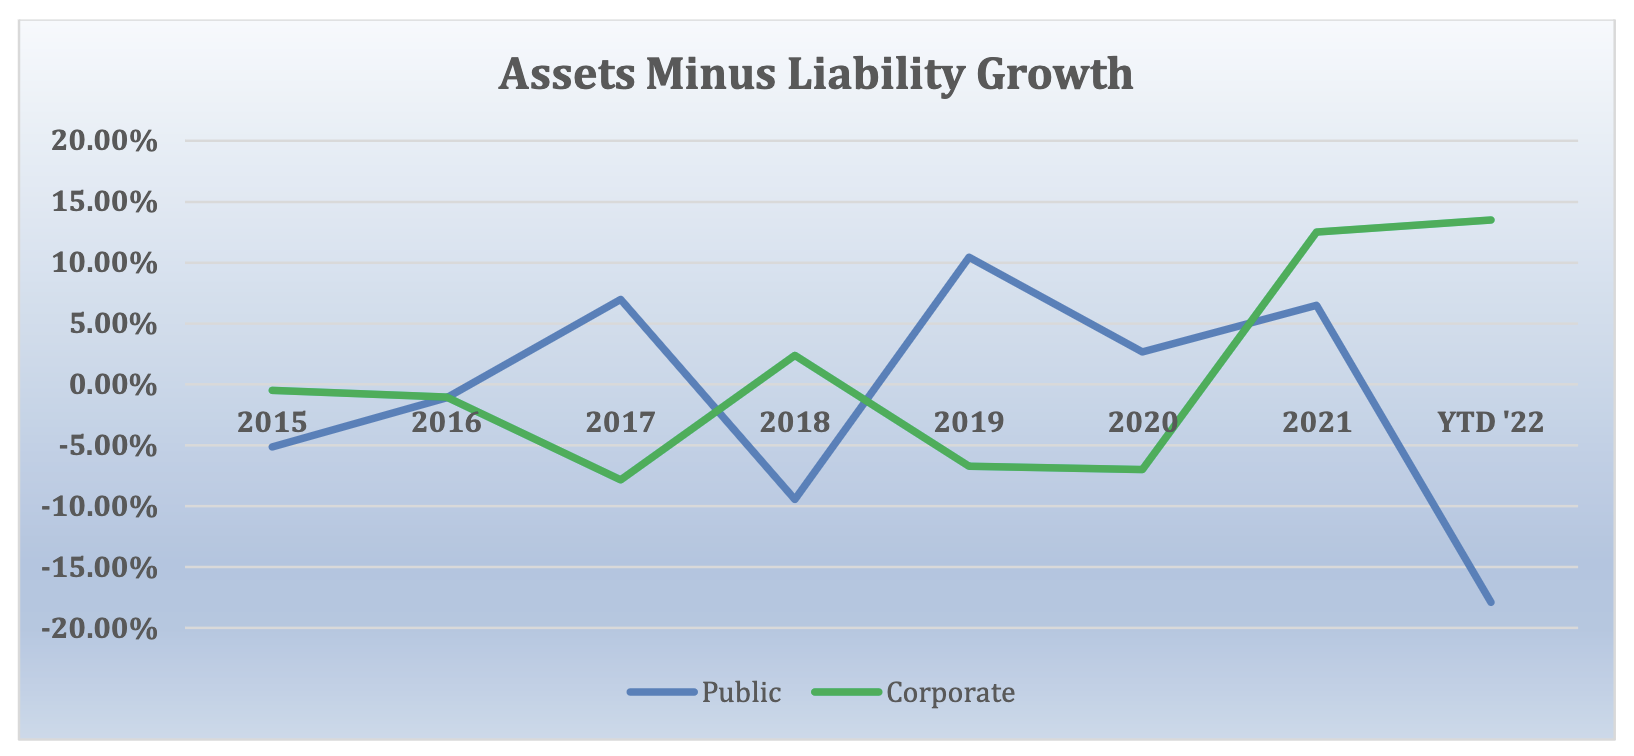
The funded ratio/status of pension plans are present value calculations. Each type of plan is governed by accounting rules and actuarial practices, which determine the discount rate used to calculate the present value of liabilities. Single employer corporate plans are under ASC 715 (FASB) discount rates (AA corporate zero-coupon yield curve); multiemployer plans and public plans use the ROA (return on asset assumption) as the liability discount rate. The difference in liability growth between these plans can be quite significant, which will affect funded status and contribution levels. The table below compares these different liability growth rates (based on a 12-year average duration) versus the asset growth rate using the P&I asset allocation survey of the top 1,000 plans which is updated each year. The graph below shows the contrasting annual differences of asset versus liability growth for corporate and public plans since 2015. The impact of different accounting rules is massive, especially during 2022’s rising rate environment.
| ASSET ALLOCATION | YTD Return | Corporate | Public | Union |
|---|---|---|---|---|
|
Domestic Stock International Stock Global Equity Domestic Fixed Income Global Fixed Income Cash Private Equity Real Estate Equity* Other |
-23.9% -27.1% -25.3% -14.6% -21.3% 0.2% 11.6% 8.6% 9.1% |
11.1% 6.5% 10.4% 46.7% 1.3% 2.0% 8.5% 4.1% 9.4% |
24.4% 16.3% 5.3% 20.2% 1.7% 2.0% 12.7% 7.9% 9.5% |
24.7% 8.6% 11.4% 28.0% 0.9% 0.6% 8.2% 9.3% 8.3% |
| TOTAL ASSETS Growth Rate | -12.0% | -11.9% | -12.9% | |
| LIABILITIES Growth Rate* | -25.9% | 5.6% | 5.6% | |
| Asset Growth – Liability Growth | 13.9% | -17.5% | -18.5% |
Index Benchmarks: Domestic Stock = S&P 500; Int’l Stock = EAFE, Global Equity = All Country World; Domestic Fixed Income = BB Aggregate; Global Fixed Income = FTSE World Gov’t (unhedged); Cash = 3 mo. T-Bill; Private Equity =10-year return for the R2500 + 2%; *Real estate Equity =NFI-DP Index (delayed one month); Alternative Investments and Other = CPI-U & 3%.
*Liabilities = Ryan ALM Custom Liability Indexes (CLI)
Footnote: The measurement of asset growth to liability growth is an annual calculation beginning on December 31, 2015. For periods shorter than 1-year, the observation is a YTD calculation.
Ryan ALM Pension Monitor 2Q
Ryan ALM Pension Monitor (Through June 30, 2021) Pension plan liabilities need to be measured and monitored regularly. Without knowledge of plan liabilities, the allocation of plan assets cannot be...
Source: Ryan ALM Pension Monitor 2Q
Ryan ALM Pension Monitor
(Through June 30, 2021)
Pension plan liabilities need to be measured and monitored regularly. Without knowledge of plan liabilities, the allocation of plan assets cannot be done appropriately.
The funded ratio/status of pension plans are present value calculations. Each type of plan is governed by accounting rules and actuarial practices, which determine the discount rate used to calculate the present value of liabilities. Single employer corporate plans are under ASC 715 (FASB) discount rates (AA corporate zero-coupon yield curve); multiemployer plans and public plans use the ROA (return on asset assumption) as the liability discount rate. The difference in liability growth between these plans can be quite significant, which will affect funded status and contribution levels.
The table below compares these different liability growth rates (based on 12-year average duration) versus the asset growth rate based on the P&I asset allocation survey of the top 1,000 plans. The graph below shows the contrasting annual differences of asset versus liability growth for corporate and public plans since 2015.
| ASSET ALLOCATION | YTD Return | Corporate | Public | Union |
|---|---|---|---|---|
|
Domestic Stock International Stock Global Equity Domestic Fixed Income Global Fixed Income Cash Private Equity Real Estate Equity* Other |
-20.0% -19.2% -20.5% -10.4% -14.8% -0.1% 6.2% 6.9% 6.2% |
11.1% 6.5% 10.4% 46.7% 1.3% 2.0% 8.5% 4.1% 9.4% |
24.4% 16.3% 5.3% 20.2% 1.7% 2.0% 12.7% 7.9% 9.5% |
24.7% 8.6% 11.4% 28.0% 0.9% 0.6% 8.2% 9.3% 8.3% |
| TOTAL ASSETS Growth Rate | -9.2% | -9.5% | -10.3% | |
| LIABILITIES Growth Rate | -18.3% | 3.7% | 3.7% | |
| Asset Growth – Liability Growth | 9.1% | -13.2% | -14.0% |
Index Benchmarks: Domestic Stock = S&P 500; Int’l Stock = EAFE, Global Equity = All Country World; Domestic Fixed Income = BB Aggregate; Global Fixed Income = FTSE World Gov’t (unhedged); Cash = 3 mo. T-Bill; Private Equity =10-year return for the R2500 + 2%; Real estate Equity =NCREIF Index; Alternative Investments and Other = CPI & 3%.
Liabilities: ASC 715 discount rate, produced by Ryan ALM, is 2.35% and GASB ROA is 7.0% annually
Footnote: The measurement of asset growth to liability growth is an annual calculation beginning on December 31, 2015. For periods shorter than 1-year, the observation is a YTD calculation.
Ryan ALM Pension Monitor Q1 ‘22
Ryan ALM Pension Monitor (Through March 31, 2022) Pension plan liabilities need to be measured and monitored regularly. Without knowledge of plan liabilities, the allocation of plan assets cannot be...
Source: Ryan ALM Pension Monitor 1Q
(Through March 31, 2022)
Pension plan liabilities need to be measured and monitored regularly. Without knowledge of plan liabilities, the allocation of plan assets cannot be done efficiently or appropriately.
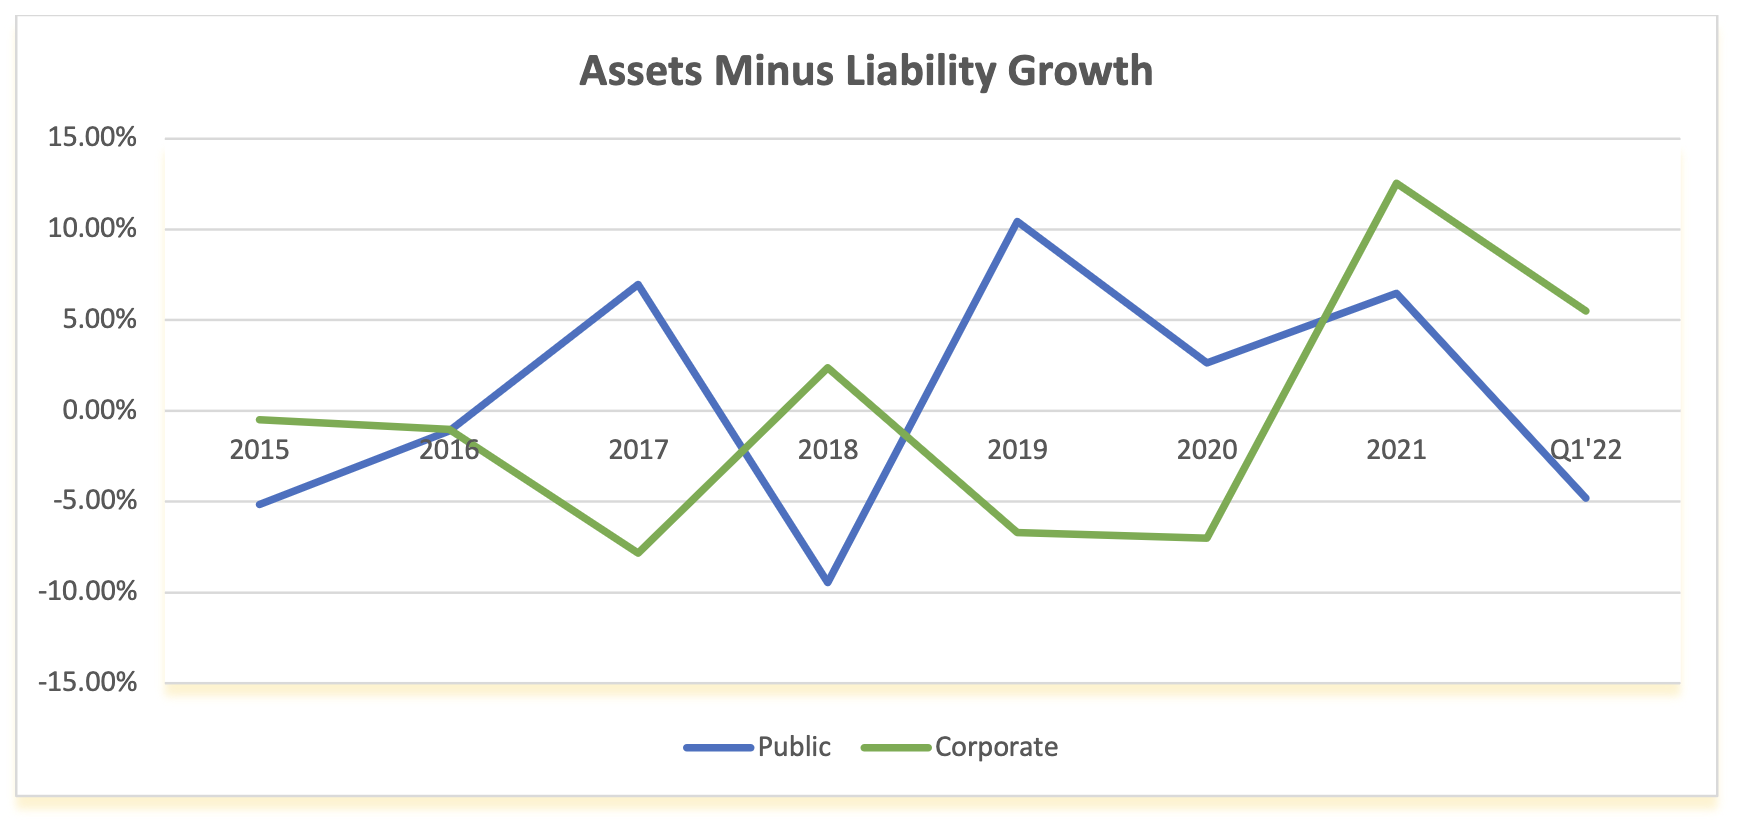
The funded ratio/status of pension plans are present value calculations. Each type of plan is governed by accounting rules and actuarial practices, which determine the discount rate used to calculate the present value of liabilities. Single employer corporate plans are under ASC 715 (FASB) discount rates (AA corporate zero-coupon yield curve); multiemployer plans and public plans use the ROA (return on asset assumption) as the liability discount rate. The difference in liability growth between these plans can be quite significant, which will affect funded status and contribution levels.
The table below compares these different liability growth rates (based on a 12-year average duration) versus the asset growth rate based on the P&I asset allocation survey of the top 1,000 plans which is updated each year. The graph below shows the contrasting annual differences of asset versus liability growth for corporate and public plans since 2015. The impact of different accounting rules is massive.
| ASSET ALLOCATION | Q1’22 Return | Corporate | Public | Union |
|---|---|---|---|---|
|
Domestic Stock International Stock Global Equity Domestic Fixed Income Global Fixed Income Cash Private Equity Real Estate Equity* Other |
-4.6% -5.8% -5.2% -5.9% -6.5% -0.1% 3.5% -1.3% 3.5% |
11.1% 6.5% 10.4% 46.7% 1.3% 2.0% 8.5% 4.1% 9.4% |
24.4% 16.3% 5.3% 20.2% 1.7% 2.0% 12.7% 7.9% 9.5% |
24.7% 8.6% 11.4% 28.0% 0.9% 0.6% 8.2% 9.3% 8.3% |
| TOTAL ASSETS Growth Rate | -3.7% | -3.0% | -3.5% | |
| LIABILITIES Growth Rate | -9.2% | 1.8% | 1.8% | |
| Asset Growth – Liability Growth | 5.5% | -4.8% | -5.3% |
Index Benchmarks: Domestic Stock = S&P 500; Int’l Stock = EAFE, Global Equity = All Country World; Domestic Fixed Income = BB Aggregate; Global Fixed Income = FTSE World Gov’t (unhedged); Cash = 3 mo. T-Bill; Private Equity =10-year return for the R2500 + 2%; *Real estate Equity =NFI-DP Index (delayed one month); Alternative Investments and Other = CPI-U & 3%.
Footnote: The measurement of asset growth to liability growth is an annual calculation beginning on December 31, 2015. For periods shorter than 1-year, the observation is a YTD calculation.