
Ryan ALM
White Papers
Browse
Magnificent 7: Caveat Emptor!
As pension watchdogs, Ryan ALM is always interested and concerned about trends that may affect the funded status of pensions. Since the major asset holding of most pensions is the...
Source: Magnificent 7: Caveat Emptor!
As pension watchdogs, Ryan ALM is always interested and concerned about trends that may affect the funded status of pensions. Since the major asset holding of most pensions is the S&P 500, we are on the alert for anything that may affect this valuable asset. I recently attended a CFA dinner where Rob Arnott, founder and chairman of Research Affiliates a subdivision of PIMCO was the guest speaker. Rob is quite articulate and brilliant on his assessments and forecasts. He was concerned about the valuation of the Magnificent 7 and thought the P/E multiples may not be sustainable. I share Rob’s concerns for the following reasons.
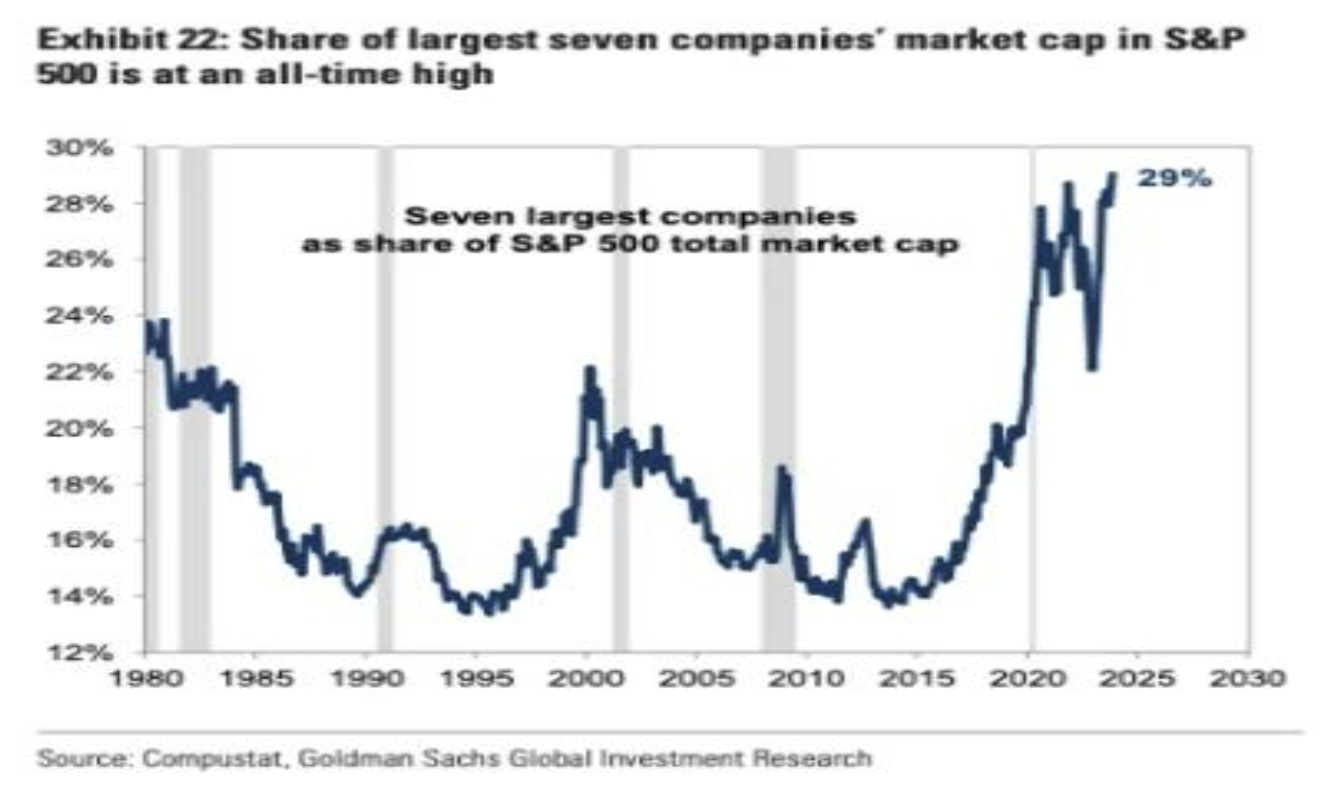
Apple became the first $3 trillion market valuation in America’s history. The seven largest capitalized technology stocks (i.e. the Magnificent 7) have been the main driver of returns for the S&P 500 for several years and certainly in 2023 YTD. As of December 1, this group had a total return = 98.79% based on the Bloomberg Magnificent Seven equal weighted index. At the same time the S&P 500 has a YTD return of 20.96%. According to BOA Global Investment Research, the Mag 7 account for 29.6% of the S&P 500 market capitalization. The newly released Bloomberg Large Cap index without the Magnificent 7 (B500XM7T) posted a YTD return of 7.6% which is 36.4% of the YTD S&P 500 return of 20.96%. This means that the Mag 7 has a YTD weighted group return of 13.33% which accounts for 63.6% of the S&P 500 YTD return (as of 12/01/23).
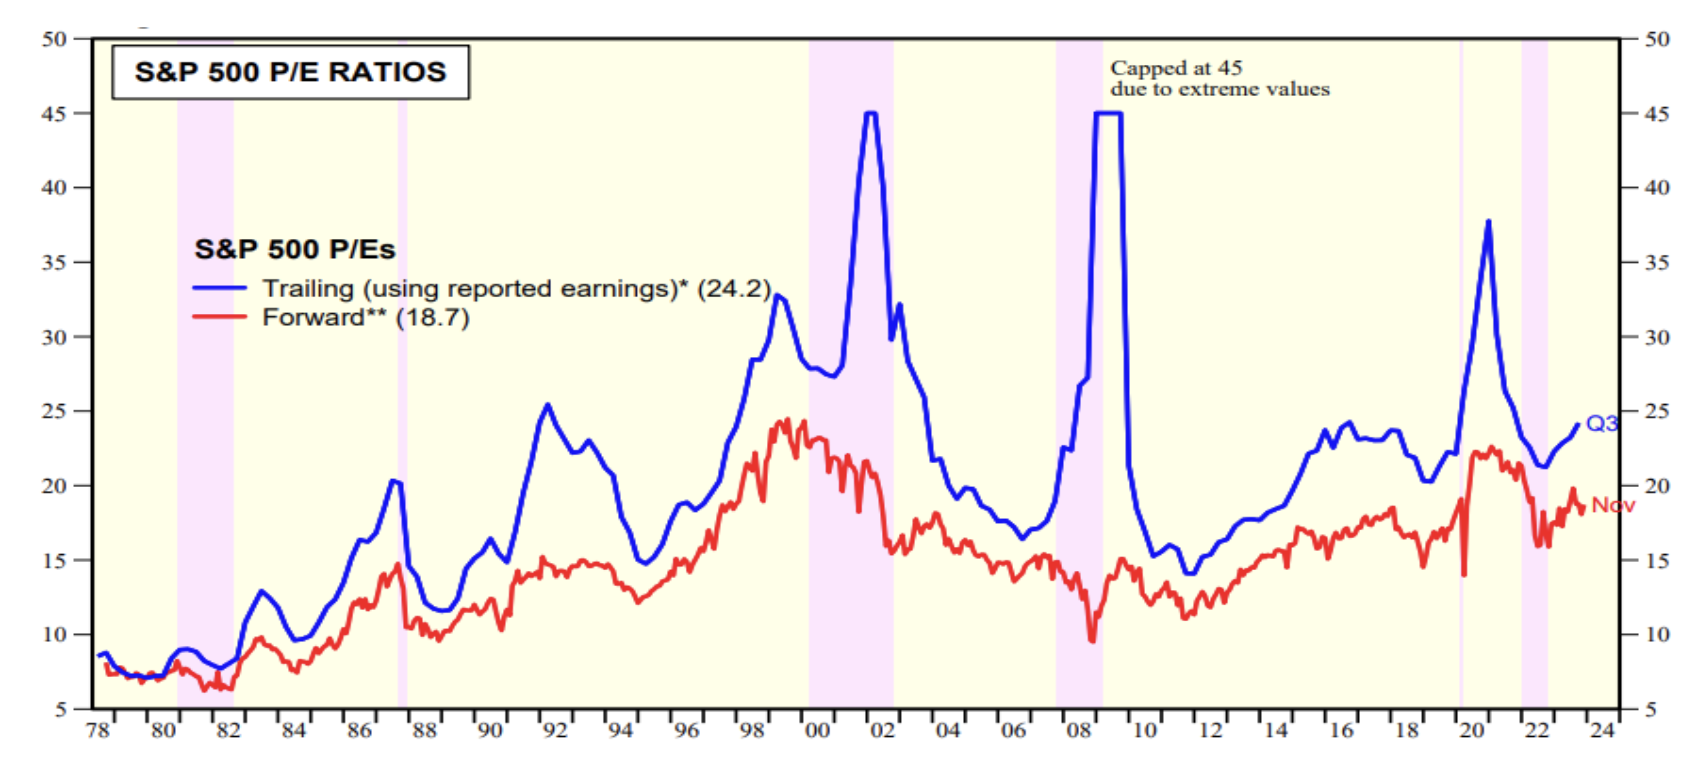
The Mag 7 should continue to grow well given their product line, market share, higher sales growth, higher margins, strong balance sheet and greater re-investment ratio in their market. The main question is one of valuation. Although it may be hard to assess a proper P/E multiple for each of the Mag 7, the wide array of P/E multiples and comparison to the market seem quite overvalued… S&P 500 multiple = 24.2x current and 18.7x forward (source: Yardeni). Tesla at 76.9x current/61.7x forward seems hard to justify especially with earnings growth of -6.1% over the last 12 months. Alphabet, Apple, Meta and even Microsoft trailing 12 months EPS growth do not seem robust enough to merit their valuation either.
| Stock Symbol | Company | PE current | PE forward | Market Capitalization | EPS Growth 5-year Avg. | EPS Growth Last 12 mos. |
|---|---|---|---|---|---|---|
| GOOG | Alphabet | 25.38x | 19.80x | $1.66 trillion | 25.4% | 3.4% |
| AMZN | Amazon | 76.69x | 41.03x | $1.52t | 63.0% | 74.1% |
| AAPL | Apple | 31.55x | 27.16 | $3.01t | 14.4% | 0.3% |
| META | META | 28.10x | 18.17x | $0.82t | 8.9% | 3.1% |
| MSFT | Microsoft | 36.08x | 28.76x | $2.77t | 18.4% | 10.5% |
| NVDA | Nvidia | 61.48x | 22.61x | $1.15t | 27.7% | 264.5% |
| TSLA | Tesla | 76.87x | 61.72x | $0.76t | 40.5% | -6.1% |
| S&P 500 | 24.2x | 18.7x | $37.7t |
Goldman Sachs Global Investment Research is forecasting a 6% growth for 2024 for the S&P 500. This does not validate the P/E multiples of the S&P 500.
“Investors should be skeptical of history-based models. Beware of geeks bearing formulas”
Warren Buffett
Ryan ALM Pension Monitor YTD 2023
YTD2023 Ryan ALM Pension Monitor (Through June 30, 2023) Pension plan liabilities need to be measured and monitored regularly. Without knowledge of plan liabilities, the allocation of plan assets cannot...
Source: Ryan ALM Pension Monitor YTD 2023
(Through June 30, 2023)
Pension plan liabilities need to be measured and monitored regularly. Without knowledge of plan liabilities, the allocation of plan assets cannot be done efficiently or appropriately. The funded ratio/status of pension plans are present value calculations. Each type of plan is governed by accounting rules and actuarial practices, which determine the discount rate used to calculate the present value of liabilities. Single employer corporate plans are under ASC 715 (FASB) discount rates (AA corporate zero-coupon yield curve); multiemployer plans and public plans use the ROA (return on asset assumption) as the liability discount rate. The difference in liability growth between these plans can be quite significant (see 2022’s differential of 31.5%), which will affect funded status and contribution levels.
The table below compares these different liability growth rates (based on a 12-year average duration) versus the asset growth rate based on the P&I asset allocation survey of the top 1,000 plans which is updated annually.
| ASSET ALLOCATION | YTD 2023 Return | Corporate | Public | Union |
|---|---|---|---|---|
|
Domestic Stock International Stock Global Equity Domestic Fixed Income Global Fixed Income Cash Private Equity Real Estate Equity* Other |
16.9% 12.2% 14.3% 2.1% 1.7% 2.3% 5.8% -5.4% 3.6% |
11.1% 6.1% 6.3% 44.4% 0.9% 2.2% 12.4% 5.5% 11.1% |
22.1% 13.4% 4.5% 19.4% 1.6% 1.6% 15.1% 11.6% 10.7% |
18.7% 9.1% 13.6% 28.9% 0.0% 0.7% 10.7% 9.4% 8.9% |
| TOTAL ASSETS Growth Rate | 5.3% | 7.1% | 7.3% | |
| LIABILITIES Growth Rate** | 4.2% | 3.6% | 3.6% | |
| Asset Growth – Liability Growth | 1.1% | 3.5% | 3.7% |
Index Benchmarks: Domestic Stock = S&P 500; Int’l Stock = EAFE, Global Equity = All Country World; Domestic Fixed Income = BB Aggregate; Global Fixed Income = FTSE World Gov’t (unhedged); Cash = Ryan ALM Cash Index; Private Equity =10-year return for the R2500 + 2%; *Real estate Equity =NFI-DP Index (one month lag); Alternative Investments and Other = CPI-U & 3%.
** Liabilities (corporate) = Ryan ALM ASC 715 discount rate and Liabilities (Public, Multiemployer) = 7.25% ROA
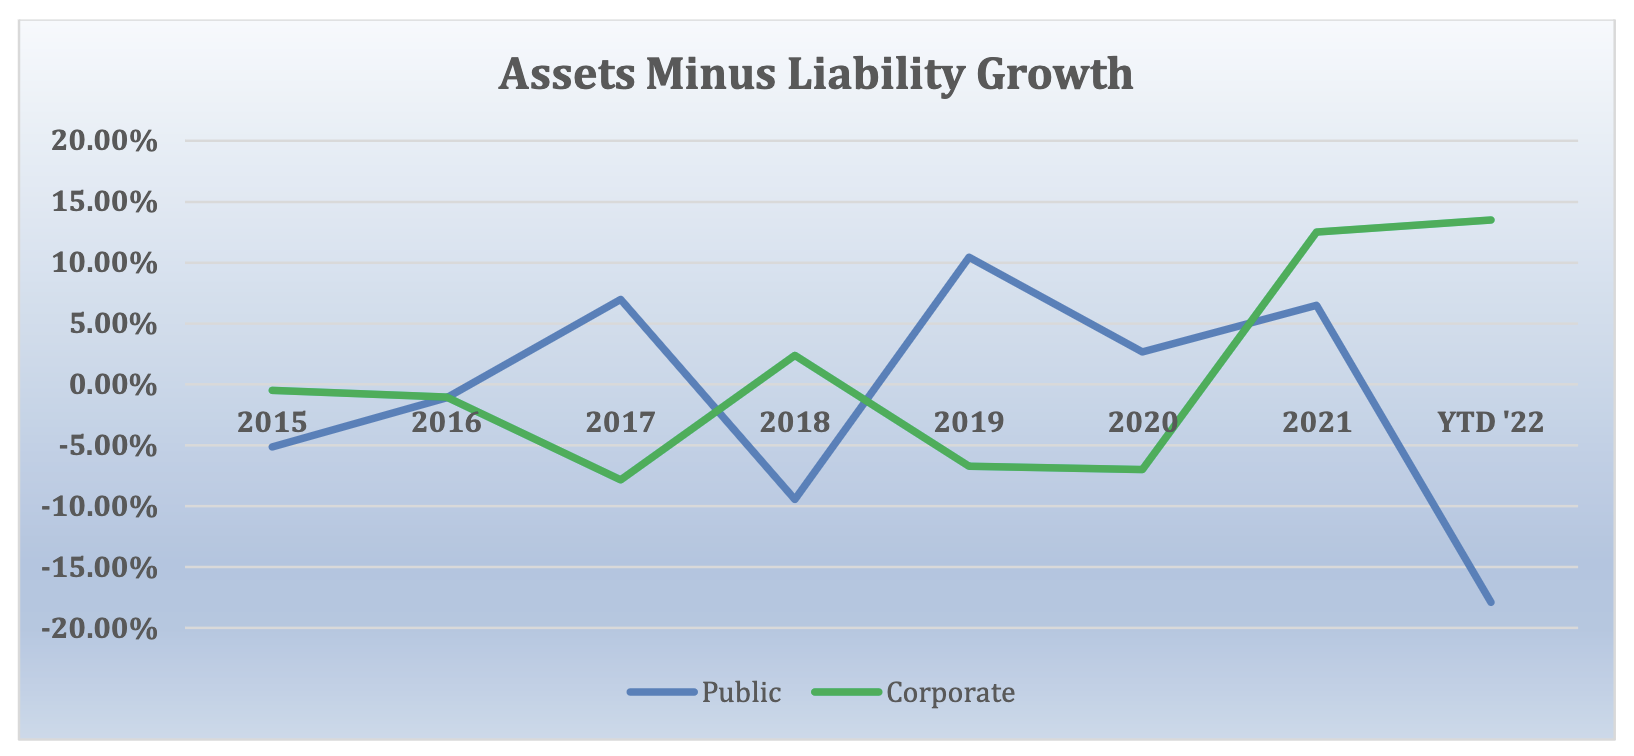
The graph below shows the contrasting annual differences of asset versus liability growth for corporate and public plans since 2015. The impact of different accounting rules (FASB vs. GASB) can create confusion, as reflected in the chart below.
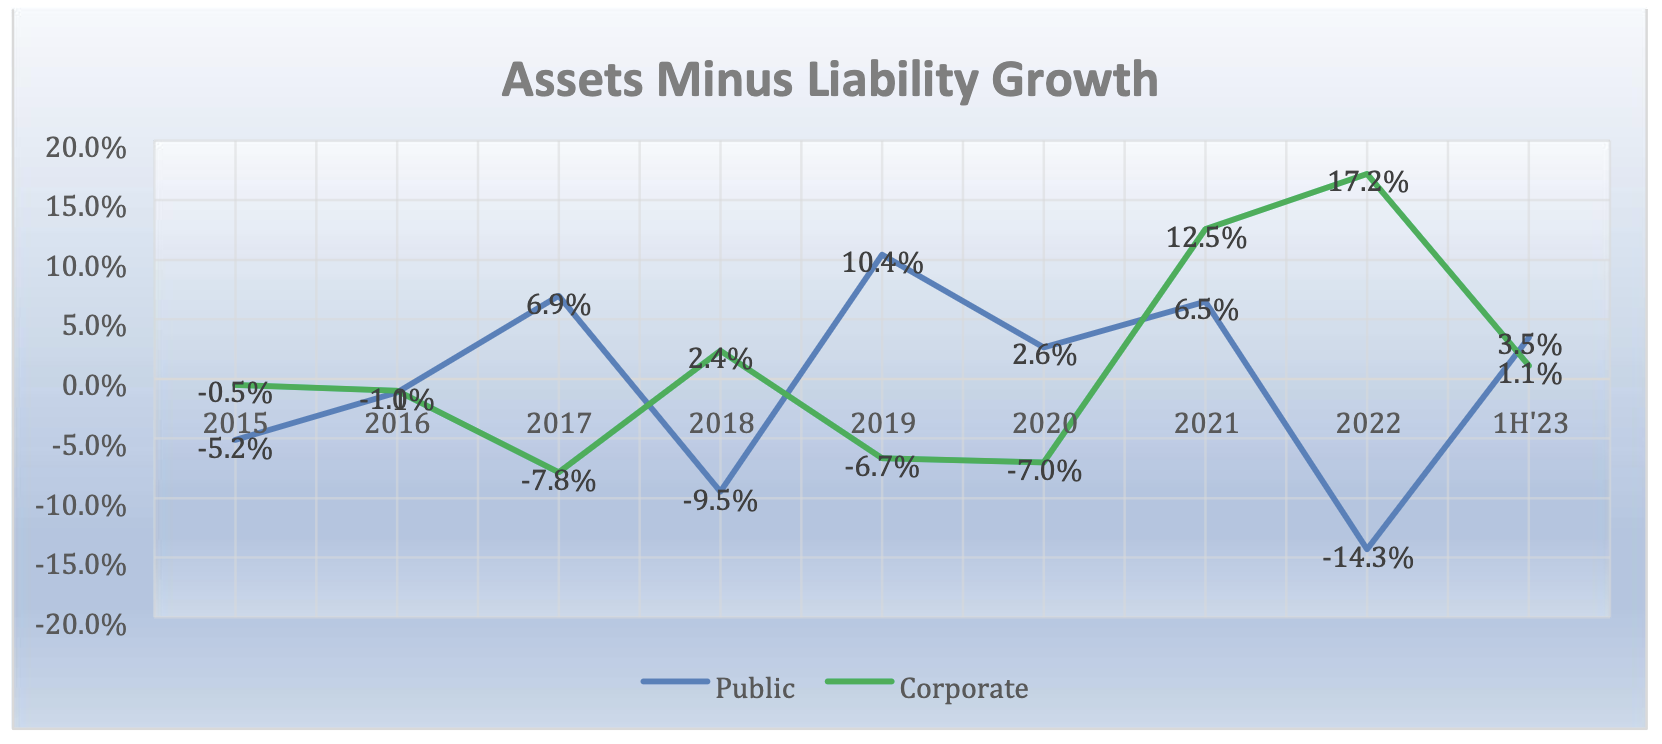
Footnote: The measurement of asset growth to liability growth is an annual calculation beginning on December 31, 2015. For periods shorter than 1-year, the observation is a YTD calculation.
With regard to the first half of 2023, Corporate funding underperformed Public funding as declining interest rates YTD had a slightly greater impact on the present value of a plan’s future benefits. In addition, the much higher exposure to US fixed income within corporate pension plans (44.4%) versus both public (19.4%) and multiemployer (28.9%) and the far less exposure to US equities (11.1%) versus publics (24.4%) and multiemployer (21.8%) had a meaningful impact on the average total return for those plan types.
Ryan ALM Pension Monitor Q1’23
1Q 2023 Ryan ALM Pension Monitor (Through March 31, 2023) Pension plan liabilities need to be measured and monitored regularly. Without knowledge of plan liabilities, the allocation of plan assets...
Source: Ryan ALM Pension Monitor Q1’23
(Through March 31, 2023)
Pension plan liabilities need to be measured and monitored regularly. Without knowledge of plan liabilities, the allocation of plan assets cannot be done efficiently or appropriately. The funded ratio/status of pension plans are present value calculations. Each type of plan is governed by accounting rules and actuarial practices, which determine the discount rate used to calculate the present value of liabilities. Single employer corporate plans are under ASC 715 (FASB) discount rates (AA corporate zero-coupon yield curve); multiemployer plans and public plans use the ROA (return on asset assumption) as the liability discount rate. The difference in liability growth between these plans can be quite significant (see 2022), which will affect funded status and contribution levels.
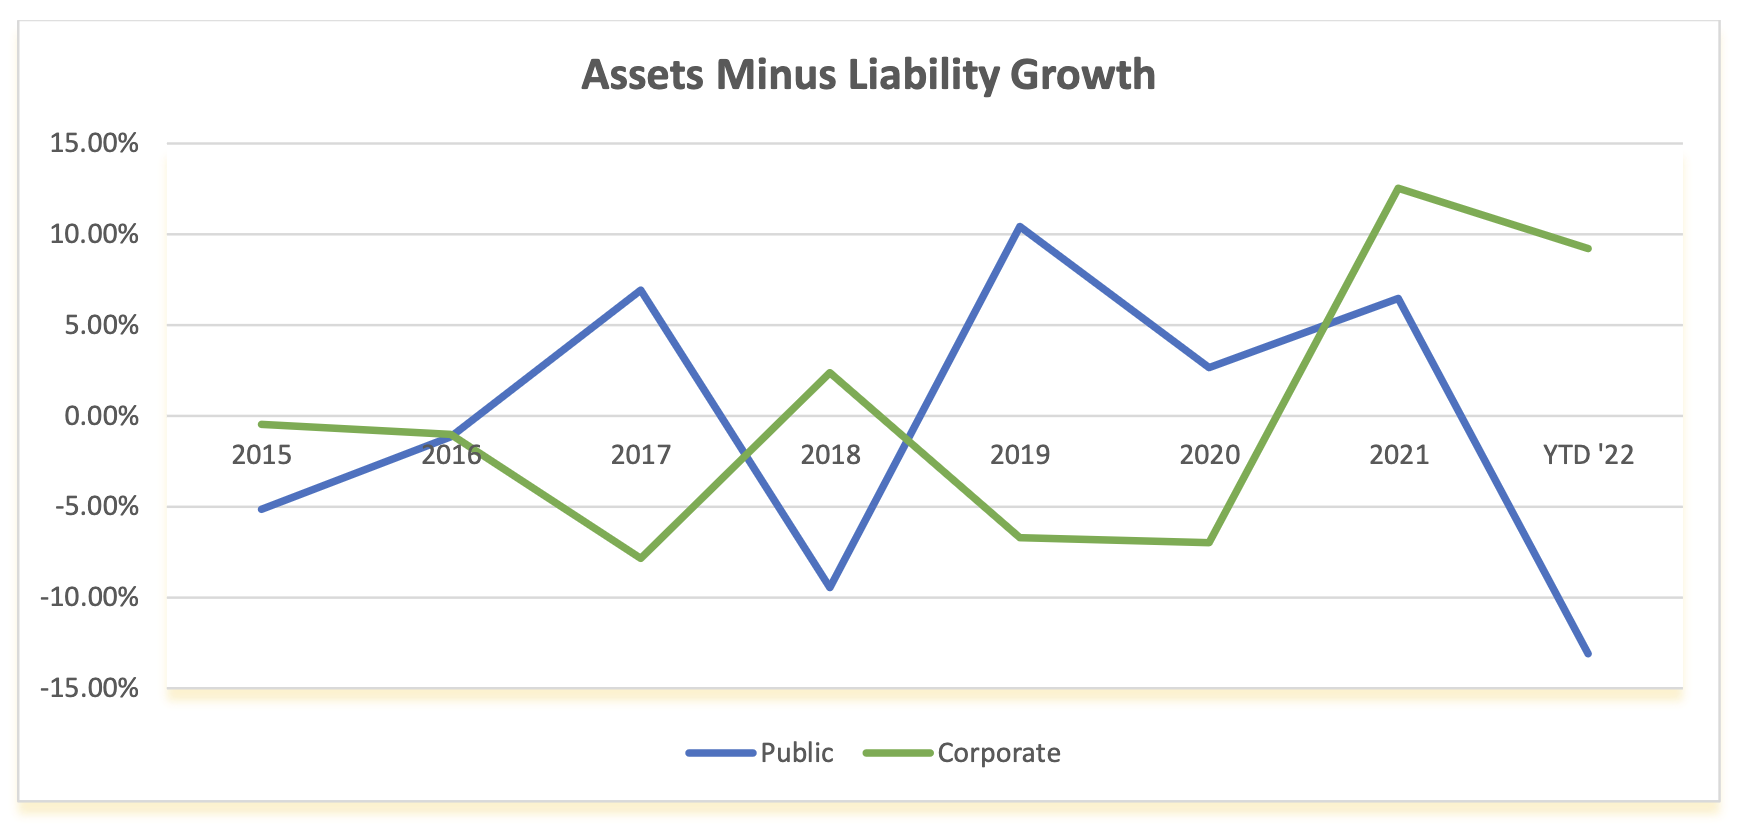
The table below compares these different liability growth rates (based on a 12-year average duration) versus the asset growth rate based on the P&I asset allocation survey of the top 1,000 plans which is updated each year. The graph below shows the contrasting annual differences of asset versus liability growth for corporate and public plans since 2015. The impact of different accounting rules can create confusion, as reflected in the chart below. Corporations underperformed as declining interest rates increased the present value of a plan’s future benefits.
| ASSET ALLOCATION | Q1’23 Return | Corporate | Public | Union |
|---|---|---|---|---|
|
Domestic Stock International Stock Global Equity Domestic Fixed Income Global Fixed Income Cash Private Equity Real Estate Equity* Other |
7.5% 8.7% 6.8% 3.0% 3.5% 1.2% 3.0% -5.2% 1.8% |
11.1% 6.1% 6.3% 44.4% 0.9% 2.2% 12.4% 5.5% 11.1% |
22.1% 13.4% 4.5% 19.4% 1.6% 1.6% 15.1% 11.6% 10.7% |
18.7% 9.1% 13.6% 28.9% 0.0% 0.7% 10.7% 9.4% 8.9% |
| TOTAL ASSETS Growth Rate | 3.5% | 4.0% | 3.8% | |
| LIABILITIES Growth Rate | 7.2% | 1.8% | 1.8% | |
| Asset Growth – Liability Growth | -3.7% | 2.2% | 2.0% |
Index Benchmarks: Domestic Stock = S&P 500; Int’l Stock = EAFE, Global Equity = All Country World; Domestic Fixed Income = BB Aggregate; Global Fixed Income = FTSE World Gov’t (unhedged); Cash = Ryan ALM Cash Index; Private Equity =10-year return for the R2500 + 2%; *Real estate Equity =NFI-DP Index (one quarter lag); Alternative Investments and Other = CPI-U & 3%.

Footnote: The measurement of asset growth to liability growth is an annual calculation beginning on December 31, 2015. For periods shorter than 1-year, the observation is a YTD calculation.
Both Corporate and Public plans had average asset allocations that produced positive results during the first quarter. However, differences in the accounting rules between GASB and FASB led to Corporate plans showing a negative return when comparing assets versus liabilities.
Ryan ALM Pension Monitor 4Q’22
4Q 2022 Ryan ALM Pension Monitor (Through December 31, 2022) Pension plan liabilities need to be measured and monitored regularly. Without knowledge of plan liabilities, the allocation of plan assets...
Source: Ryan ALM Pension Monitor 4Q’22
(Through December 31, 2022)
Pension plan liabilities need to be measured and monitored regularly. Without knowledge of plan liabilities, the allocation of plan assets cannot be done efficiently or appropriately. The funded ratio/status of pension plans are present value calculations. Each type of plan is governed by accounting rules and actuarial practices, which determine the discount rate used to calculate the present value of liabilities. Single employer corporate plans are under ASC 715 (FASB) discount rates (AA corporate zero-coupon yield curve); multiemployer plans and public plans use the ROA (return on asset assumption) as the liability discount rate. The difference in liability growth between these plans can be quite significant (see 2022), which will affect funded status and contribution levels.
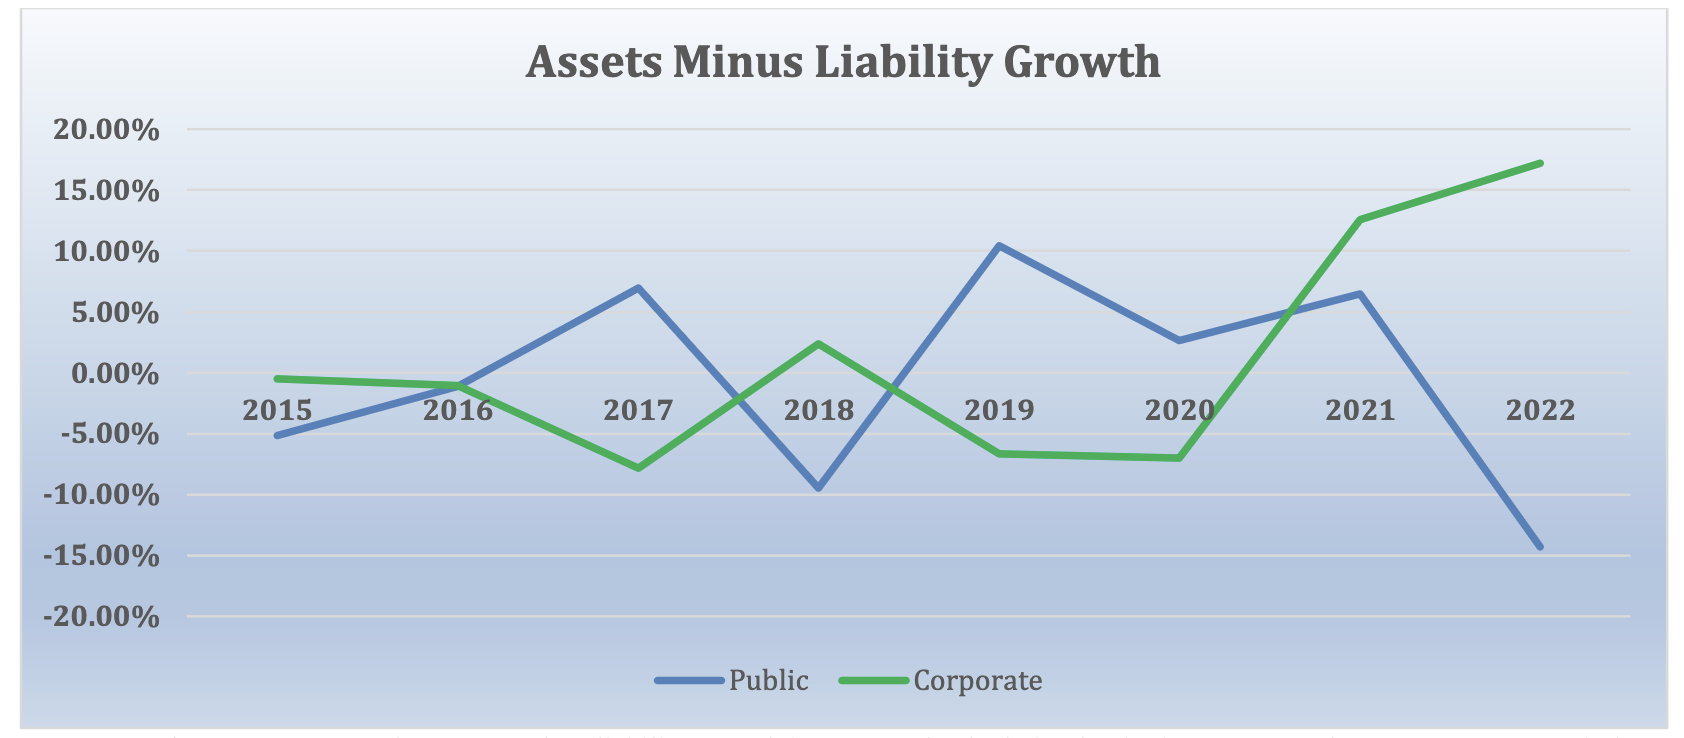
The table below compares these different liability growth rates (based on a 12-year average duration) versus the asset growth rate based on the P&I asset allocation survey of the top 1,000 plans which is updated each year. The graph below shows the contrasting annual differences of asset versus liability growth for corporate and public plans since 2015. The impact of different accounting rules is massive, and none greater than this year.
| ASSET ALLOCATION | YTD Return | Corporate | Public | Union |
|---|---|---|---|---|
|
Domestic Stock International Stock Global Equity Domestic Fixed Income Global Fixed Income Cash Private Equity Real Estate Equity* Other |
-18.1% -14.0% -18.0% -13.0% -18.3% 1.1% 12.0% 10.8% 10.3% |
11.1% 6.5% 10.4% 46.7% 1.3% 2.0% 8.5% 4.1% 9.4% |
24.4% 16.3% 5.3% 20.2% 1.7% 2.0% 12.7% 7.9% 9.5% |
24.7% 8.6% 11.4% 28.0% 0.9% 0.6% 8.2% 9.3% 8.3% |
| TOTAL ASSETS Growth Rate | -8.7% | -7.2% | -8.7% | |
| LIABILITIES Growth Rate | -26.6% | 7.0% | 7.3% | |
| Asset Growth – Liability Growth | 17.9% | -14.2% | -16.0% |
Index Benchmarks: Domestic Stock = S&P 500; Int’l Stock = EAFE, Global Equity = All Country World; Domestic Fixed Income = BB Aggregate; Global Fixed Income = FTSE World Gov’t (unhedged); Cash = Ryan ALM Cash Index; Private Equity =10-year return for the R2500 + 2%; *Real estate Equity =NFI-DP Index (delayed one month); Alternative Investments and Other = CPI-U & 3%.
Footnote: The measurement of asset growth to liability growth is an annual calculation beginning on December 31, 2015. For periods shorter than 1-year, the observation is a YTD calculation.
The question that must be asked: If two pension systems (one public and the other private) have similar asset allocations and are investing in the same markets, how is it possible that they have such meaningful differences in outcomes? These differences, caused by different reporting requirements, may distort contributions and funded status, and may influence benefit decisions unnecessarily.
Ryan ALM Pension Monitor 3Q’22
3Q 2022 Ryan ALM Pension Monitor (Through September 30, 2022) Pension plan liabilities need to be measured and monitored regularly. Without knowledge of plan liabilities, the allocation of plan assets...
Source: Ryan ALM Pension Monitor 3Q’22
(Through September 30, 2022)
Pension plan liabilities need to be measured and monitored regularly. Without knowledge of plan liabilities, the allocation of plan assets cannot be done efficiently or appropriately.
The funded ratio/status of pension plans are present value calculations. Each type of plan is governed by accounting rules and actuarial practices, which determine the discount rate used to calculate the present value of liabilities. Single employer corporate plans are under ASC 715 (FASB) discount rates (AA corporate zero-coupon yield curve); multiemployer plans and public plans use the ROA (return on asset assumption) as the liability discount rate. The difference in liability growth between these plans can be quite significant, which will affect funded status and contribution levels. The table below compares these different liability growth rates (based on a 12-year average duration) versus the asset growth rate using the P&I asset allocation survey of the top 1,000 plans which is updated each year. The graph below shows the contrasting annual differences of asset versus liability growth for corporate and public plans since 2015. The impact of different accounting rules is massive, especially during 2022’s rising rate environment.
| ASSET ALLOCATION | YTD Return | Corporate | Public | Union |
|---|---|---|---|---|
|
Domestic Stock International Stock Global Equity Domestic Fixed Income Global Fixed Income Cash Private Equity Real Estate Equity* Other |
-23.9% -27.1% -25.3% -14.6% -21.3% 0.2% 11.6% 8.6% 9.1% |
11.1% 6.5% 10.4% 46.7% 1.3% 2.0% 8.5% 4.1% 9.4% |
24.4% 16.3% 5.3% 20.2% 1.7% 2.0% 12.7% 7.9% 9.5% |
24.7% 8.6% 11.4% 28.0% 0.9% 0.6% 8.2% 9.3% 8.3% |
| TOTAL ASSETS Growth Rate | -12.0% | -11.9% | -12.9% | |
| LIABILITIES Growth Rate* | -25.9% | 5.6% | 5.6% | |
| Asset Growth – Liability Growth | 13.9% | -17.5% | -18.5% |
Index Benchmarks: Domestic Stock = S&P 500; Int’l Stock = EAFE, Global Equity = All Country World; Domestic Fixed Income = BB Aggregate; Global Fixed Income = FTSE World Gov’t (unhedged); Cash = 3 mo. T-Bill; Private Equity =10-year return for the R2500 + 2%; *Real estate Equity =NFI-DP Index (delayed one month); Alternative Investments and Other = CPI-U & 3%.
*Liabilities = Ryan ALM Custom Liability Indexes (CLI)
Footnote: The measurement of asset growth to liability growth is an annual calculation beginning on December 31, 2015. For periods shorter than 1-year, the observation is a YTD calculation.
Ryan ALM Pension Monitor 2Q
Ryan ALM Pension Monitor (Through June 30, 2021) Pension plan liabilities need to be measured and monitored regularly. Without knowledge of plan liabilities, the allocation of plan assets cannot be...
Source: Ryan ALM Pension Monitor 2Q
Ryan ALM Pension Monitor
(Through June 30, 2021)
Pension plan liabilities need to be measured and monitored regularly. Without knowledge of plan liabilities, the allocation of plan assets cannot be done appropriately.
The funded ratio/status of pension plans are present value calculations. Each type of plan is governed by accounting rules and actuarial practices, which determine the discount rate used to calculate the present value of liabilities. Single employer corporate plans are under ASC 715 (FASB) discount rates (AA corporate zero-coupon yield curve); multiemployer plans and public plans use the ROA (return on asset assumption) as the liability discount rate. The difference in liability growth between these plans can be quite significant, which will affect funded status and contribution levels.
The table below compares these different liability growth rates (based on 12-year average duration) versus the asset growth rate based on the P&I asset allocation survey of the top 1,000 plans. The graph below shows the contrasting annual differences of asset versus liability growth for corporate and public plans since 2015.
| ASSET ALLOCATION | YTD Return | Corporate | Public | Union |
|---|---|---|---|---|
|
Domestic Stock International Stock Global Equity Domestic Fixed Income Global Fixed Income Cash Private Equity Real Estate Equity* Other |
-20.0% -19.2% -20.5% -10.4% -14.8% -0.1% 6.2% 6.9% 6.2% |
11.1% 6.5% 10.4% 46.7% 1.3% 2.0% 8.5% 4.1% 9.4% |
24.4% 16.3% 5.3% 20.2% 1.7% 2.0% 12.7% 7.9% 9.5% |
24.7% 8.6% 11.4% 28.0% 0.9% 0.6% 8.2% 9.3% 8.3% |
| TOTAL ASSETS Growth Rate | -9.2% | -9.5% | -10.3% | |
| LIABILITIES Growth Rate | -18.3% | 3.7% | 3.7% | |
| Asset Growth – Liability Growth | 9.1% | -13.2% | -14.0% |
Index Benchmarks: Domestic Stock = S&P 500; Int’l Stock = EAFE, Global Equity = All Country World; Domestic Fixed Income = BB Aggregate; Global Fixed Income = FTSE World Gov’t (unhedged); Cash = 3 mo. T-Bill; Private Equity =10-year return for the R2500 + 2%; Real estate Equity =NCREIF Index; Alternative Investments and Other = CPI & 3%.
Liabilities: ASC 715 discount rate, produced by Ryan ALM, is 2.35% and GASB ROA is 7.0% annually
Footnote: The measurement of asset growth to liability growth is an annual calculation beginning on December 31, 2015. For periods shorter than 1-year, the observation is a YTD calculation.
Ryan ALM Pension Monitor Q1 ‘22
Ryan ALM Pension Monitor (Through March 31, 2022) Pension plan liabilities need to be measured and monitored regularly. Without knowledge of plan liabilities, the allocation of plan assets cannot be...
Source: Ryan ALM Pension Monitor 1Q
(Through March 31, 2022)
Pension plan liabilities need to be measured and monitored regularly. Without knowledge of plan liabilities, the allocation of plan assets cannot be done efficiently or appropriately.
The funded ratio/status of pension plans are present value calculations. Each type of plan is governed by accounting rules and actuarial practices, which determine the discount rate used to calculate the present value of liabilities. Single employer corporate plans are under ASC 715 (FASB) discount rates (AA corporate zero-coupon yield curve); multiemployer plans and public plans use the ROA (return on asset assumption) as the liability discount rate. The difference in liability growth between these plans can be quite significant, which will affect funded status and contribution levels.
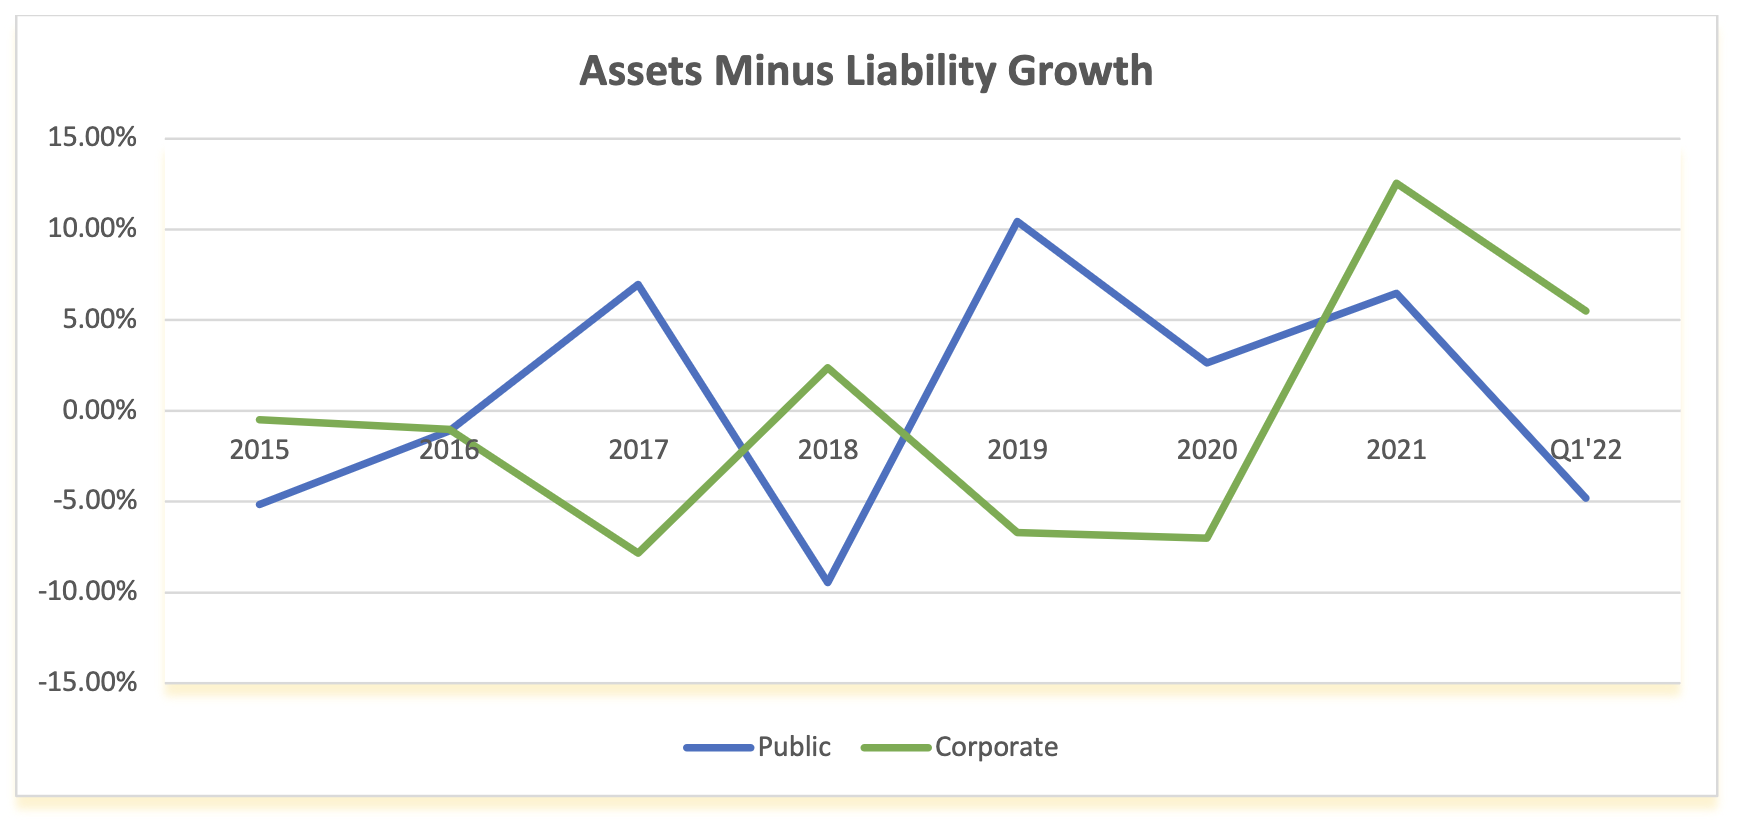
The table below compares these different liability growth rates (based on a 12-year average duration) versus the asset growth rate based on the P&I asset allocation survey of the top 1,000 plans which is updated each year. The graph below shows the contrasting annual differences of asset versus liability growth for corporate and public plans since 2015. The impact of different accounting rules is massive.
| ASSET ALLOCATION | Q1’22 Return | Corporate | Public | Union |
|---|---|---|---|---|
|
Domestic Stock International Stock Global Equity Domestic Fixed Income Global Fixed Income Cash Private Equity Real Estate Equity* Other |
-4.6% -5.8% -5.2% -5.9% -6.5% -0.1% 3.5% -1.3% 3.5% |
11.1% 6.5% 10.4% 46.7% 1.3% 2.0% 8.5% 4.1% 9.4% |
24.4% 16.3% 5.3% 20.2% 1.7% 2.0% 12.7% 7.9% 9.5% |
24.7% 8.6% 11.4% 28.0% 0.9% 0.6% 8.2% 9.3% 8.3% |
| TOTAL ASSETS Growth Rate | -3.7% | -3.0% | -3.5% | |
| LIABILITIES Growth Rate | -9.2% | 1.8% | 1.8% | |
| Asset Growth – Liability Growth | 5.5% | -4.8% | -5.3% |
Index Benchmarks: Domestic Stock = S&P 500; Int’l Stock = EAFE, Global Equity = All Country World; Domestic Fixed Income = BB Aggregate; Global Fixed Income = FTSE World Gov’t (unhedged); Cash = 3 mo. T-Bill; Private Equity =10-year return for the R2500 + 2%; *Real estate Equity =NFI-DP Index (delayed one month); Alternative Investments and Other = CPI-U & 3%.
Footnote: The measurement of asset growth to liability growth is an annual calculation beginning on December 31, 2015. For periods shorter than 1-year, the observation is a YTD calculation.
Ryan ALM Pension Monitor 4Q ‘21
Ryan ALM Pension Monitor (Through December 31, 2021) Pension plan liabilities need to be measured and monitored regularly. Without knowledge of plan liabilities, the allocation of plan assets cannot be...
Source: Ryan ALM Pension Monitor 4Q
(Through December 31, 2021)
Pension plan liabilities need to be measured and monitored regularly. Without knowledge of plan liabilities, the allocation of plan assets cannot be done appropriately.
The funded ratio/status of pension plans are present value calculations. Each type of plan is governed by accounting rules and actuarial practices, which determine the discount rate used to calculate the present value of liabilities. Single employer corporate plans are under ASC 715 (FASB) discount rates (AA corporate zero-coupon yield curve); multiemployer plans and public plans use the ROA (return on asset assumption) as the liability discount rate. The difference in liability growth between these plans can be quite significant, which will affect funded status and contribution levels.
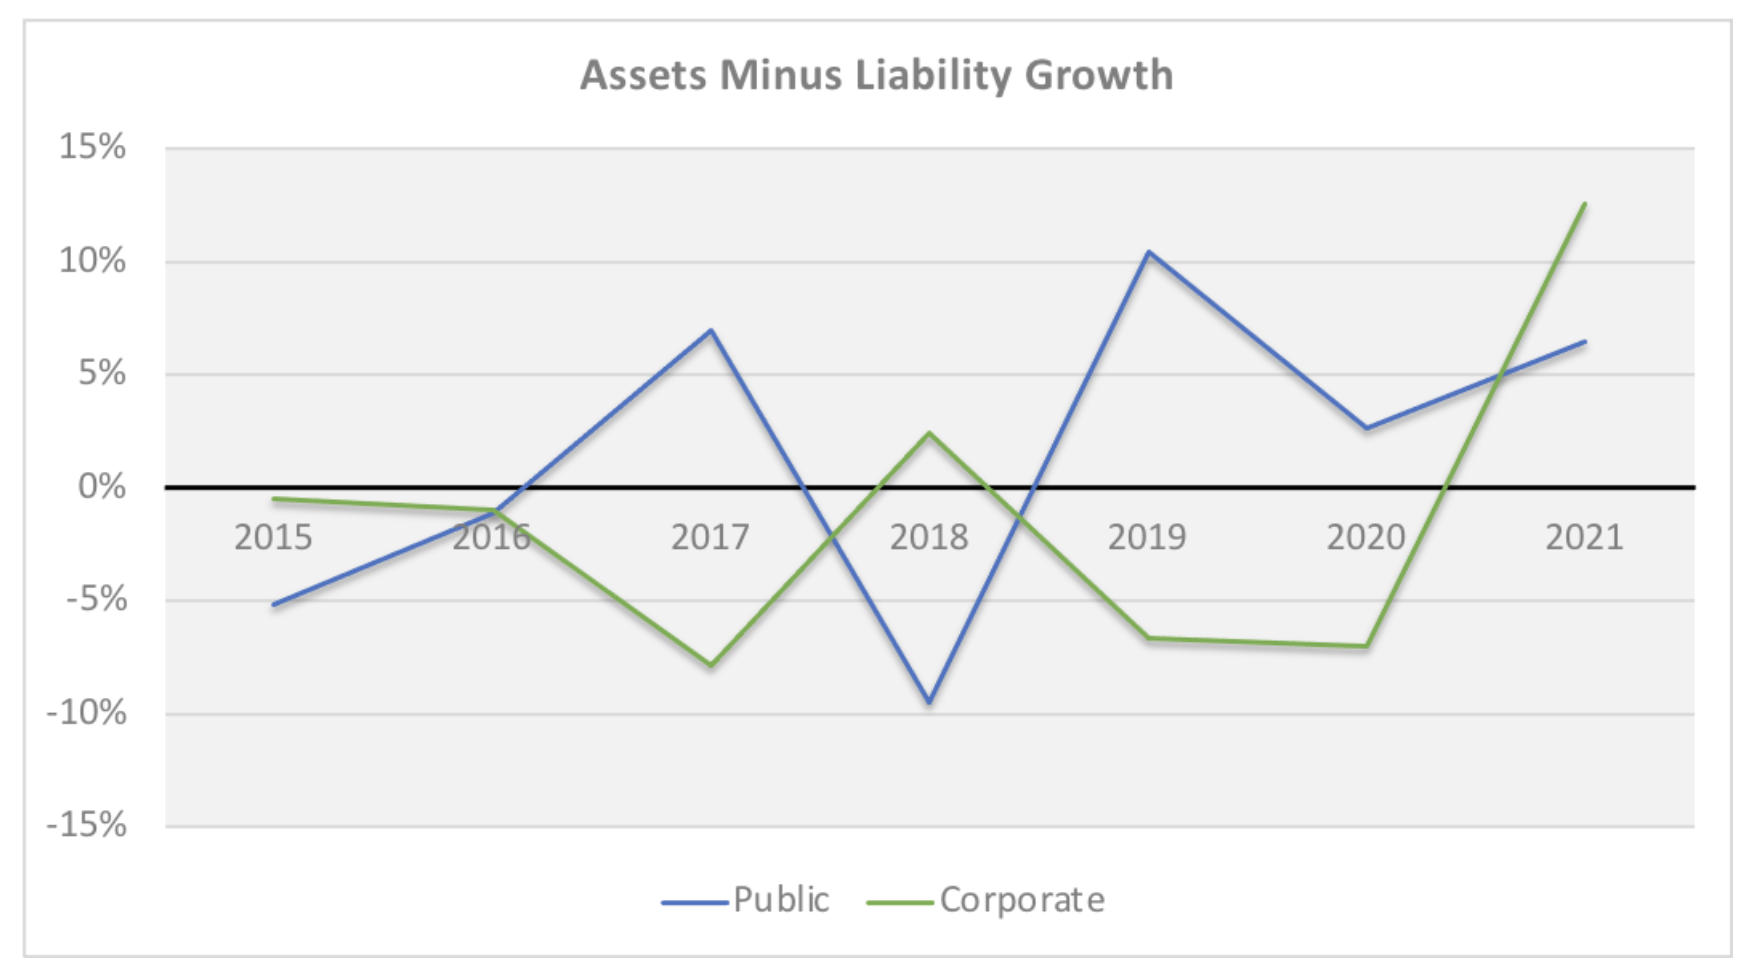
The table below compares these different liability growth rates (based on a 12-year average duration) versus the asset growth rate based on the P&I asset allocation survey of the top 1,000 plans which is updated each year. The graph below shows the contrasting annual differences of asset versus liability growth for corporate and public plans since 2015. The impact of different accounting rules is massive.
| ASSET ALLOCATION | 2021 Return | Corporate | Public | Union |
|---|---|---|---|---|
|
Domestic Stock International Stock Global Equity Domestic Fixed Income Global Fixed Income Cash Private Equity Real Estate Equity Alternative Investments Other |
28.7% 11.9% 16.8% -1.5% -7.0% 0.1% 14.4% 22.0% 10.0% 10.0% |
10.6% 7.1% 13.3% 48.3% 0.7% 2.4% 6.2% 4.5% 4.6% 2.5% |
24.6% 16.9% 6.2% 21.0% 2.3% 2.0% 10.3% 8.7% 7.6% 1.4% |
24.7% 8.6% 11.4% 28.0% 0.9% 0.6% 8.2% 9.3% 8.3% 0.0% |
| TOTAL ASSETS Growth Rate | 7.9% | 13.8% | 13.6% | |
| LIABILITIES Growth Rate | -4.6% | 7.3% | 7.3% | |
| Asset Growth – Liability Growth | 12.5% | 6.5% | 6.3% |
Index Benchmarks: Domestic Stock = S&P 500; Int’l Stock = EAFE, Global Equity = All Country World; Domestic Fixed Income = BB Aggregate; Global Fixed Income = FTSE World Gov’t (unhedged); Cash = 3 mo. T-Bill; Private Equity =10-year return for the R2500 + 2%; Real estate Equity =NFI-DP Index; Alternative Investments and Other = CPI-U & 3%.
Footnote: The measurement of asset growth to liability growth is an annual calculation beginning on December 31, 2015. For periods shorter than 1-year, the observation is a YTD calculation.