Ryan ALM Pension Monitor 4Q ‘21
Source: Ryan ALM Pension Monitor 4Q
(Through December 31, 2021)
Pension plan liabilities need to be measured and monitored regularly. Without knowledge of plan liabilities, the allocation of plan assets cannot be done appropriately.
The funded ratio/status of pension plans are present value calculations. Each type of plan is governed by accounting rules and actuarial practices, which determine the discount rate used to calculate the present value of liabilities. Single employer corporate plans are under ASC 715 (FASB) discount rates (AA corporate zero-coupon yield curve); multiemployer plans and public plans use the ROA (return on asset assumption) as the liability discount rate. The difference in liability growth between these plans can be quite significant, which will affect funded status and contribution levels.
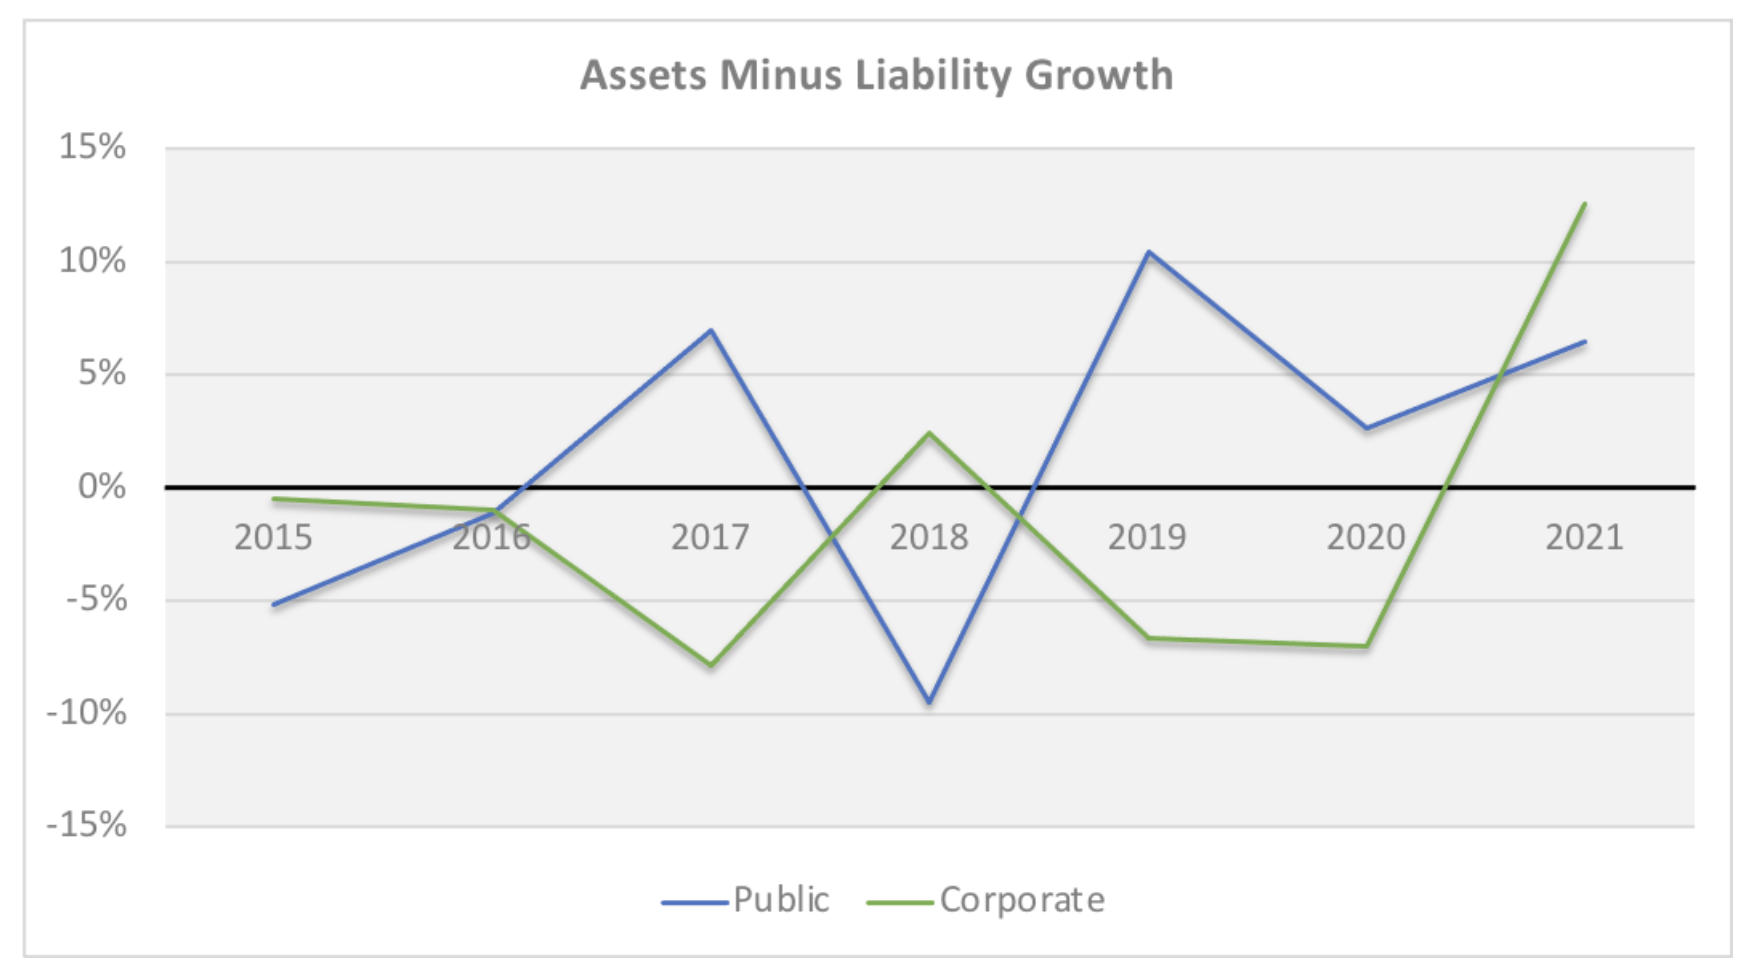
The table below compares these different liability growth rates (based on a 12-year average duration) versus the asset growth rate based on the P&I asset allocation survey of the top 1,000 plans which is updated each year. The graph below shows the contrasting annual differences of asset versus liability growth for corporate and public plans since 2015. The impact of different accounting rules is massive.
| ASSET ALLOCATION | 2021 Return | Corporate | Public | Union |
|---|---|---|---|---|
|
Domestic Stock International Stock Global Equity Domestic Fixed Income Global Fixed Income Cash Private Equity Real Estate Equity Alternative Investments Other |
28.7% 11.9% 16.8% -1.5% -7.0% 0.1% 14.4% 22.0% 10.0% 10.0% |
10.6% 7.1% 13.3% 48.3% 0.7% 2.4% 6.2% 4.5% 4.6% 2.5% |
24.6% 16.9% 6.2% 21.0% 2.3% 2.0% 10.3% 8.7% 7.6% 1.4% |
24.7% 8.6% 11.4% 28.0% 0.9% 0.6% 8.2% 9.3% 8.3% 0.0% |
| TOTAL ASSETS Growth Rate | 7.9% | 13.8% | 13.6% | |
| LIABILITIES Growth Rate | -4.6% | 7.3% | 7.3% | |
| Asset Growth – Liability Growth | 12.5% | 6.5% | 6.3% |
Index Benchmarks: Domestic Stock = S&P 500; Int’l Stock = EAFE, Global Equity = All Country World; Domestic Fixed Income = BB Aggregate; Global Fixed Income = FTSE World Gov’t (unhedged); Cash = 3 mo. T-Bill; Private Equity =10-year return for the R2500 + 2%; Real estate Equity =NFI-DP Index; Alternative Investments and Other = CPI-U & 3%.
Footnote: The measurement of asset growth to liability growth is an annual calculation beginning on December 31, 2015. For periods shorter than 1-year, the observation is a YTD calculation.