
Ryan ALM
White Papers
Browse
What’s It All About? Liabilities!
Most institutional assets are required to fund some type of liability objective (Pensions, OPEB, Lottery, Endowment & Foundation) yet liabilities tend to be missing in every function related to assets:...
Source: What’s It All About? Liabilities!
Most institutional assets are required to fund some type of liability objective (Pensions, OPEB, Lottery, Endowment & Foundation) yet liabilities tend to be missing in every function related to assets:
Asset Allocation – is focused on achieving an absolute rate of return (ROA) which has nothing to do with a liability objective. The proof: how could a 60% and a 90% funded pension plan have the same or similar ROA? Wouldn’t the 60% funded plan have to work harder? This common focus is really assets versus assets (as measured by some index benchmarks) and not assets versus liabilities.
Asset Management – most asset classes are given some generic index benchmark as their return focus. Obviously no generic index could ever represent the unique liability cash flows of each client.
Performance Measurement – once again we have assets versus assets (generic index benchmarks). If an asset class outperforms its generic index benchmark does that mean assets have outgrown liability growth? Of course not! This is again a complete disconnect which plaques most institutional comparisons.
Solutions:
Ryan ALM has developed a turnkey system of products that are a best fit to achieving the true liability objective of institutions:
Custom Liability Index (CLI) – In 1991, the Ryan team developed the CLI as the proper benchmark for any liability objective. The CLI is a monthly report that calculates what liability cash flows assets must fund. For pensions, this is usually the net monthly liability cash flows (after contributions). The CLI is in harmony with clients’ actuarial projections since that is the data used to construct the CLI.
Liability Beta Portfolio™ (LBP) – The LBP is our proprietary cash flow matching (CFM) model which will fully fund monthly net liability cash flows at a low cost to our clients. Usually, the LBP will reduce funding costs by roughly 2% per year (20% for 1-10 years). Our LBP is a good fit as the liquidity assets so there is no need for a cash sweep that takes income from all asset classes to fund benefits + expenses (B+E). Since the LBP is focused on liability cash flows (future values or FV) it mitigates interest rate risk as well because FVs are not interest rate sensitive.
Performance Attribution Report (PAR) – Our proprietary PAR product provides 14 risk/reward calculations of the LBP versus the CLI, providing even more evidence of value added (in addition to cost savings + mitigation of interest rate risk) since our LBP should outyield and outgrow the CLI.
Asset Exhaustion Test (AET) – Our AET will calculate the true ROA needed to fully fund net liability cash flows. Quite often this calculated ROA is much lower than the current ROA used for asset allocation. Developing an AET should be a first step in the asset allocation process in determining the allocation to the liquidity bucket (LBP assets).
Observations:
The intrinsic value in bonds is the certainty of their cash flows. Bonds are the only asset class with certainty of their cash flows. That is why bonds have been the logical choice for Dedication and Defeasance using Cash Flow Matching (CFM) strategies since the 1970s. Only CFM is a best fit for any liability driven objective. The primary objective of a pension is to secure benefitsin a cost-efficient manner. Our CFM product (LBP) will secure and fully fund benefits by matching asset cash flows monthly versus liability cash flows. This matching process is done chronologically for as far out as the plan sponsor deems necessary.
Furthermore, it would be wise to separate liquidity assets (liability Beta assets) from growth assets (liability Alpha assets). The Beta assets should be the bond allocation to cash flow match the net liability cash flows (after contributions) chronologically for a target horizon. This will buy time for the risky assets (Alpha) to grow unencumbered since you have certainty of the Beta assets’ cash flows for as long a period as you want. A study of S&P data by Guinness Global highlights that dividends and dividends reinvested account for about 47% of the S&P 500 total return on rolling 10-year periods dating back to 1940 and 57% for 20-year horizons. So why would you want to dilute equity returns with a cash sweep? Since we are dealing with net liabilities (after contributions) a 15% LBP allocation may fund liabilities out to 10-years or more, especially given the higher U.S. interest rate environment.
Observations and Benefits of LBP:
No change in Cash and Bond allocation
No dilution of Alpha assets to fund B + E
Reduces funding costs by about 2% per year
Mitigates interest rate risk (funding future values)
Secures + fully funds monthly B+E chronologically
Eliminates the need for a cash sweep which dilutes equity returns
LBP will out yield current bond managers and enhance the ROA
Cash flow matching buys time for Alpha assets to grow unencumbered
Generic bond indexes cash flows look nothing like the projected benefit payment schedule
This leads to a mismatch of cash flows and risk/reward behaviors… serious issues over time
Alpha assets need time to perform without any dilution of their cash flows to pay benefits so they shouldn’t be a source of liquidity. Use CFM as the liquidity assets.
Logic:
Let the performance assets (Alpha assets) perform by growing unencumbered as the liquidity assets (Beta assets) provide cash flows sufficient to fully fund benefits plus expenses chronologically.
Problem/Solution: Asset-only Focus
Most, if not all asset allocation models are focused on achieving a total return target or hurdle rate… commonly called the ROA (return on assets). This ROA target return is derived from a weighting of…
Source: Problem/Solution: Asset-only Focus
Problem: Asset Only Focus on Asset Allocation
Solution: Asset Liability Management (ALM)
Most, if not all asset allocation models are focused on achieving a total return target or hurdle rate… commonly called the ROA (return on assets). This ROA target return is derived from a weighting of all asset classes forecasted index benchmark returns except for bonds which uses the yield of the index benchmark. These forecasts are based on some historical average (i.e. last 20 years or longer). As a result, it is common that most pensions have the same or similar ROA.
This ROA exercise ignores the funded status. It is certainly obvious that a 60% funded plan should have a much higher ROA than a 90% plan. But the balancing item is contributions. If the 60% funded plan would pay more in contributions than the 90% plan (% wise) then it can have a lower ROA. I guess the question is what comes first. And the answer is the ROA with contributions as a byproduct of the ROA. The actuarial math is whatever the assets don’t fund… contributions will fund.
If the true objective of a pension is to secure and fully fund benefits and expenses (B+E) in a cost-efficient manner with prudent risk, then you would think that liabilities (benefits + expenses) would be the focus of asset allocation. NO, liabilities are usually missing in the asset allocation process. Pensions are supposed to be an asset/liability management (ALM) process not a total return process. Ryan ALM recommends the following asset allocation process:
Calculate the cost to fully fund (defease) the B+E of retired lives for the next 10 years chronologically using a cash flow matching (CFM) process with investment grade bonds. CFM will secure and fully fund B+E of retired lives for the next 10 years. Then calculate the ROA needed to fully fund the residual B+E with the current level of contributions. This is calculated through an asset exhaustion test (AET) which is a GASB requirement as a test of solvency. The difference is GASB requires it on the current estimated ROA before you do this ALM process. Ryan ALM can create this calculated ROA through our AET model. If the calculated ROA is too high then either you reduce the allocation to the CFM or increase contributions or a little bit of both. If the calculated ROA is low, then increasing the allocation to CFM is appropriate. Running AET iterations can produce the desired or most comfortable asset allocation answer.
Cash flow matching (CFM) will provide the liquidity and certainty needed to fully fund B+E in a cost-efficient manner with prudent risk. The Ryan ALM model (Liability Beta Portfolio™ or LBP) will reduce funding costs by about 2% per year or 20% for 1-10 years of liabilities. We will use corporate bonds skewed to A/BBB+ issues. There has never been a bond default in the 20-year history of Ryan ALM.
Assets are a team of liquidity (bonds) and growth assets to beat the liability opponent. They should work together in asset allocation to achieve the true pension objective.
Pension Conundrum - Liquidity Risk
Liquidity is a critical and necessary priority of a pension fund, since it must fund monthly benefits and expenses (B + E) on time. Many plan sponsors use a “cash...
Source: Pension Conundrum - Liquidity Risk
Liquidity is a critical and necessary priority of a pension fund, since it must fund monthly benefits and expenses (B + E) on time. Many plan sponsors use a “cash sweep” or a fixed cash allocation to provide such cash flow. Both strategies are not optimal for a pension plan.
Cash Sweep
A cash sweep usually takes income or cash flow from all asset classes to fund the current monthly B+E. This can severely damage the ROA of such asset classes. According to a research report by Guinness Global found since 1940, dividends and dividends reinvested have accounted for 47% of the S&P 500 total return on a 10-year rolling period and 57% on a 20-year rolling period. So, this data questions the logic of a cash sweep that uses dividends to fund B+E.
As a solution, Ryan ALM recommends that you use a cash flow matching (CFM) strategy to fully fund B+E. Our CFM model will provide timely cash flows that will fully fund B+E at the lowest cost to our clients. The benefits of CFM are quite substantial:
Allows growth (non-liquidity) assets to grow unencumbered. Should enhance their ROA significantly.
CFM buys time. The longer the time, the greater the probability of achieving the ROA for the growth assets.
CFM will provide certainty (barring a default) of cash flows which reduces or eliminates liquidity risk.
CFM is an investment grade portfolio skewed to the longest maturities within the area it is funding (i.e. 1-3 years or 1-5 years) that should enhance the CFM yield versus the yield on cash reserves.
CFM reduces reinvestment risk if interest rates trend downward (as many expect).
Asset Allocation (AA)
Most AA have a cash allocation somewhere between 2% to 5%. Why? Normally you hear it is for liquidity purposes or even diversification. Cash is usually the lowest yielding asset especially when there is a positive sloping yield curve. Due to its very short maturities, cash is usually costing the plan close to a 1:1 cost ratio of present value to future value. The present value of a 3-month T-Bill will be quite close to its future value or a 1:1 ratio. While a CFM portfolio with a 3-year average maturity yielding 4.00% would have a 0.88:1 ratio for a cost reduction = 12%.
As a solution, Ryan ALM recommends separating liquidity assets from growth assets in asset allocation. Let bonds in a CFM strategy be your liquidity assets for the advantages mentioned above. A CFM strategy will have a longer average duration than cash thereby reducing the cost ratio. In this way the liquidity assets and the growth assets are a team that will produce the optimal solutions:
Enhance ROA by eliminating a cash sweep so growth assets grow unencumbered.
Reduce or eliminate liquidity risk by fully funding B+E monthly with certainty.
Enhance the ROA by outyielding cash
Reduce funding costs
Optimizing Asset Allocation
The asset allocation decision is the single most important asset decision since it affects all assets and the funded status of a pension plan. Strategic asset allocation (AA) takes a...
Source: Optimizing Asset Allocation
The asset allocation decision is the single most important asset decision since it affects all assets and the funded status of a pension plan. Strategic asset allocation (AA) takes a long-term view and establishes weights for each asset class in order to achieve the highest probability of earning the target return on assets (ROA). These weights tend to be static and not responsive to the funded status. Tactical AA is a short-term view that changes the strategic weights due to a market opportunity it is trying to capture. Responsive AA is when AA responds to the ever-changing funded ratio and funded status. Since the true objective of a pension is to secure benefits (liabilities) in a cost-efficient manner with reduced risk over time… responsive AA is the more appropriate methodology.
It should be obvious that a 60% and a 90% funded plan should have two very different asset allocations. But if they have the same or similar ROA they will have the same or similar strategic or tactical asset allocations. Focusing on the ROA has misled most plan sponsors down a return objective path instead of a liability objective direction. This ROA focused road has been a roller coaster of volatile funded ratios and spiking contribution costs.
Responsive AA requires accurate and current knowledge of the true economic funded status (assets MV / liabilities MV and assets MV – liabilities MV). This is difficult due to annual accounting and actuarial reports that are usually months delinquent and don’t calculate the economic market value of liabilities (i.e., GASB accounting). Assets need to know what they are funding (benefits + expenses). Assets need to outgrow liabilities to enhance the funded status, so assets need to know the market value and growth rate of liabilities. Assets need a scoreboard of asset growth vs. liability growth that is updated frequently to help them play the pension game.
Custom Liability Index (CLI)
The solution to the accounting and actuarial delinquent information is a Custom Liability Index (CLI). In 1991, Ron Ryan and his team invented the first CLI as the best representation of the true client objective. Although funding liabilities is the true objective, liabilities tend to be missing in action in asset allocation, asset management, and performance measurement. The reason for this disconnect is the absence of a Custom Liability Index (CLI) that monitors the present value, term structure, and risk/reward behavior of liabilities. Once a CLI is installed as the proper benchmark, then and only then can the asset side function effectively on asset allocation, asset management, and performance measurement.
Liabilities are like snowflakes… you will never find two alike. Pension liabilities are unique to each plan sponsor. As a result, only a Custom Liability Index could ever properly represent or measure these unique liabilities of any plan sponsor. A CLI should be calculated accurately and frequently so the plan sponsor and its consultant can be informed with timely data that can support the asset allocation decision. Assets need to know what they are funding. The economic truth is… assets fund the net liabilitiesafter contributions. Our CLI will provide both a gross and net liability valuation based on market rates (ASC 715 and Treasury STRIPS) as well as the discount rates that apply (ROA, ROA bifurcated with 20-year munis, PPA spot rates, and PPA 3-segment). The CLI will provide a monthly or quarterly calculation of the current present value of liabilities so the funded ratio and funded status can be updated… and a monthly or quarterly calculation of the liability growth rate so performance measurement of total assets vs. total liabilities can be assessed.
Since current assets fund net liabilities after contributions, current assets need to know the projected benefits, expenses, and contributions for every year as far-out as the actuary calculates such projections. Noticeably, contributions are a missing asset in the calculation of the funded ratio / funded status and usually play no role in the asset allocation strategy of most plan sponsors. Given the size of contributions today, it is critical that contributions should be a major consideration in the asset allocation strategy.
Asset Exhaustion Test (AET)
We commend GASB accounting for requiring a test of solvency whereby the plan’s actuary must calculate and present proof that projected benefits + expenses (B+E) will be fully funded from both a return on asset (ROA) assumption + projected contributions. If the assets fail this test, then the GASB ROA discount rate is bifurcated at the time that assets are exhausted, and liabilities are then discounted at a 20-year AA muni rate going forward. Ryan ALM modifies the AET to calculate the ROA needed to fully fund (B+E) – C. This calculated ROA should help AA understand the minimum ROA or target return needed to fully fund net liabilities. Asset allocation needs to know the hurdle rate that has to be achieved to fully fund B+E with help from contributions. Our experience has been that this calculated ROAis always much different than the normal ROA used today. Usually, it is a much lower ROA rate for plans that pass this solvency test since contributions are a major contributor while it could be much higher for plans that fail this test. We highly recommend that all pensions apply this modified AET test of solvency to provide AA with the proper ROA target return rate.
Asset Allocation (AA)
As stated previously, Asset allocation is the single most important asset decision as it controls the risk/reward behavior of 100% of the assets. Since it will greatly affect the funded ratio and funded status, the success or failure of the asset allocation strategy is the single most important asset decision. Pension consultants are very diligent in their AA recommendation for each client to achieve the ROA hurdle rate. It is our recommendation that the asset allocation strategy should be based on the funded ratio (present value of assets/liabilities), funded status (present value of assets – liabilities) and the modified AET with a calculated ROA. Logically, a large deficit status should have a more aggressive asset allocation strategy than one with a surplus or fully funded status. Unfortunately, the funded ratio tends to play little or no role in many asset allocation strategies today. Most often the asset allocation focus is on achieving the return on asset (ROA) assumption… an absolute return target.
Since the true plan objective is to secure benefits in a cost-efficient manner with reduced risk over time, asset allocation needs to be in harmony with this objective. We recommend that asset allocation separate assets into liability Beta and liability Alpha assets. The liability Beta assets are to secure benefits by cash flow matching liabilities through a structured bond portfolio (defeasance). This should be the core portfolio of the pension plan since it best represents the true objective. The liability Alpha assets job is to outgrow liabilities in $s to enhance the funded status such that contribution costs are reduced over the life of the plan. In order for contributions to be reduced, pension assets must outgrow pension liabilities in $s. A simple example might explain this better:
| Begin | Growth Rate % | Growth Rate $ | End | |
|---|---|---|---|---|
| Assets | $700m | 7.50% | $52.5m | $752.5m |
| Liabilities | $1 billion | 6.00% | $60.0m | $1.06b |
| Funded Ratio | 70.0% | 71.0% | ||
| Funded Status | -$300m | -$307.5m |
In this example assets outgrew liabilities in % return (7.50% vs. 6.00%). But because the funded ratio/status was a big deficit of 30%, the asset $ growth was less than the liability $ growth ($52.5m vs. $60.0m). This created a larger deficit that requires a larger contribution. In order to maintain the funded status at -$300m would require asset growth of $60.0m or an 8.57% return.
Only with a CLI can the plan know the true economic funded status on a routine basis. With the synergy of liability Beta and Alpha assets, AA now has the proper structure to achieve the true objective. Based on the economic funded status AA can now determine the allocation between these two asset groups. With a modified AET, AA now knows the calculated ROA needed to fully fund net
liabilities. The plan return objective should be for assets to outgrow liabilities in $s… it is the relative $ returns that count not an absolute % return (ROA). Asset allocation models need to focus on enhancing the funded status by creating liability Alpha in $s… not an absolute % return target (ROA).
Asset allocation needs to be responsive to this ever-changing net funded ratio/status. Strategic and Tactical asset allocation do not respond to the funded status. A responsive asset allocation responds to the funded status through a process called Portable Alpha. If the liability Alpha assets exceed liability growth in $s (as measured by the CLI), a prudent discipline is to transfer (port) this excess $ return over to the liability Beta assets. This will secure more benefits and reduce more volatility on the funded status. Just like the gambler in Las Vegas… take your winnings off the table to reduce your risk of losing! Asset allocation needs to recognize and respond to the funded status. A Portable Alpha strategy does this as a procedure or discipline thereby protecting the plan, so it doesn’t become too risky or chase the wrong ROA objective.
Performance Measurement
In harmony with the true pension objective, assets need to be measured vs. the risk/reward behavior of the CLI. This should be the acid test of asset allocation. Total asset growth must outperform total liability growth in $s for the funded ratio and funded status to be enhanced. Without a CLI, such a measurement would be difficult and certainly not timely. Total asset growth should be measured and monitored vs. total liability growth routinely (quarterly) for every investment review meeting. However, liability growth and the current funded status are usually MIA. The CLI will correct this error of omission. A simple warning is applicable here: If you outperform the S&P 500 and any generic market index benchmark but lose to liability growth… the plan sponsor loses!
Obviously, there is no victory or liability Alpha earned if asset growth underperforms liability growth although traditional performance measurements vs. generic market indexes could suggest otherwise. All liability Beta and liability Alpha assets need to be in sync with the true objective of enhancing the funded ratio, the funded status, and reducing contribution costs.
Conclusion
Traditional asset allocation models are focused on achieving the ROA assumption. This is not the true or proper pension objective. Until a Custom Liability Index (CLI) is installed as the proper benchmark and an AET is performed, asset allocation will be disconnected from the true liability objective. Contributions should be a major consideration in the asset allocation process since they are a large future asset that enhances the funded status. Contributions are the first source to pay the current liabilities due each year, thereby reducing the liabilities current assets need to fund. This net liability needs to be calculated and monitored by the CLI on a frequent basis. Since full funding is the goal, asset allocation needs to know the annual hurdle rate or calculated ROA needed to reach this funding status. The modified AET will provide the calculated ROA needed to fully fund net liabilities (B+E) – (C). A Portable Alpha strategy will then rebalance the asset allocation accordingly by taking the excess returns over net liability growth as measured by the CLI (liability Alpha) and porting them over to the liability Beta assets. Performance measurement will then monitor total asset vs. total liability growth to verify that the pension plan is on the proper road to full funding.
Pension Confusion - Find the Liabilities
Securing and funding liabilities in a cost-efficient manner with prudent risk is the true pension objective. Although liabilities should be the focus of pensions, it is hard to find liabilities...
Source: Pension Confusion - Find the Liabilities
Securing and funding liabilities in a cost-efficient manner with prudent risk is the true pension objective. Although liabilities should be the focus of pensions, it is hard to find liabilities in asset allocation, asset management and performance measurement… especially forPublic and Multiemployer Plans,as theseplans are asset only focused. Private plans are very much liability driven although they have opted out of pensions to buy Insurance BuyOut annuities as a major trend for over ten years.Given the 500 bps increase in the Fed Funds rate in the last two years, Private plans need to revisit the economics of BuyOut annuities versus a defeasance strategy (cash flow matching). I think they may find that a defeasance strategy has definite cost advantages today.
So, what’s the matter? There is an obvious disconnect between assets and liabilities because liabilities are missing from every critical asset function:
Asset Allocation (AA)
Liabilities are like snowflakes, you never find two alikeas each pension plan has a different labor force, salaries, mortality and plan amendments. There can never be a generic market index to replicate any plan sponsor’s unique liability cash flows. Liabilities are the domain of the actuary. They produce a very thorough annual report detailing and itemizing numerous liability calculations. The actuaries do an amazing job given the huge number of calculations. They have a tedious and most important function as the calculator and custodian of the liabilities. This voluminous work is usually presented as an annual report a few months after the end of the fiscal year. More importantly, the actuary calculates the funded status which should be the focus of asset allocation, asset management, and performance measurement.
Most pension asset allocations are based on earning a target ROA or hurdle rate. The ROA is calculated by weighing the expected return for a series of asset classes. Each asset class has its own ROA based on its index benchmark estimated return. Pension consultants are quite diligent in analyzing each asset class and assigning the proper weight to achieve the target ROA and risk behavior. Thorough quarterly reports are presented by the consultants to plan sponsors detailing the risk/reward of every asset manager versus the index benchmark assigned to that asset class as the bogey. As a result, generic market indexes are the driver and focus of asset allocation.
AA should be responsive to the funded status of each client. A 90% funded plan should have a much more conservative AA than a 60% funded plan. But most, if not all, asset allocation models ignore the funded status and focus on achieving the target ROA with the highest probability of success and prudent risk based on historical returns of a database that is almost 100% generic market indexes. The historical risk/reward behavior of numerous generic market indexes are
inputs into an AA optimization model that provides a baseline allocation of each asset class. The pension consultant will then massage those weights to best fit each client. Too often plan sponsors have similar asset allocations no matter what their funded status is because they have similar ROA targets. This has led to inappropriate AA especially in the late 1990s and early 2000s that were heavily skewed to risky assets although the pension plans were greatly overfunded then. Had pensions defeased their liabilities then through a cash flow matching strategy with investment grade bonds, they could have secured their surplus victory and stabilized low contribution costs. Instead, the equity correction of 2000-02 wrecked the funded status of almost all pensions causing spiking contribution costs which have not subsided even today.
Without knowledge of the economic funded status on a frequent and accurate basis, AA cannot function effectively. If the market value of assets is the most accurate measurement of asset valuation then the same is true for liabilities. The Society of Actuaries (SoA) delivered a research paper “Principles Underlying Asset Liability Management (ALM)” years ago that warns of erroneous accounting valuations and recommends that pensions create a set of economic books:
“A consistent ALM structure can only be achieved for economic objectives. Accounting measures can sometimes distort economic reality and produce results inconsistent with economic value. Because ALM is concerned with the future asset and liability cash flows, the natural focus of ALM is economic value.”
Ryan ALM Translation: Pension plans need to create a set of “economic books” so ALM can function effectively. It’s all about asset cash flows funding liability cash flows. A Custom Liability Index (CLI) is the method and proper benchmark to create economic books.
With a CLI in place, consultants and plan sponsors can now know monthly the true economic funded status and liability growth rate. With a CLI, consultants now possess pertinent and private information for each of their clients that no other consultant would have…. a significant advantage over competition. The CLI allows consultants to now customize the AA to best fit the clients dynamic funded status with timely adjustments. Although the actuaries don’t produce a CLI, it is based on the private actuarial projections of benefits, administrative expenses and contributions. Ron Ryan and his team created the first CLI in 1991 as the true benchmark of a pension. The Ryan ALM CLI provides all of the calculations needed for efficient AA, ALM, and performance measurement.
Asset Liability Management (ALM)
It would be hard, if not impossible, for an asset manager to manage assets versus a generic market index if it came out annually, months after the end of the fiscal year with no transparency (index constituents not shown) and it wasn’t priced at the market. Well welcome to the pension world of liabilities. Liabilities are an annual actuarial calculation that has little or no transparency (projections usually not shown) and is priced at the ROA (GASB) as the discount rate. The ROA discount rate is certainly not a market rate you can buy to settle the liabilities. The ROA discount rate is one of the accounting distortions of economic reality the SoA referenced.
This was the message from the SoA. You need to create a set of economic books for ALM to function effectively. This is why a CLI is the critical step in ALM. Assets need to know what they are funding. The answer is usually net liabilities defined as (benefits + expenses) – (contributions) since contributions are the first source to fund the liability cash flows. Because net liabilities are not calculated in the actuarial report, the CLI should be a requirement to understand the net liability cash flows that asset cash flows must fund. Such net liability cash flows are also monthly which is another calculation made by the CLI.
If the true pension objective is to secure benefits in a cost-efficient manner with prudent risk, then cash flow matching (CFM) must be the proper and best ALM strategy. CFM used to be called dedication and has been a stable approach to pension investing for over 50 years. Bonds are the only asset class with the certainty of its cash flows. That is the intrinsic value in bonds and the reason why CFM should be the core portfolio of any pension. As the funded ratio improves, a higher allocation should be given to CFM to secure more and more benefits while stabilizing the funded ratio and contributions.
Performance Measurement
Once the CLI is in place, it will provide monthly calculations of the net liability growth rate (returns). Total asset growth (returns) versus the total net liability growth rate is the critical performance measurement. If all of the asset managers outperformed their generic market index benchmarks but total asset growth underperformed total net liability growth rate… the plan loses. This lost shows up in higher pension expense (contribution costs) and a lower funded status.
With a liability objective, the terms Alpha and Beta now take on a different perspective. Liability Alpha is the excess return of asset growth rate versus the liability growth rate. Liability Beta is now the portfolio that matches the liability cash flows it is funding. With the CLI, liability Beta is now a Liability Index Fund. Without a CLI, performance measurement is comparing assets versus assets… this is in sharp contrast to the pension objective of assets versus liabilities.
How To De-risk a Pension
Risk is best defined as the “uncertainty” of meeting the client objective. The pension objective is to fund liabilities in a cost-effective manner such that contribution costs remain low and...
Source: How To De-risk a Pension
Risk is best defined as the “uncertainty” of meeting the client objective. The pension objective is to fund liabilities in a cost-effective manner such that contribution costs remain low and stable. Pension plans also want to de-risk their plans over time. The lowest risk assets for a pension are those that match the liability benefit payment schedule with certainty. By definition, Treasury zero-coupon bonds (STRIPS) and annuities would be the lowest risk assets for pension since they have a known future value… but they tend to come at a high cost since they are low yielding (STRIPS) or have high fees (annuities). Given that the pension objective is to secure benefit payments in a cost-efficient manner, then solving for cost while matching and fully funding the liability payment schedule would be the ideal way to de-risk a pension.
A pension liability benefit payment schedule is a term structure or yield curve often referred to as the liability cash flow. In order to match or de-risk each pension liability payment requires a matching cash flow from assets. Only bonds (and annuities) produce a certain cash flow. That is why bonds have been used for decades as the best way to defease, immunize, and de-risk a pension plan.
Problems with Hedges
Duration-matching strategies (Immunization), Interest Rate Swaps, futures, derivatives, risk overlays, etc. are all hedging tools to help assets match the liability growth rate. They are NOT de-risking strategies since they do not match the liability cash flows. Duration matching has several difficult, if not erroneous, data gathering choices it uses:
Average duration of liabilities
Where do you get the average duration of liabilities? Most, if not all, actuarial reports do not provide this calculation. Moreover, they usually do not provide the projected liability benefit payment schedule which you would need to calculate duration. In addition, actuarial reports are, at a minimum, annual reports usually three to six months delinquent so there would be serious delayed information. The duration calculation is at a precise moment in time… like a balance sheet. As time and interest rates change… so will duration. Only A Custom Liability Index (CLI) based on each pension’s unique liability benefit payment schedule could provide an accurate and monthly duration profile.Discount Rates
Since the duration of liabilities changes with interest rates (discount rates) this calculation needs to be refreshed and updated on a frequent and accurate basis. According to pension accounting rules (FAS 158, GASB 67) and federal funding standards (PPA – MAP 21 and spot rates) there is an assortment of discount rates required to price liabilities. Which one is best? The FASB accounting language says it best… you are use a discount rate that settles the liability payments. This means discount rates you can buy to settle or defease the liability payment schedule. ASC 715 comes the closest by using an AA corporate bond yield curve. Treasury STRIPS would be ideal, but no one seems to favor this approach since STRIPS are low yielding causing the present value of liabilities to be higher. The yield difference in these discount rates could be significant. Any difference in yield creates a difference in the calculation of duration and liability growth rates.Generic Bond Indexes
A common proxy for the average duration of liabilities is to use a generic bond market index… usually the Barclay’s long corporate index. Such a proxy creates several erroneous data issues. This index has no bonds shorter than 10 years and no durations longer than 16 years. This certainly does not represent any pension liability schedule even if the average durations were similar. Accounting standards and actuarial practices price liabilities as a portfolio of zero-coupon bonds with a single average discount rate based on the present value of this zero-coupon liability portfolio. There are no generic bond indexes that use zero-coupon bonds as their portfolio. There are no generic bond indexes that use pension discount rates in accordance with FASB, GASB and PPA guidelines. Each pension plan’s liabilities are different and unique to that plan due to a different labor force, salaries, mortality, and plan amendments. There is no way any generic bond market index could represent any pension plan liability term structure.Only a Custom Liability Index could properly represent and measure any pension plan’s liabilities providing all of the critical data calculations needed to de-risk the plan. In 1991, Ron Ryan designed the first Custom Liability Index (CLI). Based on each client’s unique projected liability benefit payment schedule, Ryan ALM produces monthly CLI reports on:
Structure (Present Value, Average Duration, YTM, Price, etc.)Growth Rate (Liability growth for month, year, and since inception)
Interest Rate Sensitivity (PV change in % and $ given rate changes)
Interest Rate Sensitivity
Every 1 year of duration difference between the liability proxy and the actual duration of each plan’s benefit payment schedule would represent a 1% mismatch in liability growth for every 100 bps of discount rate change. In truth, the duration mismatch is more likely to be three to five years rather than one year. Given that pension cost for the actuary, administration, asset managers, and consultant are usually less than 50 bps a year; such a duration mismatch could be very costly representing years of pension cost.
Funding Liabilities
Imagine a 12-year average duration liability benefit payment schedule. It could have many different term structure shapes to come up with an average 12-year average duration. Imagine 100% of the assets in a 12-year duration bond portfolio. If interest rates rose 50 basis points in one-year, total assets and liabilities supposedly would both have a -6% price return (interest rate movement x duration (as a negative number). If they had the same income return = 5% they would match again. However, if the duration matching assets are used to fund liabilities as they come due then a -1% loss (-6% + 5% = -1%) on assets could be funding a short liability which will have a small positive growth rate. So, the assets could be taking a loss each year to fund the next liability payment if interest rates continue to rise. This could get to be a serious costly mismatch if interest rates continue their secular trend to higher rates for the next few years. But the point is……there is no cash flow match here, only a duration match so there is both a funding and interest rate risk!
Derivatives
Interest rate swaps and futures are contracts not assets. There is no cash flow or funds available to make the liability cash flow payments. They are certainly NOT de-risking strategies but hedges vs. the liability growth rate. In fact, these strategies introduce more risk: counter party risk, interest rate risk, non-matching risk of assets purchased (usually equities) vs. liabilities, and leverage. In addition, interest rate swaps and futures have all of the problems associated with a liability proxy data gathering… as listed with duration matching.
Solution: Cash Flow Matching
As stated in the beginning, matching the liability benefit payment schedule (liability cash flow) at the lowest cost is the ideal way to de-risk a pension plan. Ryan ALM built a liability cash flow matching product, named the Liability Beta Portfolio™ (LBP), as a cost optimization model that matches the liability benefit payment schedule at the lowest cost given the investment policy restrictions of our clients.
The LBP provides about a 2% per year funding cost savings (1-15 years = 30%). This is a serious cost reduction and should be a major consideration of any de-risking strategy. Yes, the LBP model has some credit risk but very small since we are using investment grade corporate bonds with a credit filter (no bonds on negative watch list) plus the cost savings provides a large value-added cushion.
The funded ratio should dictate the allocation to bonds. A surplus should have a high allocation to bonds matched to liabilities and vice versa for a deficit funded status. Unfortunately, asset allocation did not respond to the surplus status in the 1990s which led to the US pension crisis. With funded ratios at 120% and above then, why didn’t pensions immunize and secure this victory? Amazingly, instead of increasing their bond allocation in response to a growing funded ratio they reduced it consistently because of low interest rates to the lowest bond allocations in modern history by 1999.
The allocation to bonds should determine how much of the liabilities we can cash flow match (i.e. a 25% bond allocation might fund the next seven years of gross liabilities). Ryan ALMrecommends: funding the next 10 years of Retired Lives on a net liability basis (after contributions). Indeed, current assets fund the net liabilities not the gross liabilities. Our LBP model will calculate with precision the cost to fund liabilities (gross or net) in a cost-effective manner either as a % of total liabilities or liabilities chronologically, as both methods will de-risk the plan gradually. There are advantages for each method.
Since liabilities are funded initially by contributions, using the LBP model to cash flow match net liabilities chronologically may be able to fund more liabilities than you think. Assume that a 20% bond allocation could match the next 10 years of net liability payments chronologically. Based on the Ryan ALM Liability Beta Portfolio™ (LBP) model we show a cost savings of about 20% on cash flow matching the first 10 years of liabilities, in this interest rate environment.
Matching liabilities chronologically should also buy time for the non-bond assets (Alpha assets) to perform and outgrow liabilities. Given time (7-10 years) most non-bond asset classes tend to outperform bonds. Since liabilities behave like bonds there is a high probability that non-bond asset classes could outperform vs. liability growth over an extended time horizon.
Since the pension objective is a cost focus, cash flow matching a % of total liabilities would produce the optimal cost savings since the longer the bond the less it costs given the same future value. Our LBP model is back tested since 2009. Every $1 billion in bonds used in our LBP model could save about $200 million in cost savings on a 1-10 year liability schedule and $400 million on a 1-20 year liability schedule.
Asset Allocation (AA)
Pension consultants and plan sponsors should consider installing an LBP as the core portfolio in asset allocation and as the liquidity assets to fund liability cash flows chronologically. The intrinsic value in bonds is the certainty of their cash flows. Bonds are usually not considered performance assets (Alpha assets) especially vs. pension liabilities which behave like bonds. Cash flow matching liabilities chronologically will buy time for the Alpha assets (non-bonds) to perform vs. liability growth, thereby enhancing the funded ratio. Such excess returns should be transferred over to the Liability Beta Portfolio™ (LBP) to de-risk more and more liabilities… Portable Alpha. Had this portable Alpha discipline been in place during the decade of the 1990s when funded ratios grew to their highest historical levels with true economic surpluses… there would be no U.S. pension crisis today!
Nota Bene (Note Well)
Please note that the definition of risk used in this article is in sharp contrast to the traditional approach produced by the Nobel Prize winner Ph.D. William F. Sharpe back in 1966. Professor Sharpe proposed that risk is the volatility of total returns and that the three-month T-Bill was the default risk-free rate. He developed the Sharpe Ratio as a means of calculating the risk-adjusted return by subtracting the return of the three-month T-Bill from the mean return of the asset(s) being analyzed and dividing the net return by the volatility of the return of the asset(s) in review. For many decades the Sharpe Ratio was the standard measurement of risk-adjusted returns. In 1994 Prof. Sharpe called me and invited me to Stanford to discuss our unique Custom Liability Index data and reports. I had the unique pleasure to meet and debate with one of the finest intellects I have ever met.
I proposed that risk is not a generic measurement but based on each client’s objective. I referenced pensions where every client’s liabilities are different (like snowflakes). As proof, I asked Professor Sharpe what is the risk-free asset for a 10-year liability payment? Professor Sharpe answered… a 10-year Treasury zero-coupon bond. Prof. Sharpe identified that the three-month T-Bill would have 39 reinvestment moments of uncertainty, so there is no way the three-month T-Bill could match a 10-year liability future value with any certainty and would become a risky asset. Our discussion led to Prof. Sharpe re-inventing the Sharpe Ratio in 1994 to include the benchmark objective instead of the three-month T-Bill in the numerator and denominator such that the average return of the asset portfolio is reduced by the average return of the objective (numerator). This net average return is then divided by the standard deviation of the asset portfolio excess return vs. the objective return. This is commonly called today… the Information Ratio.
Ryan ALM Pension Alert Q2’23
Most Asset Allocations for pensions are based on achieving the ROA. The ROA is an annual forecast of asset returns. Each asset class is assigned a ROA then weighted by...
Source: Ryan ALM Pension Alert Q2’23
Spread between ROA and Bonds Narrowest in 20+ Years
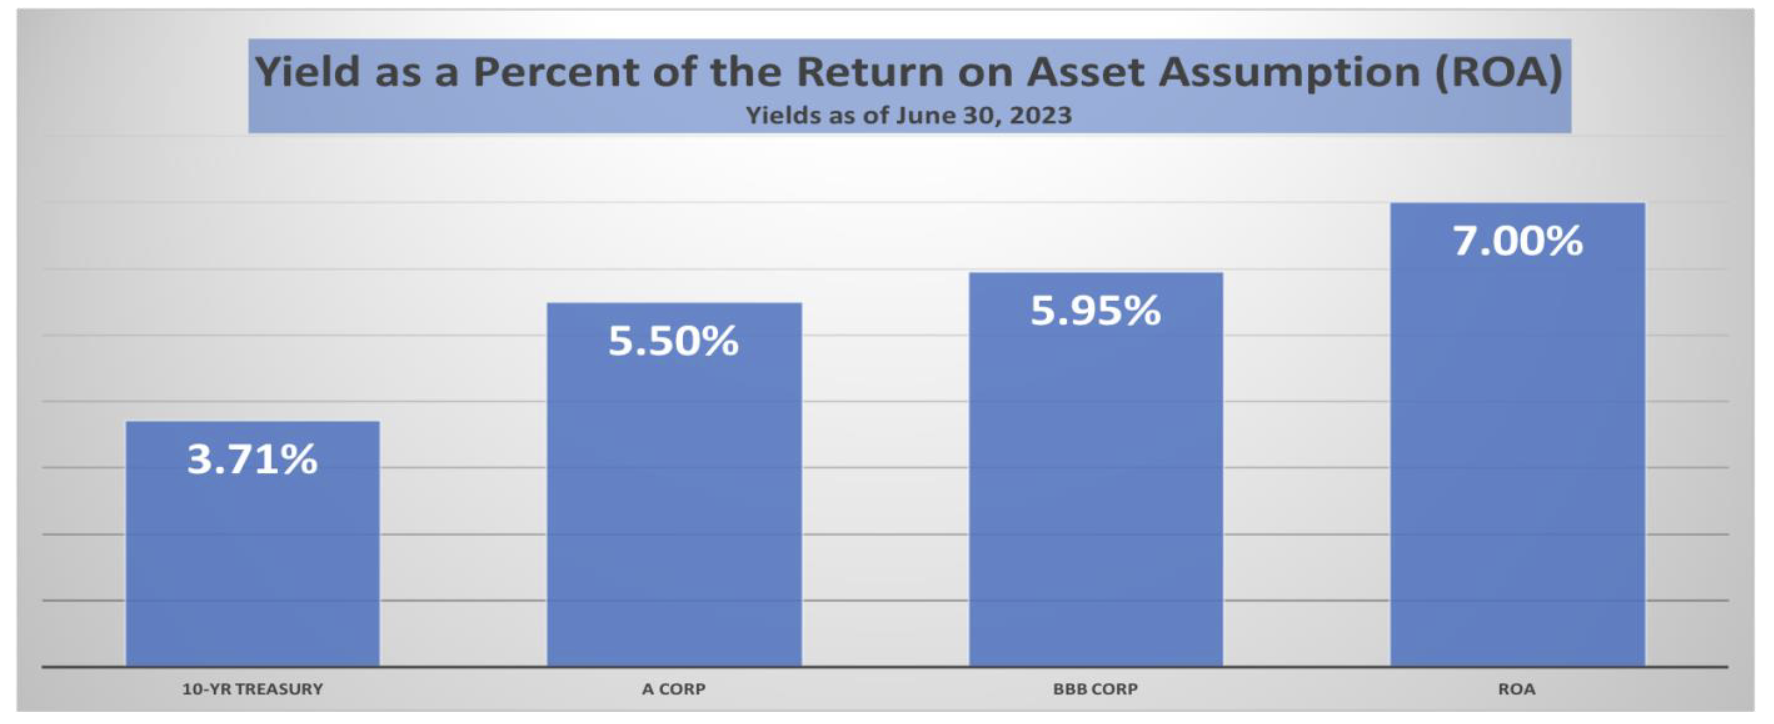
Most Asset Allocations for pensions are based on achieving the ROA. The ROA is an annual forecast of asset returns. Each asset class is assigned a ROA then weighted by the target allocation to get an average or target ROA. Currently, the ROA for most Public pensions is around 7.00%. Yields on A and BBB corporates have risen significantly in the last two years and are now fast approaching the ROA target return. With A and BBB corporate yields at 78.6% to 85.0% of the ROA, a strong argument should be made to increase the allocation to fixed income. The 2023 Milliman Public Funding Survey suggests that the ROA will continue its trend lower. With the Milliman 2024 estimate of a 6.75% ROA, A and BBB corporate bonds would approach 81.5% to 88.2% of the target return. Ryan ALM recommends using bonds for their intrinsic value… the certainty of their cash flows. Cash flow matching liabilities chronologically would be in harmony with the true objective of a pension… to secure the promised benefits in a cost-efficient manner with prudent risk.
Benefits of Higher Bond Allocation to Cash Flow Matching:
Improve Liquidity
Outyield ROA = liability Alpha
Reduce Volatility (risk) of Funded Ratio
Create CORE portfolio as anchor to earning ROA
Reduce costs to fund Benefits + Expenses (B + E)
Buy TIME for performance assets to grow unencumbered
Ryan ALM Pension Monitor YTD 2023
YTD2023 Ryan ALM Pension Monitor (Through June 30, 2023) Pension plan liabilities need to be measured and monitored regularly. Without knowledge of plan liabilities, the allocation of plan assets cannot...
Source: Ryan ALM Pension Monitor YTD 2023
(Through June 30, 2023)
Pension plan liabilities need to be measured and monitored regularly. Without knowledge of plan liabilities, the allocation of plan assets cannot be done efficiently or appropriately. The funded ratio/status of pension plans are present value calculations. Each type of plan is governed by accounting rules and actuarial practices, which determine the discount rate used to calculate the present value of liabilities. Single employer corporate plans are under ASC 715 (FASB) discount rates (AA corporate zero-coupon yield curve); multiemployer plans and public plans use the ROA (return on asset assumption) as the liability discount rate. The difference in liability growth between these plans can be quite significant (see 2022’s differential of 31.5%), which will affect funded status and contribution levels.
The table below compares these different liability growth rates (based on a 12-year average duration) versus the asset growth rate based on the P&I asset allocation survey of the top 1,000 plans which is updated annually.
| ASSET ALLOCATION | YTD 2023 Return | Corporate | Public | Union |
|---|---|---|---|---|
|
Domestic Stock International Stock Global Equity Domestic Fixed Income Global Fixed Income Cash Private Equity Real Estate Equity* Other |
16.9% 12.2% 14.3% 2.1% 1.7% 2.3% 5.8% -5.4% 3.6% |
11.1% 6.1% 6.3% 44.4% 0.9% 2.2% 12.4% 5.5% 11.1% |
22.1% 13.4% 4.5% 19.4% 1.6% 1.6% 15.1% 11.6% 10.7% |
18.7% 9.1% 13.6% 28.9% 0.0% 0.7% 10.7% 9.4% 8.9% |
| TOTAL ASSETS Growth Rate | 5.3% | 7.1% | 7.3% | |
| LIABILITIES Growth Rate** | 4.2% | 3.6% | 3.6% | |
| Asset Growth – Liability Growth | 1.1% | 3.5% | 3.7% |
Index Benchmarks: Domestic Stock = S&P 500; Int’l Stock = EAFE, Global Equity = All Country World; Domestic Fixed Income = BB Aggregate; Global Fixed Income = FTSE World Gov’t (unhedged); Cash = Ryan ALM Cash Index; Private Equity =10-year return for the R2500 + 2%; *Real estate Equity =NFI-DP Index (one month lag); Alternative Investments and Other = CPI-U & 3%.
** Liabilities (corporate) = Ryan ALM ASC 715 discount rate and Liabilities (Public, Multiemployer) = 7.25% ROA
The graph below shows the contrasting annual differences of asset versus liability growth for corporate and public plans since 2015. The impact of different accounting rules (FASB vs. GASB) can create confusion, as reflected in the chart below.
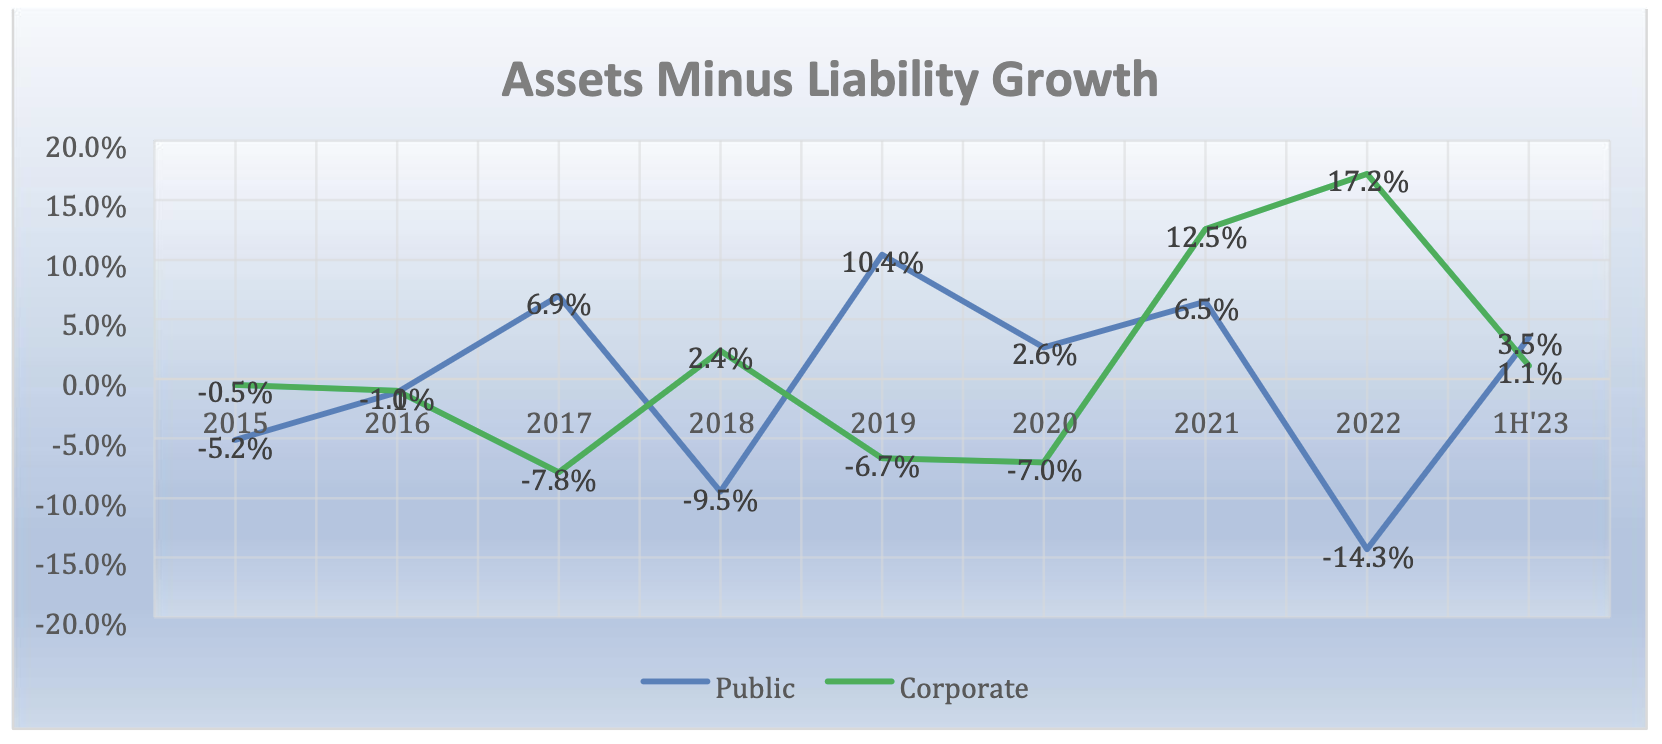
Footnote: The measurement of asset growth to liability growth is an annual calculation beginning on December 31, 2015. For periods shorter than 1-year, the observation is a YTD calculation.
With regard to the first half of 2023, Corporate funding underperformed Public funding as declining interest rates YTD had a slightly greater impact on the present value of a plan’s future benefits. In addition, the much higher exposure to US fixed income within corporate pension plans (44.4%) versus both public (19.4%) and multiemployer (28.9%) and the far less exposure to US equities (11.1%) versus publics (24.4%) and multiemployer (21.8%) had a meaningful impact on the average total return for those plan types.