
Ryan ALM
White Papers
Browse
What’s Better For a Pension?
Asset returns are uncertain and very volatile. The S&P 500 is a good example. Since 1990 this index has enjoyed 13 years of 20% + growth. Unfortunately, it was accompanied...
Source: What’s Better For a Pension?
Asset returns are uncertain and very volatile. The S&P 500 is a good example. Since 1990 this index has enjoyed 13 years of 20% + growth. Unfortunately, it was accompanied with several negative return years which brought the average 20 year return down to 9.75%:
The decades of the 2000s began with three negative return years for the S&P 500 as follows:
2000 = (9.03%) 2001 = (11.85%) 2002 = (21.97%)
This combined with a secular decline in interest rates made liability growth spike by 55.12% in those three years (according to the Ryan ALM Liability Index) causing funded ratios to drop significantly by as much as 47%. This brings up the commonsense math… if funded ratios go down about 50%, they need to have assets outgrow liabilities by about 100% to get back to full funding. Since the return on assets (ROA) forecast is not based on the funded status but on the expected return of the plan’s asset allocation, the actuarial projections must make up the funded status deficit by increasing contributions. Most pension plans have experienced spiking contributions costs since 2000 which I proclaimed as the primary impetus for the US pension crisis in my 2013 book (The U.S. Pension Crisis). The uncertainty and volatility of the actual ROA has plagued pensions forever and will continue if this remains the focus of asset allocation.
Since the true objective of a pension is to secure benefits in a cost-efficient manner with prudent risk then asset allocation should be focused on this objective and not an ROA objective, which doesn’t guarantee success. This is best accomplished by bifurcating assets into liquidity (Beta) and growth (Alpha) assets. The liquidity or Beta assets should fully fund the liability cash flows (benefits + expenses) chronologically with certainty for as long as the allocation will cover. We define risk as the uncertainty of achieving the objective. So, the least risky asset strategy is to cash flow match (defease) the liability cash flows with certainty. Depending on the plan’s funded status will dictate the asset allocation between the liquidity and growth assets. The funded status is best measured by the
Asset Exhaustion Test (AET) which compares the annual asset cash flows (including contribution) versus the annual liability cash flows (including benefits + expenses).
Ryan ALM recommends starting with an allocation to liquidity or Beta assets that fully funds the liability cash flows for the next 10 years. Then we run the AET to see what ROA is needed for the residual growth assets to fully fund the residual liability cash flows. If the calculated ROA is lower than the current ROA assumption, you can allocate more to the liquidity assets and vice versa.
The benefits of the Ryan ALM cash flow matching strategy (Liability Beta Portfolio™) are numerous and significant:
Reduces risk (de-risks) by cash flow matching liability cash flows with certainty
No interest rate risk since it is funding future values (B+E liability payments)
Provides timely and proper liquidity to fully fund benefits + expenses (B+E)
AET will calculate proper allocation between liquidity and growth assets
AET will calculate ROA needed to fully fund liability cash flows
Reduces funding costs by about 2% per year (1-10 years = 20%)
Reduces asset management costs (Ryan ALM fee = 15 bps)
Reduces volatility of the funded ratio and contributions
Buys time for the Alpha assets to grow unencumbered
No need for a cash sweep to meetliquidity needs
In summary, a LBP cash flow matching strategy for liquidity assets will reduce funding costs by about 2% per year (1-10 years = 20%) while fully funding the liability cash flows with certainty. This will reduce the volatility of the funded status and allow plan sponsors and their consultants to better plan asset allocation for the growth assets. By eliminating a cash sweep, the growth assets can now reinvest their income and enhance their ROA. So, I ask once again: What is better for a pension plan? A 20% asset gain or a 20% liability cost reduction? It is clearly the cost reduction given the certainty of the outcome!
Magnificent 7: Caveat Emptor!
As pension watchdogs, Ryan ALM is always interested and concerned about trends that may affect the funded status of pensions. Since the major asset holding of most pensions is the...
Source: Magnificent 7: Caveat Emptor!
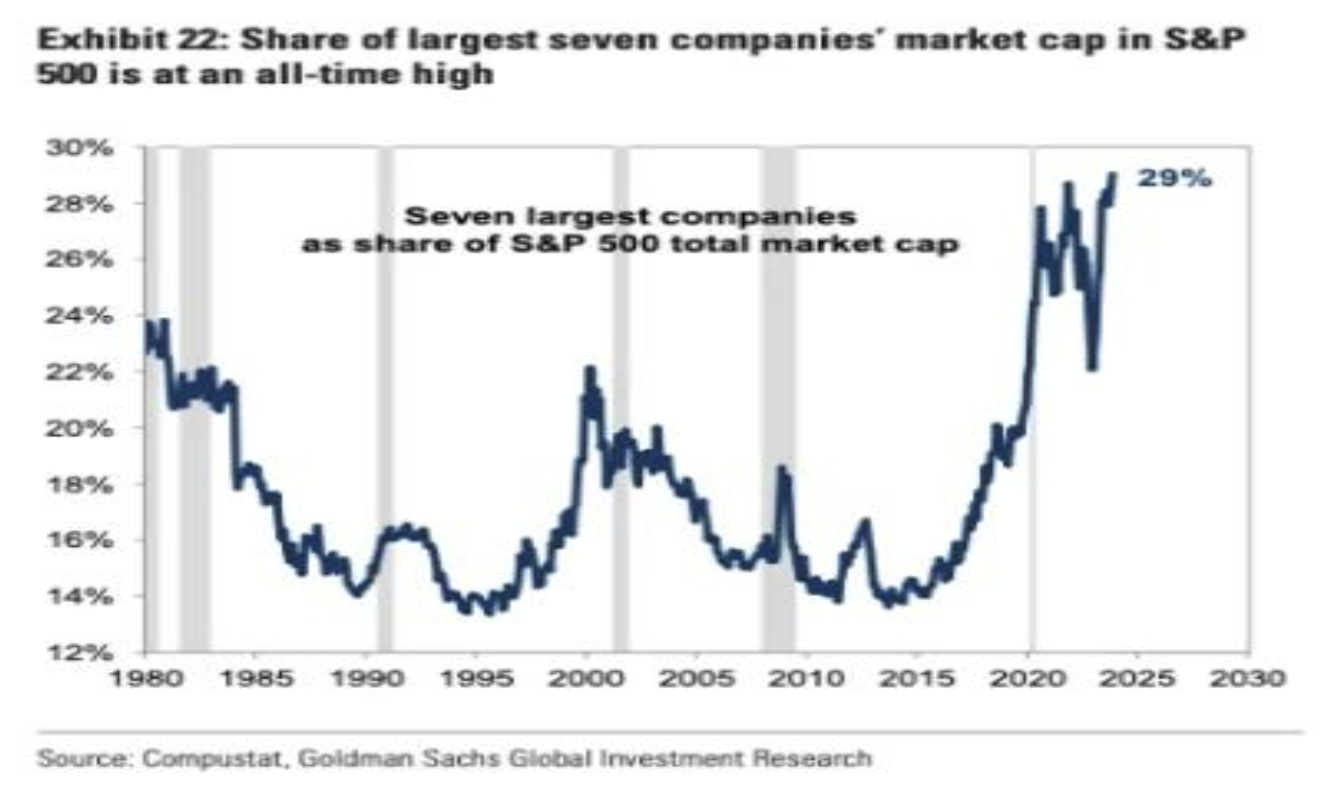
As pension watchdogs, Ryan ALM is always interested and concerned about trends that may affect the funded status of pensions. Since the major asset holding of most pensions is the S&P 500, we are on the alert for anything that may affect this valuable asset. I recently attended a CFA dinner where Rob Arnott, founder and chairman of Research Affiliates a subdivision of PIMCO was the guest speaker. Rob is quite articulate and brilliant on his assessments and forecasts. He was concerned about the valuation of the Magnificent 7 and thought the P/E multiples may not be sustainable. I share Rob’s concerns for the following reasons.
Apple became the first $3 trillion market valuation in America’s history. The seven largest capitalized technology stocks (i.e. the Magnificent 7) have been the main driver of returns for the S&P 500 for several years and certainly in 2023 YTD. As of December 1, this group had a total return = 98.79% based on the Bloomberg Magnificent Seven equal weighted index. At the same time the S&P 500 has a YTD return of 20.96%. According to BOA Global Investment Research, the Mag 7 account for 29.6% of the S&P 500 market capitalization. The newly released Bloomberg Large Cap index without the Magnificent 7 (B500XM7T) posted a YTD return of 7.6% which is 36.4% of the YTD S&P 500 return of 20.96%. This means that the Mag 7 has a YTD weighted group return of 13.33% which accounts for 63.6% of the S&P 500 YTD return (as of 12/01/23).
The Mag 7 should continue to grow well given their product line, market share, higher sales growth, higher margins, strong balance sheet and greater re-investment ratio in their market. The main question is one of valuation. Although it may be hard to assess a proper P/E multiple for each of the Mag 7, the wide array of P/E multiples and comparison to the market seem quite overvalued… S&P 500 multiple = 24.2x current and 18.7x forward (source: Yardeni). Tesla at 76.9x current/61.7x forward seems hard to justify especially with earnings growth of -6.1% over the last 12 months. Alphabet, Apple, Meta and even Microsoft trailing 12 months EPS growth do not seem robust enough to merit their valuation either.
| Stock Symbol | Company | PE current | PE forward | Market Capitalization | EPS Growth 5-year Avg. | EPS Growth Last 12 mos. |
|---|---|---|---|---|---|---|
| GOOG | Alphabet | 25.38x | 19.80x | $1.66 trillion | 25.4% | 3.4% |
| AMZN | Amazon | 76.69x | 41.03x | $1.52t | 63.0% | 74.1% |
| AAPL | Apple | 31.55x | 27.16 | $3.01t | 14.4% | 0.3% |
| META | META | 28.10x | 18.17x | $0.82t | 8.9% | 3.1% |
| MSFT | Microsoft | 36.08x | 28.76x | $2.77t | 18.4% | 10.5% |
| NVDA | Nvidia | 61.48x | 22.61x | $1.15t | 27.7% | 264.5% |
| TSLA | Tesla | 76.87x | 61.72x | $0.76t | 40.5% | -6.1% |
| S&P 500 | 24.2x | 18.7x | $37.7t |
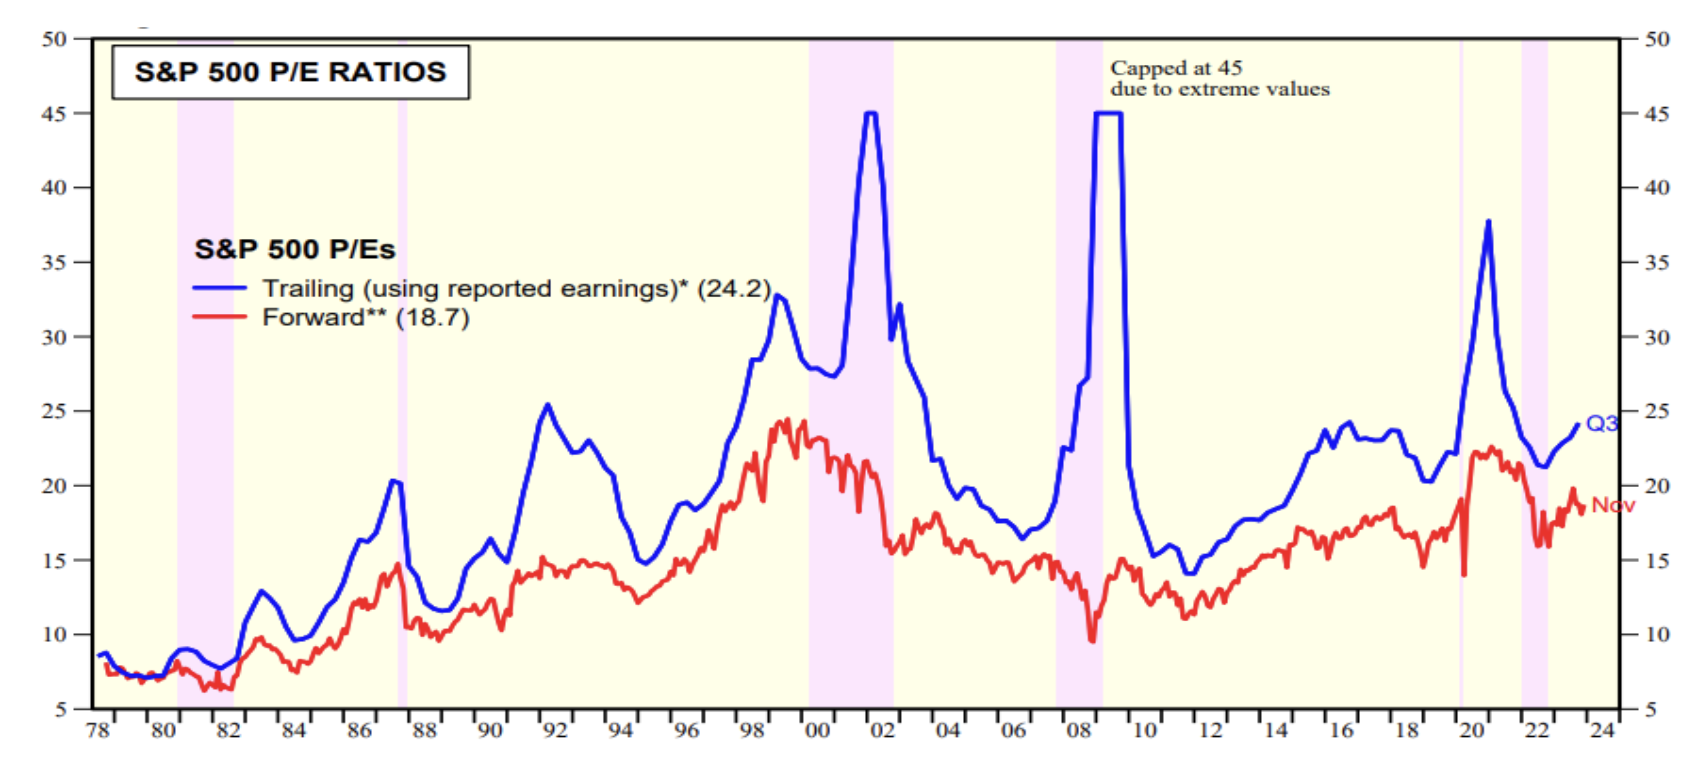
Goldman Sachs Global Investment Research is forecasting a 6% growth for 2024 for the S&P 500. This does not validate the P/E multiples of the S&P 500.
“Investors should be skeptical of history-based models. Beware of geeks bearing formulas”
Warren Buffett
Greatest Asset of a Pension… TIME!
I recently spoke at the FPPTA conference in Orlando on pension risk management. One of the speakers was Mike Welker, CEO of AndCo Consulting, who I thought had the most...
Source: Greatest Asset of a Pension… TIME!
I recently spoke at the FPPTA conference in Orlando on pension risk management. One of the speakers was Mike Welker, CEO of AndCo Consulting, who I thought had the most incisive comment of the conference. Mike said,“the greatest asset of a pension is time.” He was referencing that pensions have a long-time horizon to work in… perhaps, perpetuity. With such a long horizon, short-term distractions and corrections should not make a pension detour from its long-term goal and strategy. Mike is very right.
Ryan ALM believes that the best way to buy time is to cash flow match a pension plan’s liabilities chronologically. Almost any performance return study on asset classes shows that given time most, if not all, asset classes perform in line with their return and risk expectations. We’ve also observed that pension plans generally sweep cash from all asset classes each month to fund current benefits and expenses (B + E). We urge plan sponsors not to provide liquidity in this way, as S&P 500 data suggests that 47% of the S&P 500 index returns come from dividends and the reinvestment of dividends over 10-year rolling periods since 1940.
We urge plan sponsors and their consultants to separate liquidity assets from growth assets. Let bonds be the liquidity assets. Let bonds fund B + E chronologically for as long as the time you need for the growth assets to grow unencumbered. Based on S&P data, equities outperform bonds 82% of the time on a rolling 10-year basis, which seems like a proper time horizon for a cash flow matching strategy. Buying time should be a major strategy for pension plans and its liquidity needs.
Cash Flow Matching
Cash flow matching is a very old and well tested fixed income strategy. It used to be called Dedication in the 1970-1990s. It is an accurate and tedious process to build a bond portfolio whose cash flows (principal + interest) will cash flow match the liability cash flows (B + E) monthly. It is a future value (FV) matching process not present value (PV), which differentiates it from Immunization and duration matching strategies that are subject to great volatility and uncertainty of cash flows since they are focused on present value matching. Interest rates change every day across the yield curve and term structure of liabilities making PV matching mission impossible. The greatest value of bonds is the certainty of their cash flows (FV). Liability cash flows tend to be quite certain as well, especially for Retired Lives. That is why bonds have been used historically to fund liability cash flows. Today it is referred to as cash flow driven investing (CDI) especially in Europe and Canada. Ryan ALM believes that the value in bonds is the certainty of their cash flows. We do not view bonds as performance or growth assets. We see bonds as the liquidity assets!
Buy Time!
By cash flow matching B + E for the time you need
Let bonds be the liquidity assets and fund B + E chronologically
Let the performance assets grow unencumbered for the time you need (7-10 years)
Pension Confusion - The Problem with Averages
Pension Confusion: The Problem with Averages Most pension have assets managed to generic market index benchmarks and/or liabilities. In both cases, the focus of these assets is to match or...
Source: Pension Confusion - The Problem with Averages
Pension Confusion:
The Problem with Averages
Most pension have assets managed to generic market index benchmarks and/or liabilities. In both cases, the focus of these assets is to match or beat some average (i.e., duration, total return, YTM). Unfortunately, few understand how these averages can be misleading if not erroneous.
Liabilities (Duration Matching)
Duration matching is a common LDI strategy for pensions where the plan sponsor looks to immunize their bond portfolio versus the interest rate sensitivity of the liabilities they are funding. To achieve this interest rate immunization, the strategy is to match the average duration of the liabilities. There are at least four problems here:
The actuary does not provide the average duration of projected benefits.
The actuarial report usually comes out annually… months after the fiscal year. Duration is a present value calculation that changes with interest rates and time, both of which change daily.
Assets do not fund gross projected benefits. They fund net benefits after contributions. This net liability is not calculated by the actuary which can be much different than the gross liability in dollars and duration especially for Corporate and Public pension plans that have a high contribution rate. Pension assets need to know what they are funding. The economic reality is… assets are funding net liabilities after contributions!
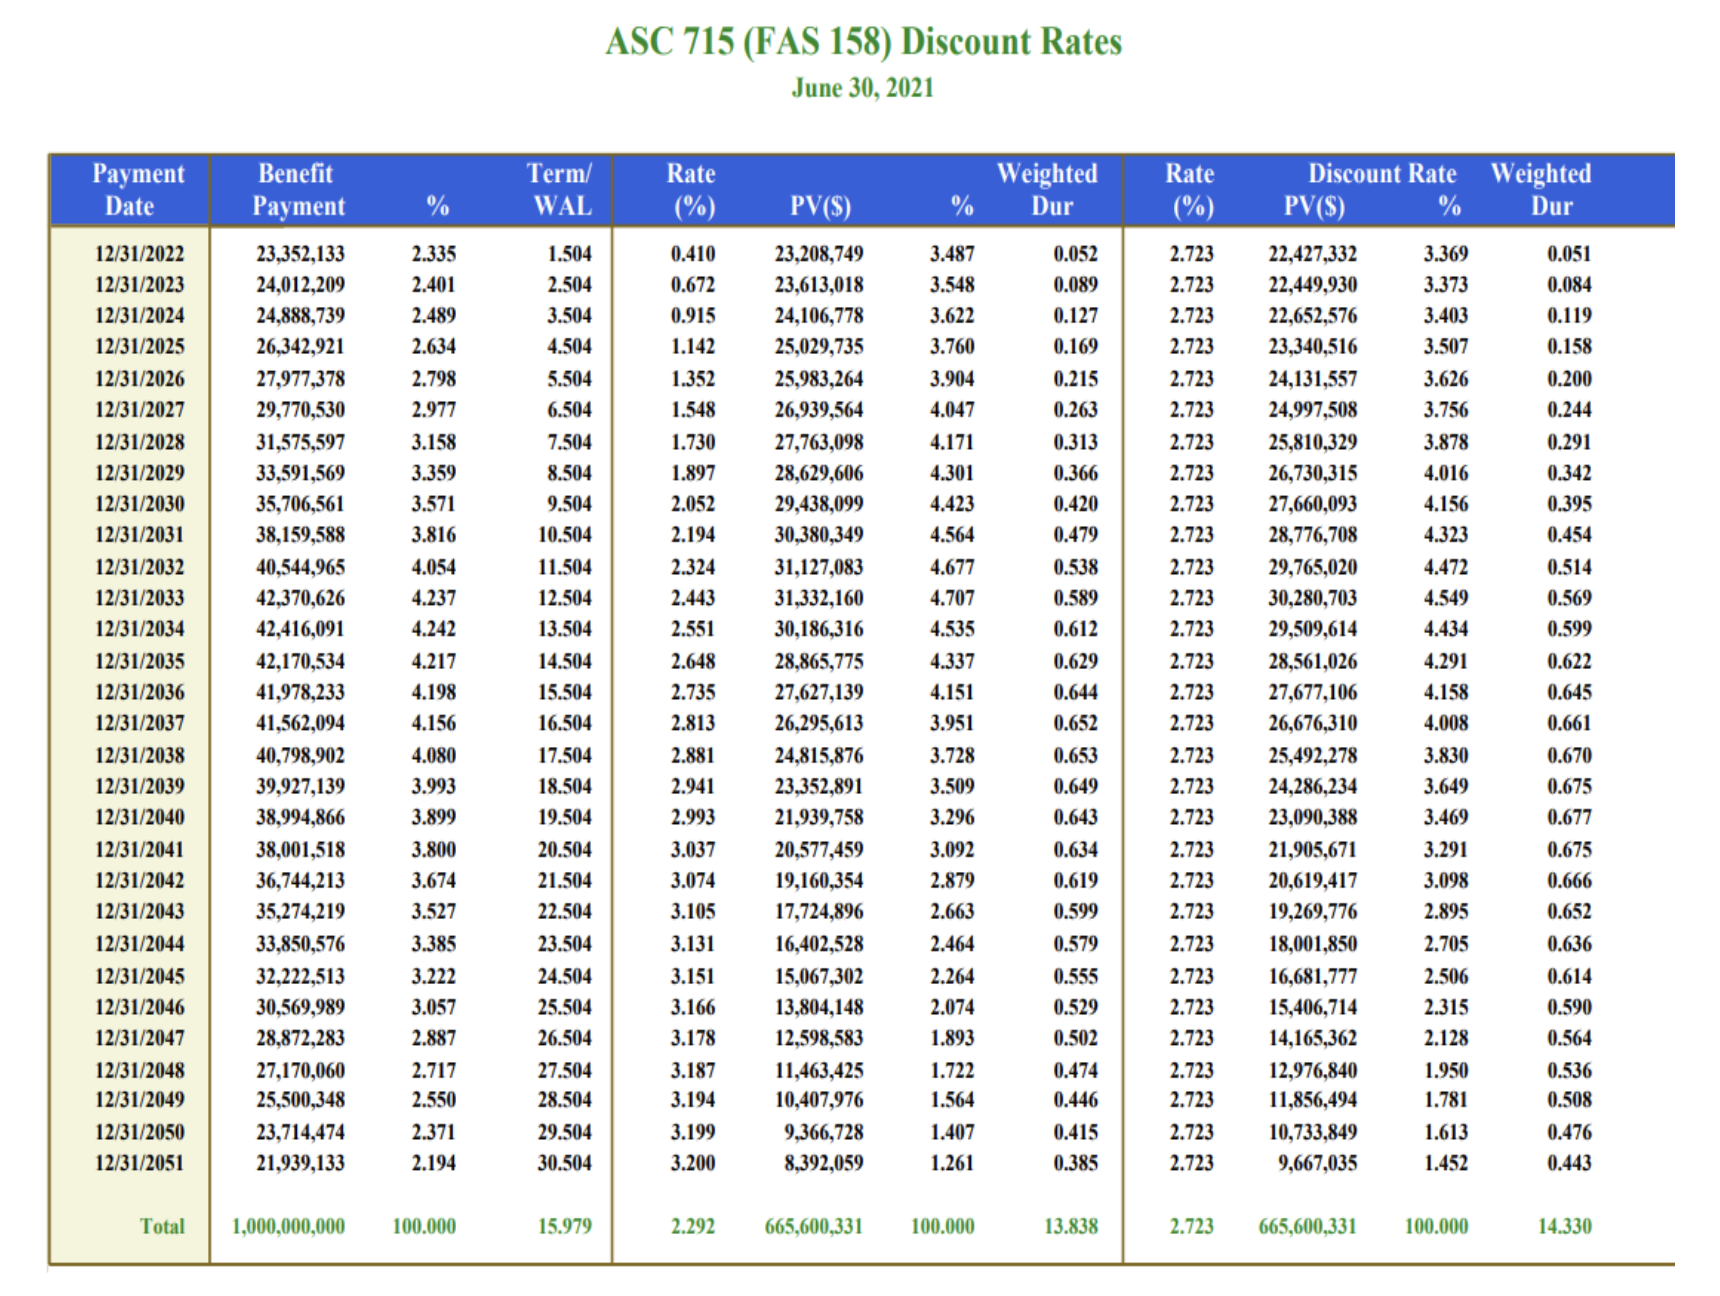
Duration is a present value calculation based on a discount rate yield curve. ASC 715 is the most prominent and acceptable for corporate and multiemployer pension plans. Moreover, Moody’s has adopted ASC 715 discount rates to assess municipal credits instead of the ROA discount rate commonly used under GASB accounting. FASB requires that this ASC 715 discount rate yield curve be converted to a single rate average discount rate. The duration of this single discount rate is certainly different than the average of a multiple discount rate yield curve. In the sample liability term structure shown on the next page priced with ASC 715 discount rates, we calculate:
| ASC 715 Yield Curve | Single Rate | Difference | |
|---|---|---|---|
| Average Yield | 2.29% | 2.72% | 0.43% |
| Duration | 13.84 years | 14.34 years | 0.50 years |
Note: For an accurate immunization, you need to match the duration of the ASC 715 yield curve (all liabilities) not the single rate average duration.
Solution: $ Duration Matching with Modified Duration
Maturity is an indicator of interest rate risk because longer maturity bonds move more in price than shorter maturity bonds given a change in yield. However, maturity is not a good measure of interest rate risk because maturity only considers the timing of the final principal cash flow at maturity and ignores the sizes and timing of all the other cash flows leading up to maturity.
The present value or price volatility of pension liabilities behaves just like bonds. A pension liability schedule is a term structure or yield curve of ASC 715 rates. Therefore, the interest rate risk in a pension liabilities schedule (actuarial projected benefits) can be matched with a portfolio of bonds.
A better measure for interest rate risk in the form of price sensitivity is called Modified Duration. Modified Duration considers all the bonds cash flows and is the weighted average time to receipt of all the cash flows, with the weights being the present values of the cash flows divided by a factor of (1+Y) where Y is the annual yield to maturity of the bond.
Modified Duration represents the percentage price change in market value in response to a change in the asset or liability yield. By weighting modified duration by the market value of the holding, that is, by multiplying the market value of the position by its modified duration, we get dollar-weighted duration. This dollar-weighted duration is known as Dollar Duration and represents the actual dollar change in market value for a bond given a change in its yield. Dollar duration is typically expressed in the dollar value change per one basis point change in yield (DV01).
The major advantages of using dollar duration are that it is additive and better suited for asset liability management. Dollar duration extends easily from individual securities to entire portfolios. The dollar duration of a portfolio is simply the sum of the dollar durations of all the individual holdings. The dollar duration of a bond portfolio can be matched to the dollar duration of pension liabilities. Bond durations cap out around 20-years so for liabilities with durations longer than 20-years it is not possible to match duration but… it is possible to match the Dollar duration of liabilities with durations longer than 20-years. Therefore, Dollar duration is very useful in asset liability management for liability driven investors such as defined benefit pension plans.
Ryan ALM uses dollar duration matching to help reduce pension volatility as defined as the dollar value difference in interest rate sensitivity between the present value of assets and liabilities. Ryan ALM starts by creating a Custom Liability Index (CLI) for each pension client. The Custom Liability Index is derived from the unique liabilities cash flow schedule provided by the plan actuary. The CLI measures and monitors the change in present value for the liabilities given a change in ASC 715 discount rates and is the proper benchmark for a plan sponsor and their liability driven investor(s).
Once we have determined the interest rate risk in the liabilities, the next step is to ensure that the bond portfolio has the same amount of interest rate risk as liabilities in order to reduce volatility between the present value of assets and liabilities. Ryan ALM builds a bond portfolio called the Liability Beta Portfolio (LBP) that matches the cash flows of the bonds to the liability cash flows (benefit payments). Since dollar duration is additive, we can set the dollar duration of the bond portfolio equal to the dollar duration of liabilities. Ryan ALM believes that cash flow matching liabilities with bond cash flows along with the use of dollar duration is a lower cost and lower volatility approach to pension asset liability management. It is certainly more accurate than traditional duration matching to immunize interest rate sensitivity.
Pension Alert: Secure Funded Status!
Private Pension Alert: Secure Funded Status! The pension objective is to secure benefits in a cost-efficient manner! Many private pension plans are in the best funded status since 1999. It...
Source: Pension Alert: Secure Funded Status!
Private Pension Alert: Secure Funded Status!
The pension objective is to secure benefits in a cost-efficient manner!
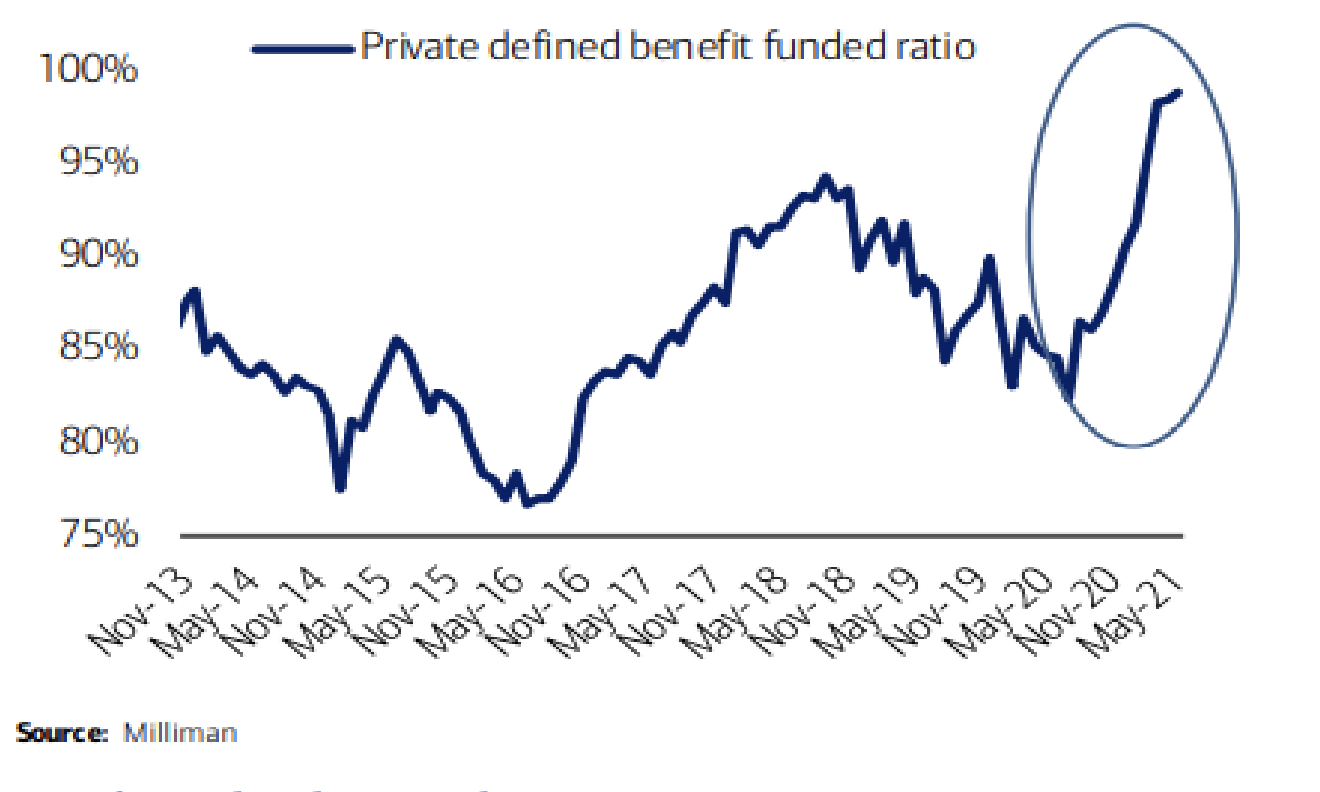
Many private pension plans are in the best funded status since 1999. It should be a high priority to secure this funded status NOW if not enhance it.
Secure Benefits and Reduce Funding Costs
There are basically only two ways to secure pension benefits: insurance annuities and defeasement (through cash flow matching benefit payments). Ryan ALM has been a pension watchdog and written many articles on the benefits of cash flow matching. Insurance buyout annuities (IBA) are expensive, but corporations are purchasing IBAs in record amounts to get rid of the high and rising PBGC premiums caused by the MAP 21 legislation of July 6, 2012 and to avoid longevity risk. However, corporations would be wise to do a cost analysis of the IBA versus a cash flow matching defeasance. The typical IBA prices Retired Lives (liabilities) at a discount rate of ASC 715 (AA corporate zero-coupon yield curve) plus a 3% to 4% premium. According to our calculations, a defeasance strategy (cash flow matching) using investment grade corporates would provide a cost savings of about 30% versus IBA, which is a very significant cost savings and should be reviewed. Such cost savings are immediate while the IBA savings of eliminating PBGC premiums is in the future.
Cash flow matching (using the Ryan ALM Liability Beta Portfolio™) is a cost optimization process where we go through numerous iterations to find the optimal cost savings that will fund each and every monthly Retired Lives benefit payment. Since liabilities are priced like bonds (ASC 715 discount rates) they behave like bonds. As a result, bonds become the proper assets to match and fund liabilities. Bond math tells us that the longer the maturity and the higher the yield… the lower the cost. Our LBP model skews the portfolio weights to longer maturities such that a 30-year coupon bond will partially fund 29 years of benefits through interest income. The same is true for a 29-year, 28-year, 27-year bond, etc. plus principal cash flow at maturities adds even more cash flow. Cash flow matching reduces funding risk because the bond cash flows are certain and the bonds may be held to maturity. Moreover, cash flow matching is the matching and funding of future values which do not change with changes in interest rates.
Reduce and Stabilize Contribution Costs
The LBP will match each and every monthly benefit payment in the liability schedule it is funding (Retired Lives). This will greatly reduce funded status volatility which will help stabilize contribution costs. The LBP is comprised of investment grade bonds skewed to longer maturities and A/BBB credits, so it will out yield liabilities priced as AA corporates (ASC 715 discount rates) by 50 – 100+ bps. Importantly, this extra yield creates an excess return (Alpha), which enhances the funded status, reduces contribution costs and could reduce the PBGC variable premium.
Only cash flow matching (defeasance) can secure benefits and reduce funding costs with certainty! By matching liabilities (benefit payments) it reduces risk accordingly.
Our LBP has numerous benefits that best achieve the true pension objective:
Cash flow matching the liability benefit payment schedule (Retired Lives) at the lowest cost is the ideal way to manage assets for a pension plan. Since Retired Lives are the most certain and most important (most tenured employees) liabilities, cash flow matching is a perfect fit given the certainty of the bond cash flows. Since the pension objective is a cost focus, cash flow matching would produce the optimal cost savings. We urge corporations to do a cost analysis before they buy an IBA! Even if an IBA is the future goal then the LBP would provide the perfect pension risk transfer of assets to an IBA.
Problem: Immunization (Duration Matching)
Duration matching is a strategy that attempts to reduce financial statement volatility while cash flow matching is a strategy for reducing funding volatility. Another difference is that duration is an ever-changing number so with duration matching the manager must continually rebalance for duration drift, while cash flow matching has the advantage that bond cash flows do not change. When we use duration matching to hedge financial statement volatility, we make assumptions that the yield levels of the liability hedging vehicle will move in parallel with liability yields. The fact is yields for different credits, and maturities do not all move in parallel. To facilitate benefits funding management ALM should focus on the liability yield curve or term structure which is exactly what the Ryan ALM custom liabilities cash flow matching and $ duration matching portfolios do in the most cost-efficient manner.
Traditional duration matching has definite liability cash flow mismatches and cost inefficiencies. Since the longest duration coupon bonds are around 19-years today, duration matching is forced to use Treasury zero-coupon bonds (STRIPS) to fund any liability past 19-years. Since Treasuries are the lowest yielding bonds, they are the highest cost bonds to fund and match liabilities. Moreover, duration is a present value (PV) calculation that is very interest rate sensitive. Duration matching is focused on matching liability % growth rates and not on matching and funding benefit payments (future values) and dollar growth rates.
Solution: Dollar Duration Matching (DDM)
DDM matches the dollar value change per basis point change in yield for assets with the dollar value change per basis point change in yield for liabilities. When the dollar duration of assets is matched to the dollar duration of liabilities for every year in the term structure of liabilities, then DDM is in its most precise form. That would be the equivalent of 30 Key Rate durations… one at every point along the liabilities yield cure or benefit payment schedule. The Ryan ALM DDM approach offers several value-added differences:
Actuarial Projections - We use the actuarial projected benefits of our clients and not a generic bond index benchmark.
Modified durations - to be an effective price sensitivity measurement, duration must be modified. Modified Duration measures the percent change in market value or present value for future value cash flows given a 100-basis point movement in yield.
The Ryan ALM DDM approach greatly improves the accuracy of Key Rate duration matching by matching the dollar value changes in liabilities with the dollar value changes in assets across the term structure and yield curve for liabilities. The liabilities are measured and monitored by using a Custom Liability Index (CLI) to more precisely calculate the dollar value (PV) movement in assets versus liabilities given any movement in interest rates.
The Role of Bonds in Pension Asset Allocation
Custom Liability Index (CLI) The first step in prudent pension management is to install a Custom Liability Index (CLI) to calculate and monitor the present and future value term structure,...
Source: The Role of Bonds in Pension Asset Allocation
Custom Liability Index (CLI)
The first step in prudent pension management is to install a Custom Liability Index (CLI) to calculate and monitor the present and future value term structure, growth rate and interest rate sensitivity of the plan’s liabilities. The CLI is the proper benchmark for any pension defined benefit plan. It is based on the actuarial projections of the future benefit payment schedule. The CLI will produce all of the critical calculations needed to manage and understand a pension: future value, present value, yield, duration, growth rate, term structure and interest rate sensitivity. Since contributions are the initial source to fund liabilities, current assets truly fund the net liabilities (after contributions). As a result, there needs to be both a gross and net CLI to show the significant differences in future values, present values, yield, duration, growth rates and interest rate sensitivity. It is rare to find a CLI installed in most pensions which leads to a misalignment of assets vs. liabilities. Beware of custom indexes that are a blend of generic bond indexes… where are the client’s liabilities? Ron Ryan created the first CLI in 1991 and Ryan ALM is a leader in providing CLIs to plan sponsors. We will price the CLI at any discount rate the client prefers: ASC 715, ROA, PPA, Treasury STRIPS. Since Moody’s has adopted the ASC 715 discount rates (zero-coupon AA corporates) for Public pensions and FASB uses ASC 715 discount rates for corporations, the ASC 715 discount rates would be the logical choice to calculate liability present value to understand the true economic funded status and liability growth rate.
Asset Allocation (AA)
Asset allocation is the single most important asset decision since it affects all assets. The goal of AA is to enhance the funded ratio and funded status in a cost-effective manner with prudent risk. AA should be based on the funded ratio and funded status not the ROA. A pension plan with a surplus should have a radically different asset allocation than a plan with a major deficit. Yet if these two plans had the same ROA (return on asset assumption) they would most probably have the same asset allocation… totally inappropriate! Note once again, assets fund the net liabilities (after contributions). So it is the net liabilities that should be used to calculate a net funded ratio and funded status which drives the AA. It is this net funded ratio and funded status that should be the focus of asset allocation. It is critical that current assets know what they are funding… net liabilities!
Funded Ratios History
Most pensions had a surplus in the 1990s. Prudent fiduciary responsibility should have secured this surplus through an asset liability matching (ALM) strategy using bonds (i.e. cash flow matching, defeasance or immunization). But since bond interest rates were low and trending lower, asset allocation models went the other way and reduced their allocation to bonds consistently and skewed their allocation to more and more risky assets (i.e. equity) in an attempt to achieve the ROA. This became a fatal mistake as funded ratios eroded by about 50% in the 2000-2002 equity correction period and have stayed in a deficit position ever since. The old adage, “if you go down 50%, you have to go up 100% to get back to 0%”... rang true in pensions. Had asset allocation been responsive to the rising funded ratio in the 1990s, it would have transferred more and more assets to bonds in an ALM strategy. Moreover, there was no anchor or core portfolio to de-risk the plan (ALM strategy) that would have significantly reduced the volatility of the funded ratio and secured the surplus.
De-Risking a Pension
Pension plans should want to de-risk their plans consistently over time. The lowest risk assets for a pension are those that match the liability benefit payment schedule (future values) with certainty. By definition, Treasury zero-coupon bonds (STRIPS) and annuities would be the lowest risk assets for pension since they have a known future value… but they tend to come at a high cost since they are low yielding and have high fees (annuities). Given that the pension objective is a liability objective with cost constraints, then solving for cost while matching the liability benefit payment schedule would be the ideal way to de-risk a pension. This is best accomplished thru a cash flow matching strategy. A pension liability benefit payment schedule is a term structure or yield curve often referred to as the liability cash flow. In order to match or de-risk the liability cash flow requires a matching cash flow from assets. Basically, only bonds and annuities produce a certain cash flow. That is why bonds and annuities are preferred as the way to defease, immunize and de-risk a pension plan.
Problem: Immunization Strategies (Duration Matching)
The initial problem with duration matching is where do you get the duration of each client’s liabilities. The actuary does not calculate and provide the average duration of liabilities in the annual actuarial report. Most, if not all, duration matching strategies use a generic bond market index as the proxy for liabilities. How could one generic index represent each unique pension plan? Pension liabilities are like snowflakes, you will never find two alike… different labor force, salaries, mortality, plan amendments, etc. The difference in liability cash flows and durations could be quite significant. For every year you are off in duration, should represent a 1% difference in liability growth per 100 bp move in the discount rates. Without a custom liability index, duration matching is a futile effort.
Imagine a 12-year average duration liability benefit payment schedule. It could have many different term structure shapes to come up with an average 12-year average duration. Imagine a bond portfolio where 100% of the bond assets have a 12-year duration. If interest rates rose 50 basis points in a year the total assets and liabilities supposedly would both have a -6% price return (interest rate movement x duration (as a negative number)). If they had the same income return = 4% they would match again (note that assets usually don’t match the income or yield of liabilities). However, if the matching assets are used to fund the liability cash flow of annual benefits then a -2% loss (-6% + 4% = -2%) on assets could be funding a one-year liability which should have a small positive growth rate. Consequently, the assets could be taking a loss each year to fund the next liability payment if interest rates continue to rise. This could be a serious costly mismatch if interest rates began a secular trend to higher rates for the next five years. But the point is… there is no cash flow match of the liability term structure, only a duration match of total liabilities so there is serious funding risk!
Imagine another duration matching approach where you buy bonds that exactly match the duration of each liability payment. So you would buy a 3-year duration bond to fund a 3-year benefit payment, a 5-year bond to fund a 5-year benefit payment, etc. Using corporate bonds to duration match is difficult, if not impossible. First, there are no corporate zero-coupon bonds. Second, the duration of a coupon bond changes with interest rates so if interest rates go down the durations should go up and vice versa. This is not compatible with funding each benefit payment as they come due over time since liabilities behave like zero-coupon bonds. Third, duration matching does not match or fund each benefit payment (the benefit payment schedule). Last, there are no corporate coupon bonds whose durations exceed 16-years so you are forced into Treasury STRIPS to fund liabilities past 16 years. Treasury STRIPS will certainly match these longer liabilities but come at a high cost. You want to buy longer bonds whose cash flows match the liability benefit payment schedule but at a much lower cost. This requires long coupon bonds which would create a duration mismatch.
Interest rate swaps and futures (derivatives) are another immunization strategy. They are contracts not true assets. There is no cash flow or funds available to make the liability cash flow payments. They are certainly NOT de-risking strategies but hedges vs. the liability growth rate. In fact, these strategies introduce more risk: counter party risk, interest rate risk, non-matching risk of assets purchased (usually equities) vs. liabilities and leverage. In addition, interest rate swaps and futures have all of the problems associated with a liability duration proxy… as listed with duration matching.
Problems with Insurance Buyout Annuities (IBA)
The buyout annuity is certainly the least risky approach to de-risking a pension but it comes at the highest cost. The current trend is to price liabilities at the Treasury STRIPS yield curve and create a single discount rate (i.e. 3.00%) + a fee of around 4%. The plan sponsor would have to transfer assets and funds over to the insurance company such that the plan is fully funded (or even up to 105% funded) at this single discount rate.
The insurance buyout annuity should be more costly than defeasing the plan with Treasury STRIPS which was always considered the high cost de-risking strategy. Defeasance with Treasury STRIPS should also allow an accounting removal of the pension liability debt. Since the primary pension objective is to fund liabilities at low and stable costs, the buyout annuity should be given a second thought before executing. In addition, if the insurance company goes bankrupt there may be a claw back of pension liabilities to the plan sponsor.
Solution: Cash Flow Matching
As stated in the beginning, matching the liability benefit payment schedule (liability cash flow) at the lowest cost is the ideal way to de-risk a pension plan. Ryan ALM spent two years building a liability cash flow matching product, named the Liability Beta Portfolio™ (LBP), as a cost optimization model that matches the liability benefit payment schedule at the lowest cost given the investment policy restrictions of our clients. Based on the same sample benefit payment schedule used above for the buyout annuity vs Treasury defeasance comparison, our LBP model shows a 26.84% funding cost savings vs. the buyout annuity and 26.54% vs. STRIPS! This is a serious funding cost reduction and should be a major consideration of any de-risking strategy. Yes, the LBP model has some credit risk but very small since we are using investment grade bonds only. The funding cost savings + the extra yield vs. liabilities annually (@100 bps) provide a large value-added cushion vs. any credit problems. Since our LBP is matching and funding the liability benefit payment schedule (future values), there is no interest rate risk since future values are not interest rate sensitive.
The funded ratio should dictate the allocation to bonds. A surplus should have a high allocation to bonds matched to liabilities and vice versa for a deficit funded status. Unfortunately, asset allocation did not respond to the surplus status in the 1990s which led to the US pension crisis. I wrote a book “The U.S. Pension Crisis” detailing the causes and solutions of this enormous financial crisis. With funded ratios at 120% to 150% in the 1990s, why didn’t pensions de-risk their plan (cash flow match) and secure this victory? Because pensions were focused on achieving the ROA (return on asset assumption) instead of focusing on the funded ratio and status, they reduced their bond allocations when bond yields went below the ROA… around 1988. Amazingly, instead of increasing their bond allocation in response to a growing funded ratio they reduced it consistently to the lowest bond allocations in modern history by 1999. The equity correction of 2000-02 erased pension surpluses and created severe deficits that most pensions have not recovered from with spiking contribution costs ever since 2000.
Based on the allocation to bonds should determine how much of the liabilities we can cash flow match (i.e. 25% bond allocation could fund the next 10 years of net liabilities). Most current bond allocations are historically low. As a result, you cannot match and de-risk 100% of liabilities with a 25% bond allocation, especially if you have a funded status deficit. Such a 25% allocation could be used to match and de-risk either a % of total net liabilities or net liabilities chronologically… both methods will de-risk the plan gradually. There are advantages for each method.
Since liabilities are funded initially by contributions, using the LBP model to cash flow match net liabilities chronologically may be able to fund more liabilities than you think. Assume that a 25% bond allocation could match the next 10 years of net liability payments chronologically. Based on the Ryan ALM Liability Beta Portfolio™ (LBP) model we show a funding cost savings of about 4% to 6% on cash flow matching the first 10 years of liabilities versus the ASC 715 discount rate (AA corporate zero-coupon bonds). Note that Ryan ALM is one of few vendors who provide the ASC 715 discount rates since 2008. Our discount rates are consistently higher than the Citigroup rates providing a lower present value on liabilities and enhancing funded ratios and balance sheets. Price Waterhouse has been a subscriber to our ASC 715 discount rates since 2008.
Matching liabilities chronologically should also buy time for the non-bond assets (Alpha assets) to perform and outgrow liabilities (as measured by the CLI). Given time (10 years) most non-bond asset classes tend to outperform bonds. Since liabilities behave like bonds there is a high probability that non-bond asset classes should outperform liability growth over an extended time horizon especially at today’s low yield on bonds (i.e. liabilities).
Since the pension liability objective is also a cost focus, cash flow matching a % of total liabilities would produce the optimal funding cost savings since the longer the bond the less it costs given the same future value. Our LBP model is back tested since 2009 showing a cost savings of 8% to 12% on cash flow matching a % of total net liabilities. For every $1 billion in bonds used in our LBP model could save about $100 million in cost savings vs. the ASC 715 present value of liabilities.
Core Bond Portfolio (De-Risk)
Pension consultants and plan sponsors should consider installing a LBP as the core portfolio in asset allocation. This would gradually de-risk the plan and facilitate portable alpha asset allocation. The best value in bonds is their cash flows. Bonds are usually not considered performance assets (Alpha assets) especially vs. pension liabilities which behave like bonds. The P&I performance study has proven for decades that fixed income managers have little or no value added vs. bond index benchmarks (after fees).
Given no change in the bond allocation… replace high fee active bond management with a LBP that will de-risk the plan, reduce funding costs and reduce contribution volatility at a low asset management fee (@ 12 bps). As the Alpha assets (non-bonds) perform vs. liability growth (as measured by the CLI), thereby enhancing the economic funded ratio, such excess returns (liability Alpha) should be transferred over to the Liability Beta Portfolio™ (LBP) to de-risk more and more liabilities… Portable Alpha. Had this portable Alpha discipline been in place during the decade of the 1990s when funded ratios grew to their highest historical levels with true economic surpluses… there would be no U.S. pension crisis today!
Nota Bene (Note Well)
Please note that the definition of risk used in this research report is in sharp contrast to the traditional approach produced by the Nobel Prize winner Ph.D. William F. Sharpe back in 1966. Professor Sharpe proposed that risk is the volatility of total returns and that the three-month T-Bill was the default risk-free rate. He developed the Sharpe Ratio as a means of calculating the risk-adjusted return by subtracting the return of the three-month T-Bill from the mean return of the assets being analyzed and dividing the net return by the volatility of the return of the assets in review. For many decades the Sharpe Ratio was the standard measurement of risk-adjusted returns. In 1994 Prof. Sharpe called me and invited me to Stanford to discuss our unique custom liability index data and index reports. I had the unique pleasure to meet and debate with one of the finest intellects I ever met.
I proposed that risk is not a generic measurement but based on each client’s objective. I referenced pensions where every client’s liabilities are different (like snowflakes). As proof, I asked him what is the risk-free asset for a 10-year liability payment? Prof. Sharpe answered… a 10-year Treasury zero-coupon bond that matches the liability payment with certainty. Prof. Sharpe identified that the three-month T-Bill would have 39 reinvestment moments of uncertainty, so there is no way the three-month T-Bill could match a 10-year liability future value with any certainty and would become a risky asset. Our discussion led to Prof. Sharpe re-inventing the Sharpe Ratio in 1994 to include the benchmark objective instead of the three-month T-Bill in the numerator and denominator such that the average return of the asset portfolio is reduced by the average return of the objective (numerator). This net average return is then divided by the standard deviation of the asset portfolio return vs. the objective return (tracking error). This is commonly called today… the Information Ratio.