
Ryan ALM
White Papers
How Bonds Can Enhance the ROA
Given the volatility and uncertainty of the financial markets, bonds can provide Pension Plan Sponsors a strategy to mitigate some of that volatility. Bonds, through the certainty of their cash...
Source: How Bonds Can Enhance the ROA
Given the volatility and uncertainty of the financial markets, bonds can provide Pension Plan Sponsors a strategy to mitigate some of that volatility. Bonds, through the certainty of their cash flows, prove to be a very effective tool. Most pensions focus on earning the return on asset (ROA) assumption as the goal of asset allocation. Because bonds yield less today than the ROA (7.00% average) the asset allocation to bonds tends to be lower than historic norms. But there exists a bond allocation that could enhance the probability of achieving the ROA. Here’s how:
Cash Flow Matching – if bonds were used to cash flow match and fund net liabilities (after contributions) chronologically they would produce the liquidity needed to fully fund such net liabilities. Cash flow matching works best with longer coupon bonds where you use semi-annual interest income to partially fund liabilities. A 10-year bond has 20 interest cash flows + one principal cash flowall priced at a 10-year yield. Having this liquidity wouldeliminate the need to do a cash sweep from other asset classes which is a common liquidity procedure. According to Guinness Global, the S&P 500 has 47% of its historical returns from dividends and reinvestment since 1940 on a 10-year rolling period basis. Wouldn’t you want to reinvest dividends back into growth assets rather than spend it on funding benefits + expenses? By using bonds as the liquidity assets, the growth assets are left unencumbered to grow. The longer the cash flow matching period, the more time the growth assets have to compound their growth. This strategy and practice could significantly enhance the ROA.
Yield on Bonds – the asset allocation models forecast the return of each asset class in the model, then weight each asset class to get the derived ROA for total assets. The ROA for most asset classes is based on the historical returns of each asset class index benchmark except for bonds. The currentyield on the bond index benchmark(s) is usually used as the forecast for bond returns. The Bloomberg Barclay Aggregate is most favored as the bond index benchmark. This index was designed at Lehman Bros. by Ron Ryan when he was the head of Fixed Income Research & Strategy from 1977 to 1983. The Aggregate is a very large and diversified portfolio of bonds with the following summary statistics as of March 31, 2025:
| # of issues | 13,770 | Treasury | 44.79% | AAA | 3.06% |
| YTM | 4.51% | Agency | 1.29% | AA | 47.86% |
| Duration | 6.08 yrs. | Mtg. Backed | 24.85% | A | 11.38% |
| Avg. Maturity | 8.38 yrs. | Corporates | 24.06% | BBB | 11.43% |
| NR | 25.60% |
As a result, most asset allocation models would have a ROA for bonds of about 4.50%. If you can build a bond portfolio that outyields the Aggregate index, by definition, it should enhance the ROA for total assets. Ryan ALM Advisers, LLC has created a cash flow matching product we call the Liability Beta Portfolio™ (LBP). The LBP is a cost optimization model that cash flow matches liability cash flows chronologically at the lowest cost from a corporate bond portfolio skewed to A/BBB bonds. Based on the actuarial projections of each client we initially build a Custom Liability Index (CLI) to calculate net liabilities ((benefits + expenses) – contributions) chronologically. The CLI provides all the data needed for the LBP to function efficiently. Based on the allocation to the LBP will determine how far out the LBP can fully fund net liabilities. Usually, a 15% allocation to the LBP can fund 1-7 or even 1-10 years of net liabilities. The longer the term structure of the LBP, the higher the yield. The LBP will roughly outyield the Aggregate index by 50 bps (1-5 years) to over 100 bps (1-10 years) based on the LBP term structure. If the LBP outyields the AGG index by 50 to 100 bps, asset allocation can afford to overweight the bond allocation and still meet the target ROA for total assets. A 15% allocation to LBP is 7.5 to 15 bps value added to the ROA.
3.Cash – many pension plans have a cash allocation of around 2%+. Cash is usually the lowest yielding asset. Since the LBP becomes the liquidity assets to fully fund benefits + expenses chronologically, there is little need for cash to fund B+E. Cash might only be needed for capital calls on Private Equity and Alternative Investments. The LBP should significantly increase the yield margin versus cash since the LBP is using A/BBB+ coupon income from all maturities of the LBP. With the LBP fully funding B+E, the cash allocation can be reduced to <1%. Replacing most of the cash allocation to fund B+E with the LBP allocation is another ROA enhancement… it all adds up.
What’s Better For a Pension?
Asset returns are uncertain and very volatile. The S&P 500 is a good example. Since 1990 this index has enjoyed 13 years of 20% + growth. Unfortunately, it was accompanied...
Source: What’s Better For a Pension?
Asset returns are uncertain and very volatile. The S&P 500 is a good example. Since 1990 this index has enjoyed 13 years of 20% + growth. Unfortunately, it was accompanied with several negative return years which brought the average 20 year return down to 9.75%:
The decades of the 2000s began with three negative return years for the S&P 500 as follows:
2000 = (9.03%) 2001 = (11.85%) 2002 = (21.97%)
This combined with a secular decline in interest rates made liability growth spike by 55.12% in those three years (according to the Ryan ALM Liability Index) causing funded ratios to drop significantly by as much as 47%. This brings up the commonsense math… if funded ratios go down about 50%, they need to have assets outgrow liabilities by about 100% to get back to full funding. Since the return on assets (ROA) forecast is not based on the funded status but on the expected return of the plan’s asset allocation, the actuarial projections must make up the funded status deficit by increasing contributions. Most pension plans have experienced spiking contributions costs since 2000 which I proclaimed as the primary impetus for the US pension crisis in my 2013 book (The U.S. Pension Crisis). The uncertainty and volatility of the actual ROA has plagued pensions forever and will continue if this remains the focus of asset allocation.
Since the true objective of a pension is to secure benefits in a cost-efficient manner with prudent risk then asset allocation should be focused on this objective and not an ROA objective, which doesn’t guarantee success. This is best accomplished by bifurcating assets into liquidity (Beta) and growth (Alpha) assets. The liquidity or Beta assets should fully fund the liability cash flows (benefits + expenses) chronologically with certainty for as long as the allocation will cover. We define risk as the uncertainty of achieving the objective. So, the least risky asset strategy is to cash flow match (defease) the liability cash flows with certainty. Depending on the plan’s funded status will dictate the asset allocation between the liquidity and growth assets. The funded status is best measured by the
Asset Exhaustion Test (AET) which compares the annual asset cash flows (including contribution) versus the annual liability cash flows (including benefits + expenses).
Ryan ALM recommends starting with an allocation to liquidity or Beta assets that fully funds the liability cash flows for the next 10 years. Then we run the AET to see what ROA is needed for the residual growth assets to fully fund the residual liability cash flows. If the calculated ROA is lower than the current ROA assumption, you can allocate more to the liquidity assets and vice versa.
The benefits of the Ryan ALM cash flow matching strategy (Liability Beta Portfolio™) are numerous and significant:
Reduces risk (de-risks) by cash flow matching liability cash flows with certainty
No interest rate risk since it is funding future values (B+E liability payments)
Provides timely and proper liquidity to fully fund benefits + expenses (B+E)
AET will calculate proper allocation between liquidity and growth assets
AET will calculate ROA needed to fully fund liability cash flows
Reduces funding costs by about 2% per year (1-10 years = 20%)
Reduces asset management costs (Ryan ALM fee = 15 bps)
Reduces volatility of the funded ratio and contributions
Buys time for the Alpha assets to grow unencumbered
No need for a cash sweep to meetliquidity needs
In summary, a LBP cash flow matching strategy for liquidity assets will reduce funding costs by about 2% per year (1-10 years = 20%) while fully funding the liability cash flows with certainty. This will reduce the volatility of the funded status and allow plan sponsors and their consultants to better plan asset allocation for the growth assets. By eliminating a cash sweep, the growth assets can now reinvest their income and enhance their ROA. So, I ask once again: What is better for a pension plan? A 20% asset gain or a 20% liability cost reduction? It is clearly the cost reduction given the certainty of the outcome!
Pension Strategy to Reduce Funding Costs by 20%+
The true objective of a pension is to secure and fully fund benefits in a cost-efficient manner with prudent risk . It is a liability and cost objective… it is...
Source: Pension Strategy to Reduce Funding Costs by 20%+
The true objective of a pension is to secure and fully fund benefits in a cost-efficient manner with prudent risk. It is a liability and cost objective… it is NOT a return objective! This objective is best accomplished through a cash flow matching strategy where an optimal bond portfolio will fully fund monthly benefits + administrative expenses net of contributions. Bonds are the only asset class with certainty of its cash flows. That is why bonds have been the asset choice to defease liabilities for over 50 years.
Cash flow matching (CFM) used to be called Dedication in the 1970s and 1980s. As the head of Fixed Income Research at Lehman in the 1970s and early 1980s, I was in charge of our Dedication model. When I created my initial firm in 1984 (Ryan Financial Strategy Group), I hired the two professors in charge of Dedication at I.P. Sharpe to build our model. At Ryan ALM, we have rebuilt a CFM model that best fits any liability objective. The Ryan ALM CFM strategy utilizes our proprietary cost optimization model that will fully fund monthly net liabilities and reduce funding costs by about 2% per year. If we CFM 1-10 years of net liabilities, we should be able to reduce funding costs by about 20%, 1-15 years = 30%, etc. In addition to reducing funding costs, CFM has several benefits that should be utilized and recognized. We strongly urge pensions to consider CFM as the core portfolio that best fits the true pension objective and provides many additional benefits as listed below:
Cash Flow Matching – Provides Liquidity
The intrinsic value of bonds is the certainty of their cash flows! If bonds were used to cash flow match and fund net liabilities (benefits - contributions) chronologically they would produce the liquidity needed to fully fund such net liabilities. Cash flow matching works best with longer coupon bonds where you use semi-annual interest income cash flows to partially fund liabilities. A 10-year bond has 20 interest cash flows + one principal cash flow all priced at a 10-year yield. This would eliminate the need to do a cash sweep of other asset classes which is a common liquidity procedure. According to S&P data, the S&P 500 has 48% of its historical returns from dividends and reinvestment since 1940 on a 10-year rolling period basis. Wouldn’t you want to reinvest dividends back into growth assets rather than spend it on funding benefits + expenses? Wouldn’t you want the ROA of growth assets enhanced?
Cash Flow Matching - Provides TIME
Ryan ALM, Inc. released a 2022 research report titled “Most Important Asset of a Pension… Time!”. By using bonds as the liquidity assets, the growth assets are left unencumbered to grow. The longer the cash flow matching period, the more time the growth assets have to compound their growth. This could significantly enhance the ROA. By cash flow matching net liabilities chronologically, Ryan ALM can buy the time a plan sponsor and their consultant feel is necessary for the growth assets to grow unencumbered… and recover from negative return years. When markets correct and go down (i.e. 2022) it may take several years to recover and achieve the average annual target ROA that was assigned to that asset class.
Cash Flow Matching – Provides Inflation Hedge
Ryan ALM released a 2020 research report and pension alert titled “Pension Inflation =/= CPI”. Pension inflation has three parts: a cost of living adjustment (COLA) lives; a salary increase factor for active lives and a forecast of administrative expenses. The COLA may be based on the CPI but with a floor and a cap or even a % of the CPI while the salary and administrative expense increases tend to be quite static @ 3% annual increase. As a result, pension inflation tends to be less volatile and more static than the CPI. The plan sponsor actuary includes pension inflation in their projected benefit + expenses payment schedule for both retired and active lives. This fact suggests clearly that the best way (and only way) to hedge pension inflation is to cash flow match the actuarial projected benefits + expenses. If you cash flow match the actuarial projections, you have defeased liabilities and hedged pension inflation.
Cash Flow Matching – Outyields Benchmark and Bond ROA
The Ryan ALM cash flow matching product (Liability Beta Portfolio or LBP) is heavily skewed to A/BBB corporate bonds while the BB Aggregate is heavily skewed to Government bonds. As a result, the LBP will outyield the BB Aggregate by a significant yield spread… usually 50 – 75 bps, which will enhance the ROA of bonds.
Higher Yields are Good for Cash Flow Matching… and Pensions
Ryan ALM released a topical 2022 research report titled “Why Higher Interest Rates are Good for Pensions”. Pension funds are highly interest rate sensitive! Certainly, fixed income assets are such that the longer their maturity and effective duration, the greater their interest rate sensitivity. But it is pension liabilities that are more interest rate sensitive. Liabilities behave like a 100% zero-coupon bond portfolio because the discount rate(s) chosen price liabilities as zero-coupon bonds. This causes liabilities to be longer in duration then the same maturity(s) coupon bonds. Many discount rates are a yield curve of rates (ASC 715, PPA, PBGC, IASB). As interest rates trend higher, bonds can cash flow match liabilities at lower and lower costs. Note that cash flow matching is focused on funding B + E which are future values. Future values are not interest rate sensitive. Bonds are the only asset class with the certainty of cash flows (future values). That is why bonds have always been used as the methodology for defeasance (cash flow matching) of liabilities. Moreover, if interest rates trend upward any reinvestment of cash flow can buy future value at a lower cost. As a result, cash flow matching sees higher interest rates as an opportunity to reduce funding costs. The Ryan ALM cash flow matching product can reduce funding costs by @ 20% for most pension liabilities out to 10 years. In contrast, bonds used as performance or growth assets could see negative returns… like 2022. Total return performance is not the value in bonds… the certainty of cash flow is the intrinsic value. We urge pensions to transfer their bond allocation from focusing on outperforming some generic bond index to focusing on cash flow matching liabilities chronologically, especially at today’s higher rates.
Reminder: The ROA is Plural… ROAs
Ryan ALM, Inc. released a topical 2022 research report titled “The Pension ROA is plural… ROAs” that details how the ROA is calculated. Each asset class is askby using their index benchmark as the target return proxy. However, for fixed income it is the YIELD of the index benchmark… not the total return like other asset classes. The Bloomberg Barclay Aggregate is most favored as the bond index benchmark. This index and almost all popular bond index benchmarks were designed at Lehman Bros. by me (Ron Ryan) when I was the head of Fixed Income Research & Strategy from 1977 to 1983. Please note… each asset class is NOT required to earn the pension fund ROA assumption (@ 6.50% today). This is an important fact to remember in asset allocation. We at Ryan ALM often hear the criticism and question… how can we invest in 4% bonds to earn our ROA? The answer is bonds do NOT need to earn the pension ROA… just their assigned ROA (yield of index benchmark) in the asset allocation model.
Pension Conundrum - Liquidity Risk
Liquidity is a critical and necessary priority of a pension fund, since it must fund monthly benefits and expenses (B + E) on time. Many plan sponsors use a “cash...
Source: Pension Conundrum - Liquidity Risk
Liquidity is a critical and necessary priority of a pension fund, since it must fund monthly benefits and expenses (B + E) on time. Many plan sponsors use a “cash sweep” or a fixed cash allocation to provide such cash flow. Both strategies are not optimal for a pension plan.
Cash Sweep
A cash sweep usually takes income or cash flow from all asset classes to fund the current monthly B+E. This can severely damage the ROA of such asset classes. According to a research report by Guinness Global found since 1940, dividends and dividends reinvested have accounted for 47% of the S&P 500 total return on a 10-year rolling period and 57% on a 20-year rolling period. So, this data questions the logic of a cash sweep that uses dividends to fund B+E.
As a solution, Ryan ALM recommends that you use a cash flow matching (CFM) strategy to fully fund B+E. Our CFM model will provide timely cash flows that will fully fund B+E at the lowest cost to our clients. The benefits of CFM are quite substantial:
Allows growth (non-liquidity) assets to grow unencumbered. Should enhance their ROA significantly.
CFM buys time. The longer the time, the greater the probability of achieving the ROA for the growth assets.
CFM will provide certainty (barring a default) of cash flows which reduces or eliminates liquidity risk.
CFM is an investment grade portfolio skewed to the longest maturities within the area it is funding (i.e. 1-3 years or 1-5 years) that should enhance the CFM yield versus the yield on cash reserves.
CFM reduces reinvestment risk if interest rates trend downward (as many expect).
Asset Allocation (AA)
Most AA have a cash allocation somewhere between 2% to 5%. Why? Normally you hear it is for liquidity purposes or even diversification. Cash is usually the lowest yielding asset especially when there is a positive sloping yield curve. Due to its very short maturities, cash is usually costing the plan close to a 1:1 cost ratio of present value to future value. The present value of a 3-month T-Bill will be quite close to its future value or a 1:1 ratio. While a CFM portfolio with a 3-year average maturity yielding 4.00% would have a 0.88:1 ratio for a cost reduction = 12%.
As a solution, Ryan ALM recommends separating liquidity assets from growth assets in asset allocation. Let bonds in a CFM strategy be your liquidity assets for the advantages mentioned above. A CFM strategy will have a longer average duration than cash thereby reducing the cost ratio. In this way the liquidity assets and the growth assets are a team that will produce the optimal solutions:
Enhance ROA by eliminating a cash sweep so growth assets grow unencumbered.
Reduce or eliminate liquidity risk by fully funding B+E monthly with certainty.
Enhance the ROA by outyielding cash
Reduce funding costs
Things To Ask Your LDI Manager
LDI is the acronym for Liability Driven Investment. It is better explained as Asset Liability Management which we promote at Ryan ALM. It has developed into two main strategies either...
Source: Things To Ask Your LDI Manager
LDI is the acronym for Liability Driven Investment. It is better explained as Asset Liability Management which we promote at Ryan ALM. It has developed into two main strategies either to fund liabilities through cash flow matching or to immunize the interest rate sensitivity of liabilities through duration matching. Below is a short list of questions we urge plan sponsors and pension consultants to ask to any LDI prospective asset manager. Please call us for more LDI guidance.
Are you a Duration Matching (DM) or a Cash Flow Matching (CFM)manager?
If Duration Matching… ask these questions:
What is the source of your liability duration calculation? (Actuaries usually do not provide such calculation)
What is the discount rate(s) you use for your duration calculation? Is it a single rate? (ASC 715 is best for accurate market value calculation which is a AA corporate yield curve)
Are you using an average duration, key rates, or matches along the yield curve?
Do you match total liabilities including those past 30 years?
How often do you rebalance?
Do you make or fund the liability payments (benefits + expenses)? (Most DM managers are not term structure matched so not aligned to pay liabilities)
If Cash Flow Matching… ask these questions:
What liabilities are you funding? Gross or Net?
How are you funding the annual actuarial projected liability cash flows?
How much of a funding cost savings do you expect to realize? (Major CFM benefit is the funding cost savings: FV of liabilities – PV of CFM = about 2% per year which is achieved as soon as the CFM portfolio is built)
How do you fund liabilities past 30 years?
How many years of experience do you have with CFM? (CFM may be the oldest LDI strategy starting with Dedication in the 1970s)
As our name implies, Ryan ALM Advisers is dedicated to Asset Liability Management specializing in Cash Flow Matching… our only LDI product. We strongly feel that CFM best fits any liability objective including Pensions, OPEB, Lotteries, NDA, and E&F. Our team has over 168 years of experience dating back to the 1970s with Dedication models. Our CFM product is called the Liability Beta Portfolio™ which will fully fund monthly net liabilities at a funding cost savings of about 2% per year (40% on 1-20 years of liabilities). We can fully fund and CFM up to 30 years with certainty. This term structure monthly cash flow matching approach also provides the best duration matching as each monthly liability payment is fully funded and duration matched. After 30 years we are compatible and synergistic with any derivative strategy a plan sponsor may want to use.
The Smartest Beta
The term “beta” is credited to William F. Sharpe, Ph.D. in his 1964 work in development of the “Capital Asset Pricing Model (CAPM)”. It means (1) the covariance of the...
Source: The Smartest Beta
The term “beta” is credited to William F. Sharpe, Ph.D. in his 1964 work in development of the “Capital Asset Pricing Model (CAPM)”. It means (1) the covariance of the return on a security or portfolio with that of the market portfolio divided by (2) the variance of the return on the market portfolio. Professor Sharpe originally called this “market sensitivity” since you are comparing an investment to the market as defined by a market index. A beta of 1.0 suggests you have no residual risk in that you match the risk/reward behavior of the market index you are being compared against. Ideally, a market index fund should consistently have a market beta of 1.0.
Beta is a measurement based on a market or objective index. Without the index benchmark there is no applicable beta calculation. Traditionally, this has been the popular index benchmarks (i.e. S&P 500, Lehman Aggregate, etc.) but in truth it can be any index that best represents the objective of such funds (i.e. ETFs, index funds). Back in 1964 there was the absence of market indexes so beta was limited mainly to a measurement versus the S&P 500. The first bond index was introduced by Kuhn Loeb in 1973 (merged into Lehman in 1977). Since the advent of ETFs in 1993 there has been numerous new indexes created to feed the explosive growth of ETFs. Such new indexes are the stated objective of these many new ETFs.
Smart Beta
Smart beta is the optimization of the risk/reward behavior of a market index usually by changing the weights. Popular smart beta weighting schemes have been: fundamental weighting, equal-weighting, risk-clusters, and diversity weighting (combines equal and cap weighting). By changing the weights methodology the goal is to enhance returns or reduce volatility or both. Smart beta products have grown well in a short period of time but for the most part are still equity index derivatives. Rob Arnott and Research Affiliates, LLC have been a leader here introducing fundamental weighting for both bond and stock indexes as risk/reward value-added.
There is debate as to whether changing the weight methodology of a market index is really active management or an alpha strategy rather than a beta strategy or discipline. My recommendation is that the objective decides what is beta and alpha. What is important is to have the objective defined by a rules based index. If this reweighted index is the stated objective of an ETF, mutual fund or client then beta is the portfolio that matches the risk/reward of this objective index version. It also follows that alpha is the excess return versus this modified index objective. All comparisons to the traditional generic market index are just good information to know but do not determine the alpha and beta calculations.
Liability Beta Portfolio (The Smartest Beta)
The “smartest beta” portfolio is the portfolio that best matches and achieves the true client objective with the least amount of risk and cost. Risk is best measured as the uncertainty of achieving the objective. Cost is the amount required to fund the objective. The true objective of most institutions and even individuals is some type of liability (annuities, banks, insurance, lotteries, NDT, OPEB, pensions, etc.). The absolute level of volatility of returns is not risk given a liability objective. Indeed a 10-year liability payment is best matched and funded (defeased) by a 10-year Treasury STRIPS which has a certain future value. A three month T-bill would be very risky given this liability objective as it has 39 reinvestment moments of uncertainty. Although the 10-year Treasury STRIPS would be much more volatile in returns, such a return pattern would match the present value behavior of the 10-year liability and thus be low risk or even risk-free (defeasance).
Given a liability objective it is critical to create a custom liability index (CLI) as the proper benchmark. It must be a custom index since liabilities are like snowflakes… you will never find two alike. The CLI is a portfolio of liability payments weighted by the schedule of payments (term structure). Most institutional liabilities are calculated by actuaries who produce an actuarial projection of the liability payment schedule for each client. As such, the CLI is weighted by the actuarial projection in present value dollars. To calculate the present value of each liability payment you need to price liabilities based on a yield curve of discount rates. Depending on the type of liability there are accounting rules (ASC, FASB, GASB, IASB, PPA, etc.) that dictate the discount rate methodology.
Most, if not all, liabilities are priced as zero-coupon bonds since they produce a certain future value. Using U.S. corporate pensions, as an example, they are regulated by ASC 715 (formerly FAS 158) for GAAP accounting purposes. These rules suggest pricing liabilities as if they were AA corporate zero-coupon bonds. Since such bonds are not available in the bond market, they have to be manufactured as hypothetical zero-coupon bonds. As a result, liabilities behave like a yield curve of zero-coupon bonds weighted by the actuarial projections. This means that pension liabilities are extremely interest rate sensitive.
The CLI should calculate all of the necessary statistics to maintain and monitor a liability beta portfolio: term structure weights, total present value, YTM, duration, growth rate, interest rate sensitivity. The CLI is also the proper benchmark to measure liability alpha. If equity assets outperform the S&P 500 but underperform the CLI growth rate… did you earn alpha? In the eyes of the client you lost to liability growth which will damage the funded ratio (assets/liabilities), credit rating and increase contribution cost. Liability alpha is the excess return versus the CLI return (growth rate) and not versus a market index return. Based on Ryan ALM indexes, liability YTD returns through November 30 should be between 12.7% (10-year duration) and 22.2% (15-year duration). Hard to believe that any pension has earned liability alpha so far in 2014.
The key point here is that the client objective is truly the focus and determinant of relative risk and reward (beta and alpha). The client objective is to fund liabilities in such a way that risk and cost are reduced and stable over a long horizon. Given a long average life (duration) based on the liability payment schedule then the liability beta portfolio needs to match these term structure weights. An S&P 500 index fund or any generic market index fund could never represent the beta portfolio for a liability driven objective. Cash or a money market fund is a very risky investment for most liability objectives that have long average lives (duration).
The most appropriate and smartest beta portfolio is the one that matches the liabilities cash flow as measured by the CLI. In essence, the smartest beta portfolio is a custom liability index fund. Such a portfolio should be the core portfolio for any liability objective. By matching the liability term structure the uncertainty risk of matching liabilities is eliminated and interest rate sensitivity is neutralized. By matching the liability term structure with bonds that have higher yields and lower present values (price) than the discount rates used… you have reduced costs. Since the accounting rules (ASC 715, IASB, and PPA) use AA zero-coupon discount rates then a liability beta portfolio of A and BBB will produce higher yields and lower costs. This should provide significant cost savings of 10% to 15%. This matching process is called cash flow matching. Beware of duration matching strategies (i.e. immunization) which do not match the liability cash flows but just the average duration. This is not an accurate or cost effective way to match liabilities. The smartest beta portfolio is a liability cash flow matched portfolio!
Ryan ALM, Inc. Celebrates 20th Anniversary
Ryan ALM, Inc. Celebrates 20 th Anniversary Mission: Protecting and Preserving Pensions Ryan ALM, Inc. was incorporated in Delaware on June 15, 2004. Ronald J, Ryan, founder, says that “we...
Source: Ryan ALM, Inc. Celebrates 20th Anniversary
Ryan ALM, Inc. Celebrates 20th Anniversary Mission: Protecting and Preserving Pensions
Ryan ALM, Inc. was incorporated in Delaware on June 15, 2004. Ronald J, Ryan, founder, says that “we created our company to be dedicated to asset liability management (ALM) as our name suggests. We are quite proud of our progress and achievements in ALM. We have built a turnkey system of products that are quite unique in the ALM industry that we treat as assets shown on our balance sheet, to include:
Custom Liability Index (CLI) – assets need to know what they are funding. Usually, it is monthly net liabilities (benefits + expenses – contributions). Such net liabilities are based on actuarial projections even though actuaries do not calculate net liabilities. The CLI is the proper benchmark for all LDI and ALM objectives. The CLI performs numerous calculations including present values, duration, growth rates, interest rate sensitivity, YTM, etc.
ASC 715 Discount Rates – Ryan ALM is one of few vendors providing ASC 715 discount rates in conformity to FASB. We produce four unique yield curves of AA zero-coupon corporate bonds. Usually, our discount rates are higher than our competitors providing for lower liability valuations and enhanced balance sheets.
Liability Beta Portfolio™ (LBP) – our asset management division, Ryan ALM Advisers, LLC, is entirely focused on cash flow matching as our only ALM product we call LBP. We feel strongly that our LBP provides the most benefits in harmony with the true pension objective of funding liabilities in a cost-efficient manner with prudent risk. Our LBP matches and funds monthly liability cash flows with certainty while reducing funding costs by 2% per year (20% on 1-10 year liabilities). Our LBP will outyield the CLI and enhance the ROA for bonds.
Performance Attribution Report (PAR) – given our CLI, we can calculate the relative risk/reward behavior of assets (as measured by our LBP) versus liabilities (as measured by the CLI). PAR calculates 14 risk/reward measurements including two graphs to clearly show the value added (or lost) of assets versus liabilities. This should be critical information for consultants and plan sponsors to understand how well the plan is being funded.
Asset Exhaustion Test (AET) – assets need to know the hurdle rate or ROA needed to fully fund net liabilities. The current ROA most pensions use is not an accurate calculation of a hurdle rate. Our AET clearly shows the annual difference of asset cash flows versus liability cash flows. We calculate a matrix of ROAs to arrive at the most applicable target ROA. Usually our calculated ROA (AET) is much different and lower than the current ROA since we focus on net liabilities not gross liabilities which reduces the liability cash flows assets need to fund (perhaps significantly).
We are very proud of our synergistic system and thankful for our team of experts with over 168 years of experience. Ryan ALM remains dedicated to achieving the true pension objective of funding liabilities with low cost and low risk.”
Magnificent 7: Caveat Emptor!
As pension watchdogs, Ryan ALM is always interested and concerned about trends that may affect the funded status of pensions. Since the major asset holding of most pensions is the...
Source: Magnificent 7: Caveat Emptor!
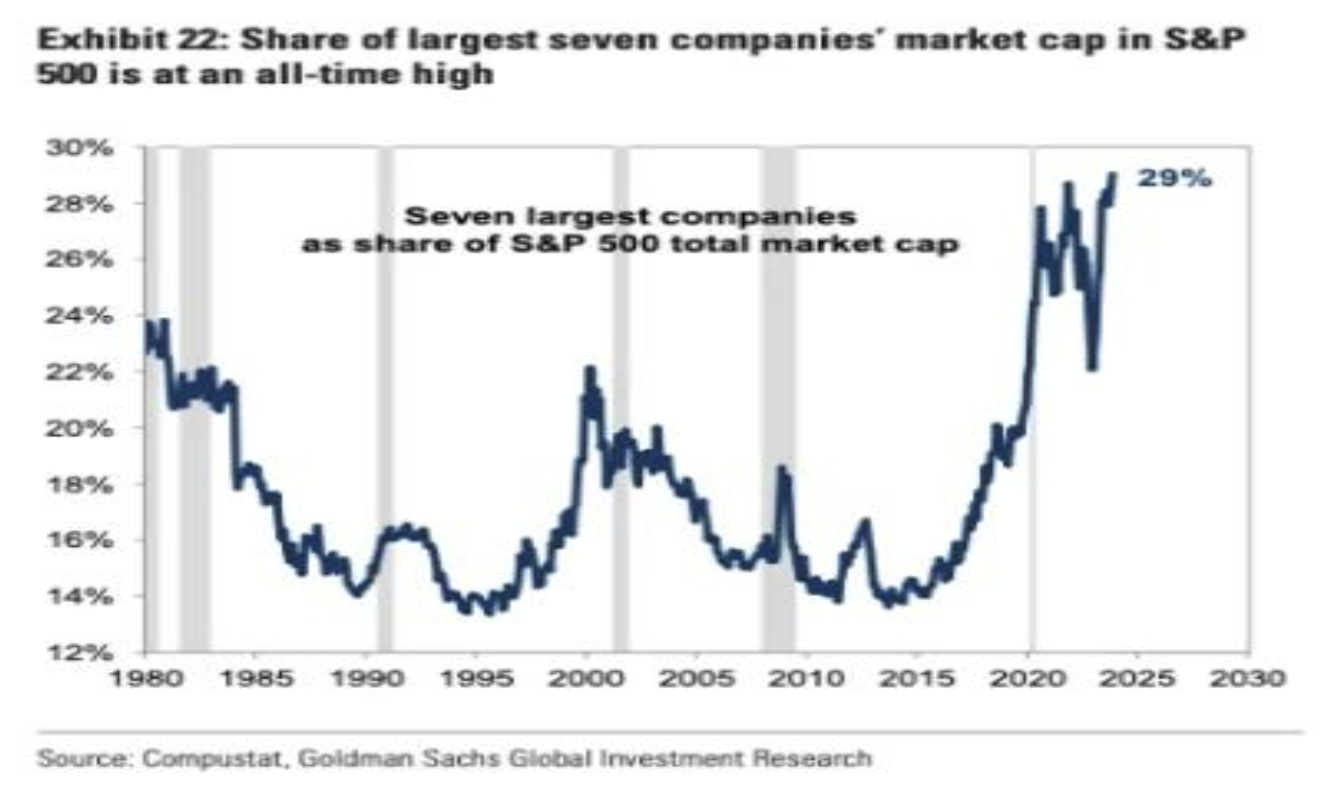
As pension watchdogs, Ryan ALM is always interested and concerned about trends that may affect the funded status of pensions. Since the major asset holding of most pensions is the S&P 500, we are on the alert for anything that may affect this valuable asset. I recently attended a CFA dinner where Rob Arnott, founder and chairman of Research Affiliates a subdivision of PIMCO was the guest speaker. Rob is quite articulate and brilliant on his assessments and forecasts. He was concerned about the valuation of the Magnificent 7 and thought the P/E multiples may not be sustainable. I share Rob’s concerns for the following reasons.
Apple became the first $3 trillion market valuation in America’s history. The seven largest capitalized technology stocks (i.e. the Magnificent 7) have been the main driver of returns for the S&P 500 for several years and certainly in 2023 YTD. As of December 1, this group had a total return = 98.79% based on the Bloomberg Magnificent Seven equal weighted index. At the same time the S&P 500 has a YTD return of 20.96%. According to BOA Global Investment Research, the Mag 7 account for 29.6% of the S&P 500 market capitalization. The newly released Bloomberg Large Cap index without the Magnificent 7 (B500XM7T) posted a YTD return of 7.6% which is 36.4% of the YTD S&P 500 return of 20.96%. This means that the Mag 7 has a YTD weighted group return of 13.33% which accounts for 63.6% of the S&P 500 YTD return (as of 12/01/23).
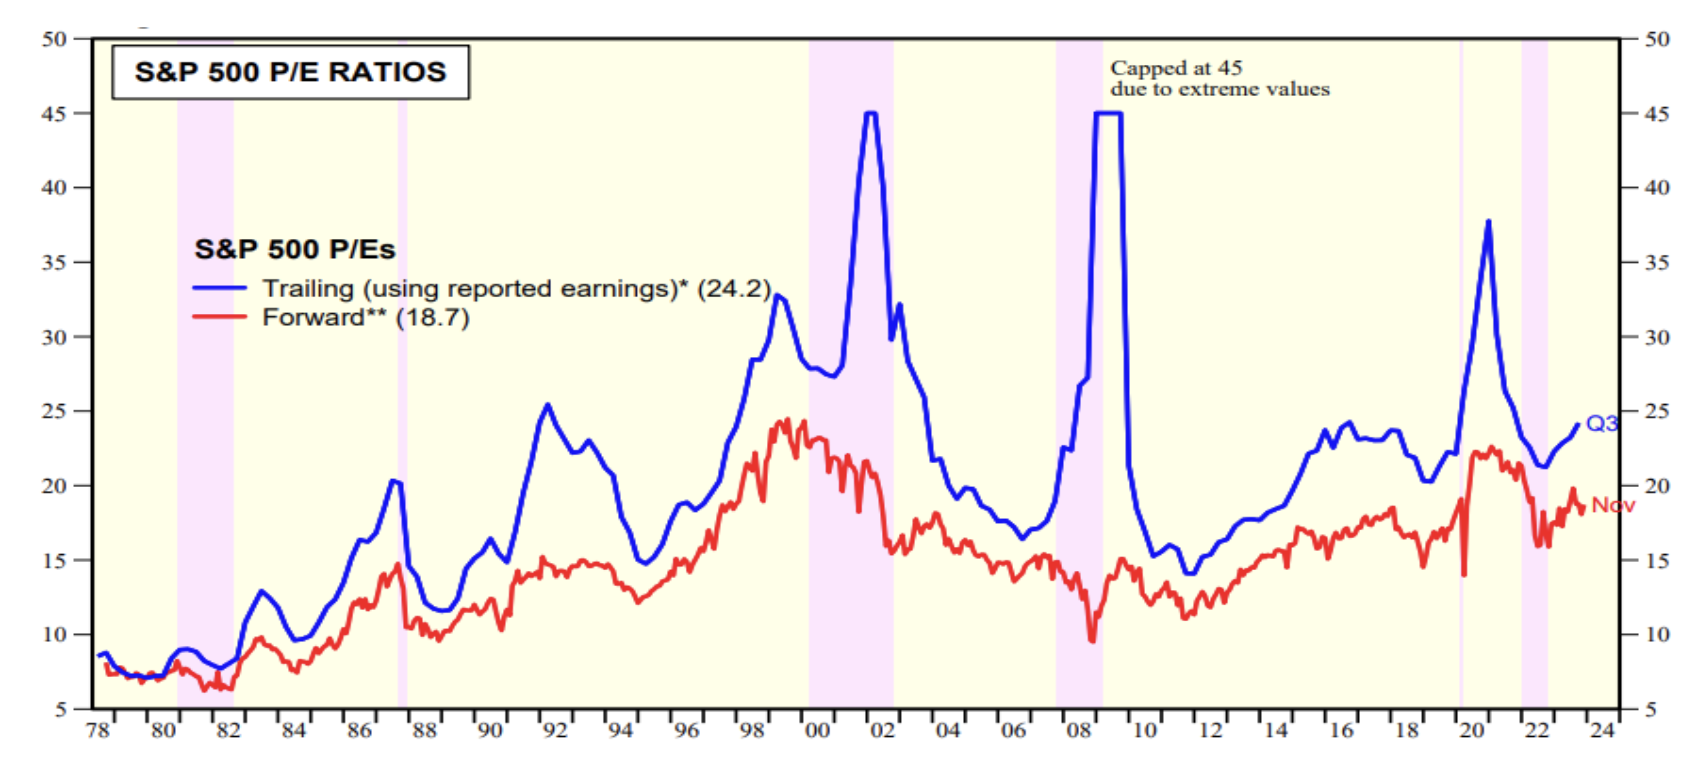
The Mag 7 should continue to grow well given their product line, market share, higher sales growth, higher margins, strong balance sheet and greater re-investment ratio in their market. The main question is one of valuation. Although it may be hard to assess a proper P/E multiple for each of the Mag 7, the wide array of P/E multiples and comparison to the market seem quite overvalued… S&P 500 multiple = 24.2x current and 18.7x forward (source: Yardeni). Tesla at 76.9x current/61.7x forward seems hard to justify especially with earnings growth of -6.1% over the last 12 months. Alphabet, Apple, Meta and even Microsoft trailing 12 months EPS growth do not seem robust enough to merit their valuation either.
| Stock Symbol | Company | PE current | PE forward | Market Capitalization | EPS Growth 5-year Avg. | EPS Growth Last 12 mos. |
|---|---|---|---|---|---|---|
| GOOG | Alphabet | 25.38x | 19.80x | $1.66 trillion | 25.4% | 3.4% |
| AMZN | Amazon | 76.69x | 41.03x | $1.52t | 63.0% | 74.1% |
| AAPL | Apple | 31.55x | 27.16 | $3.01t | 14.4% | 0.3% |
| META | META | 28.10x | 18.17x | $0.82t | 8.9% | 3.1% |
| MSFT | Microsoft | 36.08x | 28.76x | $2.77t | 18.4% | 10.5% |
| NVDA | Nvidia | 61.48x | 22.61x | $1.15t | 27.7% | 264.5% |
| TSLA | Tesla | 76.87x | 61.72x | $0.76t | 40.5% | -6.1% |
| S&P 500 | 24.2x | 18.7x | $37.7t |
Goldman Sachs Global Investment Research is forecasting a 6% growth for 2024 for the S&P 500. This does not validate the P/E multiples of the S&P 500.
“Investors should be skeptical of history-based models. Beware of geeks bearing formulas”
Warren Buffett