
Ryan ALM
White Papers
Things To Ask Your LDI Manager
LDI is the acronym for Liability Driven Investment. It is better explained as Asset Liability Management which we promote at Ryan ALM. It has developed into two main strategies either...
Source: Things To Ask Your LDI Manager
LDI is the acronym for Liability Driven Investment. It is better explained as Asset Liability Management which we promote at Ryan ALM. It has developed into two main strategies either to fund liabilities through cash flow matching or to immunize the interest rate sensitivity of liabilities through duration matching. Below is a short list of questions we urge plan sponsors and pension consultants to ask to any LDI prospective asset manager. Please call us for more LDI guidance.
Are you a Duration Matching (DM) or a Cash Flow Matching (CFM)manager?
If Duration Matching… ask these questions:
What is the source of your liability duration calculation? (Actuaries usually do not provide such calculation)
What is the discount rate(s) you use for your duration calculation? Is it a single rate? (ASC 715 is best for accurate market value calculation which is a AA corporate yield curve)
Are you using an average duration, key rates, or matches along the yield curve?
Do you match total liabilities including those past 30 years?
How often do you rebalance?
Do you make or fund the liability payments (benefits + expenses)? (Most DM managers are not term structure matched so not aligned to pay liabilities)
If Cash Flow Matching… ask these questions:
What liabilities are you funding? Gross or Net?
How are you funding the annual actuarial projected liability cash flows?
How much of a funding cost savings do you expect to realize? (Major CFM benefit is the funding cost savings: FV of liabilities – PV of CFM = about 2% per year which is achieved as soon as the CFM portfolio is built)
How do you fund liabilities past 30 years?
How many years of experience do you have with CFM? (CFM may be the oldest LDI strategy starting with Dedication in the 1970s)
As our name implies, Ryan ALM Advisers is dedicated to Asset Liability Management specializing in Cash Flow Matching… our only LDI product. We strongly feel that CFM best fits any liability objective including Pensions, OPEB, Lotteries, NDA, and E&F. Our team has over 168 years of experience dating back to the 1970s with Dedication models. Our CFM product is called the Liability Beta Portfolio™ which will fully fund monthly net liabilities at a funding cost savings of about 2% per year (40% on 1-20 years of liabilities). We can fully fund and CFM up to 30 years with certainty. This term structure monthly cash flow matching approach also provides the best duration matching as each monthly liability payment is fully funded and duration matched. After 30 years we are compatible and synergistic with any derivative strategy a plan sponsor may want to use.
The Smartest Beta
The term “beta” is credited to William F. Sharpe, Ph.D. in his 1964 work in development of the “Capital Asset Pricing Model (CAPM)”. It means (1) the covariance of the...
Source: The Smartest Beta
The term “beta” is credited to William F. Sharpe, Ph.D. in his 1964 work in development of the “Capital Asset Pricing Model (CAPM)”. It means (1) the covariance of the return on a security or portfolio with that of the market portfolio divided by (2) the variance of the return on the market portfolio. Professor Sharpe originally called this “market sensitivity” since you are comparing an investment to the market as defined by a market index. A beta of 1.0 suggests you have no residual risk in that you match the risk/reward behavior of the market index you are being compared against. Ideally, a market index fund should consistently have a market beta of 1.0.
Beta is a measurement based on a market or objective index. Without the index benchmark there is no applicable beta calculation. Traditionally, this has been the popular index benchmarks (i.e. S&P 500, Lehman Aggregate, etc.) but in truth it can be any index that best represents the objective of such funds (i.e. ETFs, index funds). Back in 1964 there was the absence of market indexes so beta was limited mainly to a measurement versus the S&P 500. The first bond index was introduced by Kuhn Loeb in 1973 (merged into Lehman in 1977). Since the advent of ETFs in 1993 there has been numerous new indexes created to feed the explosive growth of ETFs. Such new indexes are the stated objective of these many new ETFs.
Smart Beta
Smart beta is the optimization of the risk/reward behavior of a market index usually by changing the weights. Popular smart beta weighting schemes have been: fundamental weighting, equal-weighting, risk-clusters, and diversity weighting (combines equal and cap weighting). By changing the weights methodology the goal is to enhance returns or reduce volatility or both. Smart beta products have grown well in a short period of time but for the most part are still equity index derivatives. Rob Arnott and Research Affiliates, LLC have been a leader here introducing fundamental weighting for both bond and stock indexes as risk/reward value-added.
There is debate as to whether changing the weight methodology of a market index is really active management or an alpha strategy rather than a beta strategy or discipline. My recommendation is that the objective decides what is beta and alpha. What is important is to have the objective defined by a rules based index. If this reweighted index is the stated objective of an ETF, mutual fund or client then beta is the portfolio that matches the risk/reward of this objective index version. It also follows that alpha is the excess return versus this modified index objective. All comparisons to the traditional generic market index are just good information to know but do not determine the alpha and beta calculations.
Liability Beta Portfolio (The Smartest Beta)
The “smartest beta” portfolio is the portfolio that best matches and achieves the true client objective with the least amount of risk and cost. Risk is best measured as the uncertainty of achieving the objective. Cost is the amount required to fund the objective. The true objective of most institutions and even individuals is some type of liability (annuities, banks, insurance, lotteries, NDT, OPEB, pensions, etc.). The absolute level of volatility of returns is not risk given a liability objective. Indeed a 10-year liability payment is best matched and funded (defeased) by a 10-year Treasury STRIPS which has a certain future value. A three month T-bill would be very risky given this liability objective as it has 39 reinvestment moments of uncertainty. Although the 10-year Treasury STRIPS would be much more volatile in returns, such a return pattern would match the present value behavior of the 10-year liability and thus be low risk or even risk-free (defeasance).
Given a liability objective it is critical to create a custom liability index (CLI) as the proper benchmark. It must be a custom index since liabilities are like snowflakes… you will never find two alike. The CLI is a portfolio of liability payments weighted by the schedule of payments (term structure). Most institutional liabilities are calculated by actuaries who produce an actuarial projection of the liability payment schedule for each client. As such, the CLI is weighted by the actuarial projection in present value dollars. To calculate the present value of each liability payment you need to price liabilities based on a yield curve of discount rates. Depending on the type of liability there are accounting rules (ASC, FASB, GASB, IASB, PPA, etc.) that dictate the discount rate methodology.
Most, if not all, liabilities are priced as zero-coupon bonds since they produce a certain future value. Using U.S. corporate pensions, as an example, they are regulated by ASC 715 (formerly FAS 158) for GAAP accounting purposes. These rules suggest pricing liabilities as if they were AA corporate zero-coupon bonds. Since such bonds are not available in the bond market, they have to be manufactured as hypothetical zero-coupon bonds. As a result, liabilities behave like a yield curve of zero-coupon bonds weighted by the actuarial projections. This means that pension liabilities are extremely interest rate sensitive.
The CLI should calculate all of the necessary statistics to maintain and monitor a liability beta portfolio: term structure weights, total present value, YTM, duration, growth rate, interest rate sensitivity. The CLI is also the proper benchmark to measure liability alpha. If equity assets outperform the S&P 500 but underperform the CLI growth rate… did you earn alpha? In the eyes of the client you lost to liability growth which will damage the funded ratio (assets/liabilities), credit rating and increase contribution cost. Liability alpha is the excess return versus the CLI return (growth rate) and not versus a market index return. Based on Ryan ALM indexes, liability YTD returns through November 30 should be between 12.7% (10-year duration) and 22.2% (15-year duration). Hard to believe that any pension has earned liability alpha so far in 2014.
The key point here is that the client objective is truly the focus and determinant of relative risk and reward (beta and alpha). The client objective is to fund liabilities in such a way that risk and cost are reduced and stable over a long horizon. Given a long average life (duration) based on the liability payment schedule then the liability beta portfolio needs to match these term structure weights. An S&P 500 index fund or any generic market index fund could never represent the beta portfolio for a liability driven objective. Cash or a money market fund is a very risky investment for most liability objectives that have long average lives (duration).
The most appropriate and smartest beta portfolio is the one that matches the liabilities cash flow as measured by the CLI. In essence, the smartest beta portfolio is a custom liability index fund. Such a portfolio should be the core portfolio for any liability objective. By matching the liability term structure the uncertainty risk of matching liabilities is eliminated and interest rate sensitivity is neutralized. By matching the liability term structure with bonds that have higher yields and lower present values (price) than the discount rates used… you have reduced costs. Since the accounting rules (ASC 715, IASB, and PPA) use AA zero-coupon discount rates then a liability beta portfolio of A and BBB will produce higher yields and lower costs. This should provide significant cost savings of 10% to 15%. This matching process is called cash flow matching. Beware of duration matching strategies (i.e. immunization) which do not match the liability cash flows but just the average duration. This is not an accurate or cost effective way to match liabilities. The smartest beta portfolio is a liability cash flow matched portfolio!
Pension Confusion - Find the Liabilities
Securing and funding liabilities in a cost-efficient manner with prudent risk is the true pension objective. Although liabilities should be the focus of pensions, it is hard to find liabilities...
Source: Pension Confusion - Find the Liabilities
Securing and funding liabilities in a cost-efficient manner with prudent risk is the true pension objective. Although liabilities should be the focus of pensions, it is hard to find liabilities in asset allocation, asset management and performance measurement… especially forPublic and Multiemployer Plans,as theseplans are asset only focused. Private plans are very much liability driven although they have opted out of pensions to buy Insurance BuyOut annuities as a major trend for over ten years.Given the 500 bps increase in the Fed Funds rate in the last two years, Private plans need to revisit the economics of BuyOut annuities versus a defeasance strategy (cash flow matching). I think they may find that a defeasance strategy has definite cost advantages today.
So, what’s the matter? There is an obvious disconnect between assets and liabilities because liabilities are missing from every critical asset function:
Asset Allocation (AA)
Liabilities are like snowflakes, you never find two alikeas each pension plan has a different labor force, salaries, mortality and plan amendments. There can never be a generic market index to replicate any plan sponsor’s unique liability cash flows. Liabilities are the domain of the actuary. They produce a very thorough annual report detailing and itemizing numerous liability calculations. The actuaries do an amazing job given the huge number of calculations. They have a tedious and most important function as the calculator and custodian of the liabilities. This voluminous work is usually presented as an annual report a few months after the end of the fiscal year. More importantly, the actuary calculates the funded status which should be the focus of asset allocation, asset management, and performance measurement.
Most pension asset allocations are based on earning a target ROA or hurdle rate. The ROA is calculated by weighing the expected return for a series of asset classes. Each asset class has its own ROA based on its index benchmark estimated return. Pension consultants are quite diligent in analyzing each asset class and assigning the proper weight to achieve the target ROA and risk behavior. Thorough quarterly reports are presented by the consultants to plan sponsors detailing the risk/reward of every asset manager versus the index benchmark assigned to that asset class as the bogey. As a result, generic market indexes are the driver and focus of asset allocation.
AA should be responsive to the funded status of each client. A 90% funded plan should have a much more conservative AA than a 60% funded plan. But most, if not all, asset allocation models ignore the funded status and focus on achieving the target ROA with the highest probability of success and prudent risk based on historical returns of a database that is almost 100% generic market indexes. The historical risk/reward behavior of numerous generic market indexes are
inputs into an AA optimization model that provides a baseline allocation of each asset class. The pension consultant will then massage those weights to best fit each client. Too often plan sponsors have similar asset allocations no matter what their funded status is because they have similar ROA targets. This has led to inappropriate AA especially in the late 1990s and early 2000s that were heavily skewed to risky assets although the pension plans were greatly overfunded then. Had pensions defeased their liabilities then through a cash flow matching strategy with investment grade bonds, they could have secured their surplus victory and stabilized low contribution costs. Instead, the equity correction of 2000-02 wrecked the funded status of almost all pensions causing spiking contribution costs which have not subsided even today.
Without knowledge of the economic funded status on a frequent and accurate basis, AA cannot function effectively. If the market value of assets is the most accurate measurement of asset valuation then the same is true for liabilities. The Society of Actuaries (SoA) delivered a research paper “Principles Underlying Asset Liability Management (ALM)” years ago that warns of erroneous accounting valuations and recommends that pensions create a set of economic books:
“A consistent ALM structure can only be achieved for economic objectives. Accounting measures can sometimes distort economic reality and produce results inconsistent with economic value. Because ALM is concerned with the future asset and liability cash flows, the natural focus of ALM is economic value.”
Ryan ALM Translation: Pension plans need to create a set of “economic books” so ALM can function effectively. It’s all about asset cash flows funding liability cash flows. A Custom Liability Index (CLI) is the method and proper benchmark to create economic books.
With a CLI in place, consultants and plan sponsors can now know monthly the true economic funded status and liability growth rate. With a CLI, consultants now possess pertinent and private information for each of their clients that no other consultant would have…. a significant advantage over competition. The CLI allows consultants to now customize the AA to best fit the clients dynamic funded status with timely adjustments. Although the actuaries don’t produce a CLI, it is based on the private actuarial projections of benefits, administrative expenses and contributions. Ron Ryan and his team created the first CLI in 1991 as the true benchmark of a pension. The Ryan ALM CLI provides all of the calculations needed for efficient AA, ALM, and performance measurement.
Asset Liability Management (ALM)
It would be hard, if not impossible, for an asset manager to manage assets versus a generic market index if it came out annually, months after the end of the fiscal year with no transparency (index constituents not shown) and it wasn’t priced at the market. Well welcome to the pension world of liabilities. Liabilities are an annual actuarial calculation that has little or no transparency (projections usually not shown) and is priced at the ROA (GASB) as the discount rate. The ROA discount rate is certainly not a market rate you can buy to settle the liabilities. The ROA discount rate is one of the accounting distortions of economic reality the SoA referenced.
This was the message from the SoA. You need to create a set of economic books for ALM to function effectively. This is why a CLI is the critical step in ALM. Assets need to know what they are funding. The answer is usually net liabilities defined as (benefits + expenses) – (contributions) since contributions are the first source to fund the liability cash flows. Because net liabilities are not calculated in the actuarial report, the CLI should be a requirement to understand the net liability cash flows that asset cash flows must fund. Such net liability cash flows are also monthly which is another calculation made by the CLI.
If the true pension objective is to secure benefits in a cost-efficient manner with prudent risk, then cash flow matching (CFM) must be the proper and best ALM strategy. CFM used to be called dedication and has been a stable approach to pension investing for over 50 years. Bonds are the only asset class with the certainty of its cash flows. That is the intrinsic value in bonds and the reason why CFM should be the core portfolio of any pension. As the funded ratio improves, a higher allocation should be given to CFM to secure more and more benefits while stabilizing the funded ratio and contributions.
Performance Measurement
Once the CLI is in place, it will provide monthly calculations of the net liability growth rate (returns). Total asset growth (returns) versus the total net liability growth rate is the critical performance measurement. If all of the asset managers outperformed their generic market index benchmarks but total asset growth underperformed total net liability growth rate… the plan loses. This lost shows up in higher pension expense (contribution costs) and a lower funded status.
With a liability objective, the terms Alpha and Beta now take on a different perspective. Liability Alpha is the excess return of asset growth rate versus the liability growth rate. Liability Beta is now the portfolio that matches the liability cash flows it is funding. With the CLI, liability Beta is now a Liability Index Fund. Without a CLI, performance measurement is comparing assets versus assets… this is in sharp contrast to the pension objective of assets versus liabilities.
Pension Confusion - The Problem with Averages
Pension Confusion: The Problem with Averages Most pension have assets managed to generic market index benchmarks and/or liabilities. In both cases, the focus of these assets is to match or...
Source: Pension Confusion - The Problem with Averages
Pension Confusion:
The Problem with Averages
Most pension have assets managed to generic market index benchmarks and/or liabilities. In both cases, the focus of these assets is to match or beat some average (i.e., duration, total return, YTM). Unfortunately, few understand how these averages can be misleading if not erroneous.
Liabilities (Duration Matching)
Duration matching is a common LDI strategy for pensions where the plan sponsor looks to immunize their bond portfolio versus the interest rate sensitivity of the liabilities they are funding. To achieve this interest rate immunization, the strategy is to match the average duration of the liabilities. There are at least four problems here:
The actuary does not provide the average duration of projected benefits.
The actuarial report usually comes out annually… months after the fiscal year. Duration is a present value calculation that changes with interest rates and time, both of which change daily.
Assets do not fund gross projected benefits. They fund net benefits after contributions. This net liability is not calculated by the actuary which can be much different than the gross liability in dollars and duration especially for Corporate and Public pension plans that have a high contribution rate. Pension assets need to know what they are funding. The economic reality is… assets are funding net liabilities after contributions!
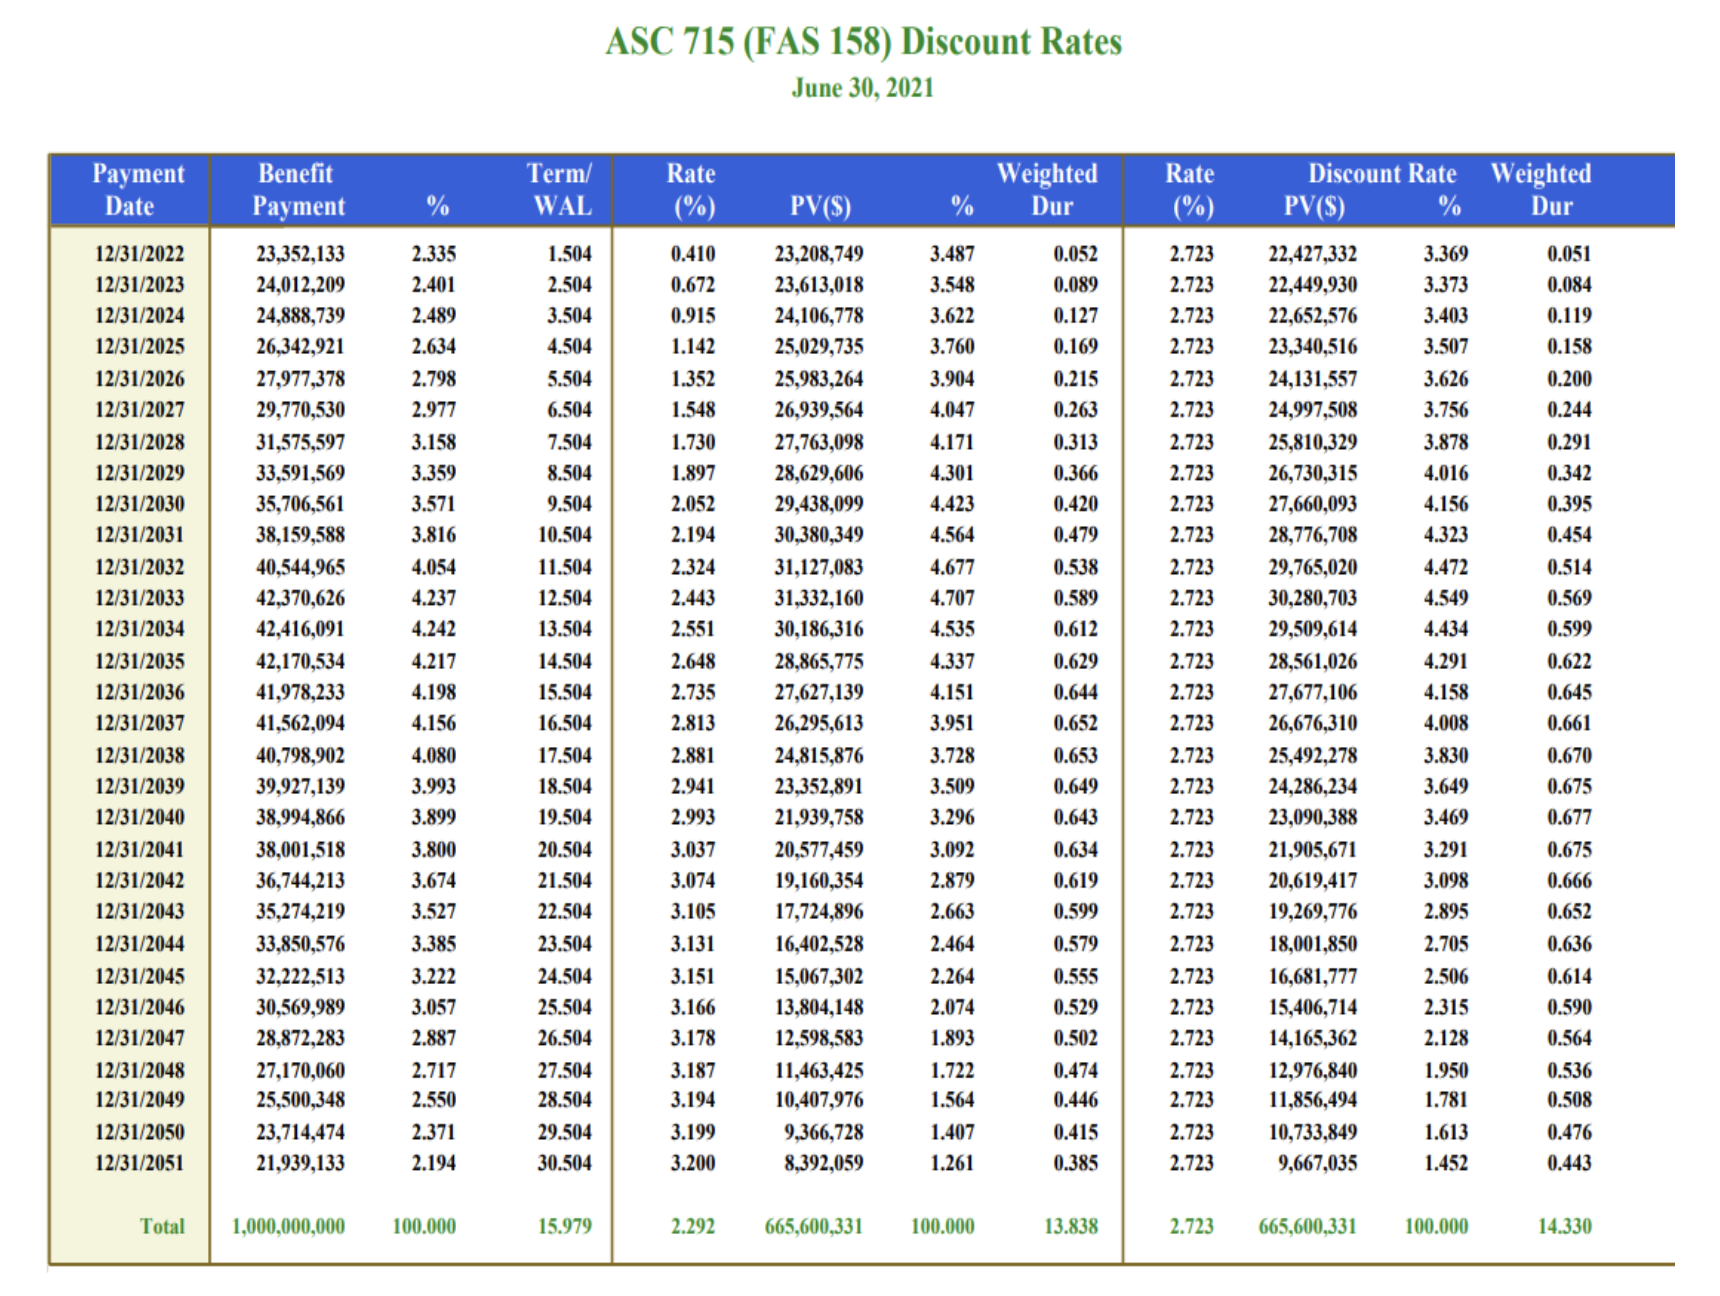
Duration is a present value calculation based on a discount rate yield curve. ASC 715 is the most prominent and acceptable for corporate and multiemployer pension plans. Moreover, Moody’s has adopted ASC 715 discount rates to assess municipal credits instead of the ROA discount rate commonly used under GASB accounting. FASB requires that this ASC 715 discount rate yield curve be converted to a single rate average discount rate. The duration of this single discount rate is certainly different than the average of a multiple discount rate yield curve. In the sample liability term structure shown on the next page priced with ASC 715 discount rates, we calculate:
| ASC 715 Yield Curve | Single Rate | Difference | |
|---|---|---|---|
| Average Yield | 2.29% | 2.72% | 0.43% |
| Duration | 13.84 years | 14.34 years | 0.50 years |
Note: For an accurate immunization, you need to match the duration of the ASC 715 yield curve (all liabilities) not the single rate average duration.
Solution: $ Duration Matching with Modified Duration
Maturity is an indicator of interest rate risk because longer maturity bonds move more in price than shorter maturity bonds given a change in yield. However, maturity is not a good measure of interest rate risk because maturity only considers the timing of the final principal cash flow at maturity and ignores the sizes and timing of all the other cash flows leading up to maturity.
The present value or price volatility of pension liabilities behaves just like bonds. A pension liability schedule is a term structure or yield curve of ASC 715 rates. Therefore, the interest rate risk in a pension liabilities schedule (actuarial projected benefits) can be matched with a portfolio of bonds.
A better measure for interest rate risk in the form of price sensitivity is called Modified Duration. Modified Duration considers all the bonds cash flows and is the weighted average time to receipt of all the cash flows, with the weights being the present values of the cash flows divided by a factor of (1+Y) where Y is the annual yield to maturity of the bond.
Modified Duration represents the percentage price change in market value in response to a change in the asset or liability yield. By weighting modified duration by the market value of the holding, that is, by multiplying the market value of the position by its modified duration, we get dollar-weighted duration. This dollar-weighted duration is known as Dollar Duration and represents the actual dollar change in market value for a bond given a change in its yield. Dollar duration is typically expressed in the dollar value change per one basis point change in yield (DV01).
The major advantages of using dollar duration are that it is additive and better suited for asset liability management. Dollar duration extends easily from individual securities to entire portfolios. The dollar duration of a portfolio is simply the sum of the dollar durations of all the individual holdings. The dollar duration of a bond portfolio can be matched to the dollar duration of pension liabilities. Bond durations cap out around 20-years so for liabilities with durations longer than 20-years it is not possible to match duration but… it is possible to match the Dollar duration of liabilities with durations longer than 20-years. Therefore, Dollar duration is very useful in asset liability management for liability driven investors such as defined benefit pension plans.
Ryan ALM uses dollar duration matching to help reduce pension volatility as defined as the dollar value difference in interest rate sensitivity between the present value of assets and liabilities. Ryan ALM starts by creating a Custom Liability Index (CLI) for each pension client. The Custom Liability Index is derived from the unique liabilities cash flow schedule provided by the plan actuary. The CLI measures and monitors the change in present value for the liabilities given a change in ASC 715 discount rates and is the proper benchmark for a plan sponsor and their liability driven investor(s).
Once we have determined the interest rate risk in the liabilities, the next step is to ensure that the bond portfolio has the same amount of interest rate risk as liabilities in order to reduce volatility between the present value of assets and liabilities. Ryan ALM builds a bond portfolio called the Liability Beta Portfolio (LBP) that matches the cash flows of the bonds to the liability cash flows (benefit payments). Since dollar duration is additive, we can set the dollar duration of the bond portfolio equal to the dollar duration of liabilities. Ryan ALM believes that cash flow matching liabilities with bond cash flows along with the use of dollar duration is a lower cost and lower volatility approach to pension asset liability management. It is certainly more accurate than traditional duration matching to immunize interest rate sensitivity.
Becoming Liability Aware
A Strategy For Improved Pension Funding The Objective in managing a defined benefit plan is to fund benefit payments (liabilities) in a cost effective manner and to reduce risk over...
Source: Becoming Liability Aware'
A Strategy For Improved Pension Funding
The Objective in managing a defined benefit plan is to fund benefit payments (liabilities) in a cost effective manner and to reduce risk over the long term.
The Process to improve funding starts with becoming more liability aware, and it includes the following steps / products to assist the sponsor in meeting the Objective.
Price your liability - ASC 715 Discount Rates
Provide a series of yield curves that conform to ASC 715. Price Waterhouse is a major subscriber. Ryan ALM discount rates consistently out-yield Citigroup’s rates.
Measure your liability - Custom Liability Index (CLI)
CLI provides all calculations needed to measure and monitor the PV risk/reward behavior of liabilities including: growth rate, statistical summary (YTM, Duration, etc.) and interest rate sensitivity. We will create both a gross and net CLI (after Contributions). The CLI is the proper benchmark for pensions.
Monitor your liability - Asset / Liability Summary
Based on the CLI calculations, we will create a summary page to clearly show the difference between gross and net CLI, the present value difference between discount rates, and the growth rate of the plan’s liabilities.
Will the plan go broke? - Asset Exhaustion Test (AET)
The AET will calculate when the current assets are exhausted and can no longer fund benefit payments. The AET includes all cash flows from current assets and the projected contributions. We will run a matrix of asset growth rates to calculate the proper ROA needed to fully fund liabilities.
Set the glide path - Allocation of Assets to Beta (insurance) and alpha (growth) The output from the CLI and AET will highlight that portion of the assets that can be allocated to beta versus alpha. This bifurcated approach is unique relative to single asset allocation strategies, and it is dynamic in its response to changes in the funded ratio / funded status.
Begin to de-risk the plan - Liability Beta Portfolio (LBP)
The LBP is a fixed income portfolio designed to cash flow match and fund the projected benefit payment schedule at the lowest cost to the plan. The LBP is a cost optimization model that should reduce funding costs versus the ASC discount rates using investment grade bonds.
PPA Recommendation for Multiemployer Plans
Replace Active Bond Management with Liability Beta Portfolio
Reduce Asset Management Costs by 50%
Match Net Liabilities Chronologically
Reduces Funding Costs by 4%+
De-Risks the Plan Gradually
Buys Time for the Alpha assets to Outgrow Liabilities
Transfer Alpha Victories to LBP (Portable Alpha)
Stabilizes Funded Ratio + Funded Status