
Ryan ALM
White Papers
How Bonds Can Enhance the ROA
Given the volatility and uncertainty of the financial markets, bonds can provide Pension Plan Sponsors a strategy to mitigate some of that volatility. Bonds, through the certainty of their cash...
Source: How Bonds Can Enhance the ROA
Given the volatility and uncertainty of the financial markets, bonds can provide Pension Plan Sponsors a strategy to mitigate some of that volatility. Bonds, through the certainty of their cash flows, prove to be a very effective tool. Most pensions focus on earning the return on asset (ROA) assumption as the goal of asset allocation. Because bonds yield less today than the ROA (7.00% average) the asset allocation to bonds tends to be lower than historic norms. But there exists a bond allocation that could enhance the probability of achieving the ROA. Here’s how:
Cash Flow Matching – if bonds were used to cash flow match and fund net liabilities (after contributions) chronologically they would produce the liquidity needed to fully fund such net liabilities. Cash flow matching works best with longer coupon bonds where you use semi-annual interest income to partially fund liabilities. A 10-year bond has 20 interest cash flows + one principal cash flowall priced at a 10-year yield. Having this liquidity would eliminate the need to do a cash sweep from other asset classes which is a common liquidity procedure. According to Guinness Global, the S&P 500 has 47% of its historical returns from dividends and reinvestment since 1940 on a 10-year rolling period basis. Wouldn’t you want to reinvest dividends back into growth assets rather than spend it on funding benefits + expenses? By using bonds as the liquidity assets, the growth assets are left unencumbered to grow. The longer the cash flow matching period, the more time the growth assets have to compound their growth. This strategy and practice could significantly enhance the ROA.
Yield on Bonds – the asset allocation models forecast the return of each asset class in the model, then weight each asset class to get the derived ROA for total assets. The ROA for most asset classes is based on the historical returns of each asset class index benchmark except for bonds. The currentyield on the bond index benchmark(s) is usually used as the forecast for bond returns. The Bloomberg Barclay Aggregate is most favored as the bond index benchmark. This index was designed at Lehman Bros. by Ron Ryan when he was the head of Fixed Income Research & Strategy from 1977 to 1983. The Aggregate is a very large and diversified portfolio of bonds with the following summary statistics as of March 31, 2025:
| # of issues | 13,770 | Treasury | 44.79% | AAA | 3.06% |
| YTM | 4.51% | Agency | 1.29% | AA | 47.86% |
| Duration | 6.08 yrs. | Mtg. Backed | 24.85% | A | 11.38% |
| Avg. Maturity | 8.38 yrs. | Corporates | 24.06% | BBB | 11.43% |
| NR | 25.60% |
As a result, most asset allocation models would have a ROA for bonds of about 4.50%. If you can build a bond portfolio that outyields the Aggregate index, by definition, it should enhance the ROA for total assets. Ryan ALM Advisers, LLC has created a cash flow matching product we call the Liability Beta Portfolio™ (LBP). The LBP is a cost optimization model that cash flow matches liability cash flows chronologically at the lowest cost from a corporate bond portfolio skewed to A/BBB bonds. Based on the actuarial projections of each client we initially build a Custom Liability Index (CLI) to calculate net liabilities ((benefits + expenses) – contributions) chronologically. The CLI provides all the data needed for the LBP to function efficiently. Based on the allocation to the LBP will determine how far out the LBP can fully fund net liabilities. Usually, a 15% allocation to the LBP can fund 1-7 or even 1-10 years of net liabilities. The longer the term structure of the LBP, the higher the yield. The LBP will roughly outyield the Aggregate index by 50 bps (1-5 years) to over 100 bps (1-10 years) based on the LBP term structure. If the LBP outyields the AGG index by 50 to 100 bps, asset allocation can afford to overweight the bond allocation and still meet the target ROA for total assets. A 15% allocation to LBP is 7.5 to 15 bps value added to the ROA.
3.Cash – many pension plans have a cash allocation of around 2%+. Cash is usually the lowest yielding asset. Since the LBP becomes the liquidity assets to fully fund benefits + expenses chronologically, there is little need for cash to fund B+E. Cash might only be needed for capital calls on Private Equity and Alternative Investments. The LBP should significantly increase the yield margin versus cash since the LBP is using A/BBB+ coupon income from all maturities of the LBP. With the LBP fully funding B+E, the cash allocation can be reduced to <1%. Replacing most of the cash allocation to fund B+E with the LBP allocation is another ROA enhancement… it all adds up.
Ryan ALM Pension Monitor Q1 ‘22
Ryan ALM Pension Monitor (Through March 31, 2022) Pension plan liabilities need to be measured and monitored regularly. Without knowledge of plan liabilities, the allocation of plan assets cannot be...
Source: Ryan ALM Pension Monitor 1Q
(Through March 31, 2022)
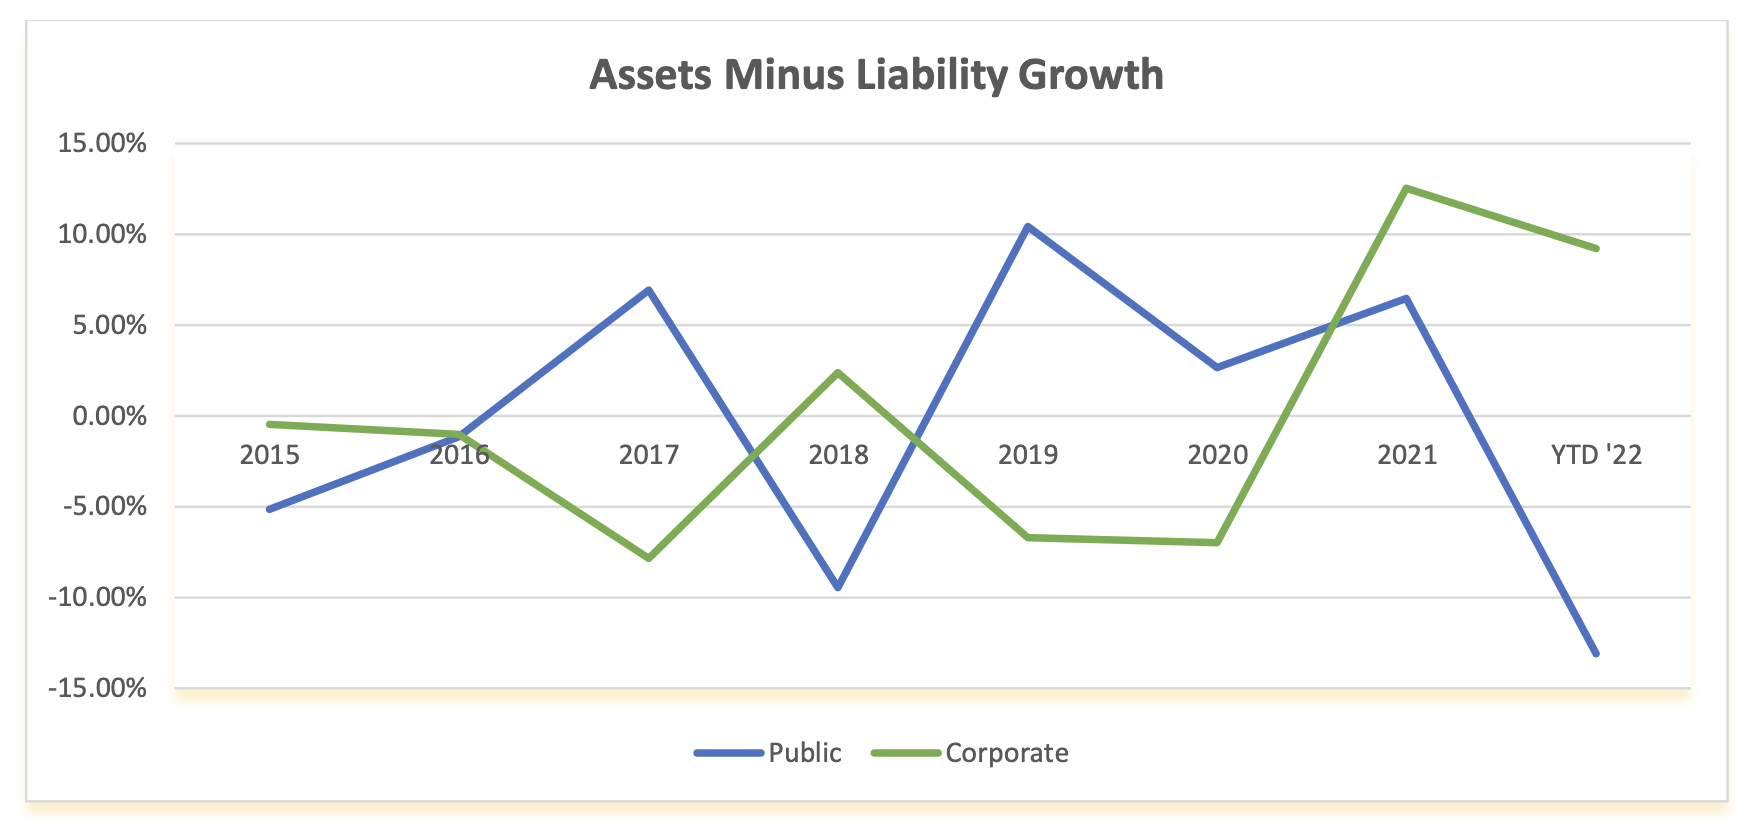
Pension plan liabilities need to be measured and monitored regularly. Without knowledge of plan liabilities, the allocation of plan assets cannot be done efficiently or appropriately.
The funded ratio/status of pension plans are present value calculations. Each type of plan is governed by accounting rules and actuarial practices, which determine the discount rate used to calculate the present value of liabilities. Single employer corporate plans are under ASC 715 (FASB) discount rates (AA corporate zero-coupon yield curve); multiemployer plans and public plans use the ROA (return on asset assumption) as the liability discount rate. The difference in liability growth between these plans can be quite significant, which will affect funded status and contribution levels.
The table below compares these different liability growth rates (based on a 12-year average duration) versus the asset growth rate based on the P&I asset allocation survey of the top 1,000 plans which is updated each year. The graph below shows the contrasting annual differences of asset versus liability growth for corporate and public plans since 2015. The impact of different accounting rules is massive.
| ASSET ALLOCATION | Q1’22 Return | Corporate | Public | Union |
|---|---|---|---|---|
|
Domestic Stock International Stock Global Equity Domestic Fixed Income Global Fixed Income Cash Private Equity Real Estate Equity* Other |
-4.6% -5.8% -5.2% -5.9% -6.5% -0.1% 3.5% -1.3% 3.5% |
11.1% 6.5% 10.4% 46.7% 1.3% 2.0% 8.5% 4.1% 9.4% |
24.4% 16.3% 5.3% 20.2% 1.7% 2.0% 12.7% 7.9% 9.5% |
24.7% 8.6% 11.4% 28.0% 0.9% 0.6% 8.2% 9.3% 8.3% |
| TOTAL ASSETS Growth Rate | -3.7% | -3.0% | -3.5% | |
| LIABILITIES Growth Rate | -9.2% | 1.8% | 1.8% | |
| Asset Growth – Liability Growth | 5.5% | -4.8% | -5.3% |
Index Benchmarks: Domestic Stock = S&P 500; Int’l Stock = EAFE, Global Equity = All Country World; Domestic Fixed Income = BB Aggregate; Global Fixed Income = FTSE World Gov’t (unhedged); Cash = 3 mo. T-Bill; Private Equity =10-year return for the R2500 + 2%; *Real estate Equity =NFI-DP Index (delayed one month); Alternative Investments and Other = CPI-U & 3%.
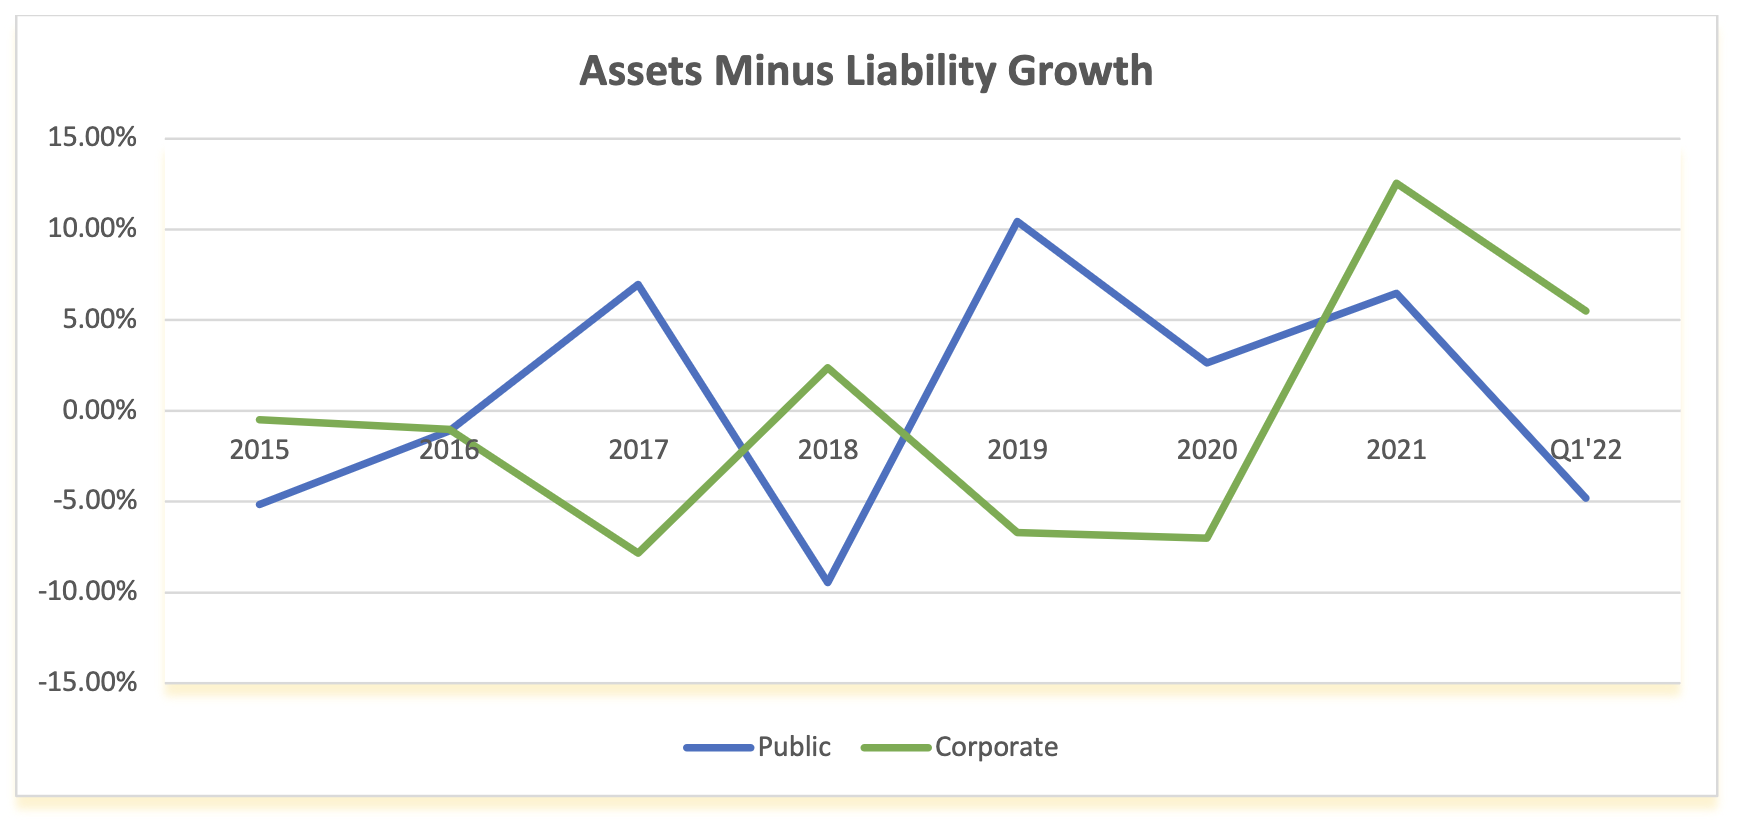
Footnote: The measurement of asset growth to liability growth is an annual calculation beginning on December 31, 2015. For periods shorter than 1-year, the observation is a YTD calculation.
The Risk/Reward of Bonds
Unlike any other asset class, fixed income (bonds) has two risk/reward values: Total Return Certain Cash Flows Total Return Value The total return value in bonds is the converse of...
Source: The Risk/Reward of Bonds
Unlike any other asset class, fixed income (bonds) has two risk/reward values:
Total Return
Certain Cash Flows
Total Return Value
The total return value in bonds is the converse of interest rate movements. When rates go down, as they have from 1981 to 2021, they produce price appreciation and higher total returns. And the opposite happens (negative price returns) when rates go up as they did from 1953 to 1981.
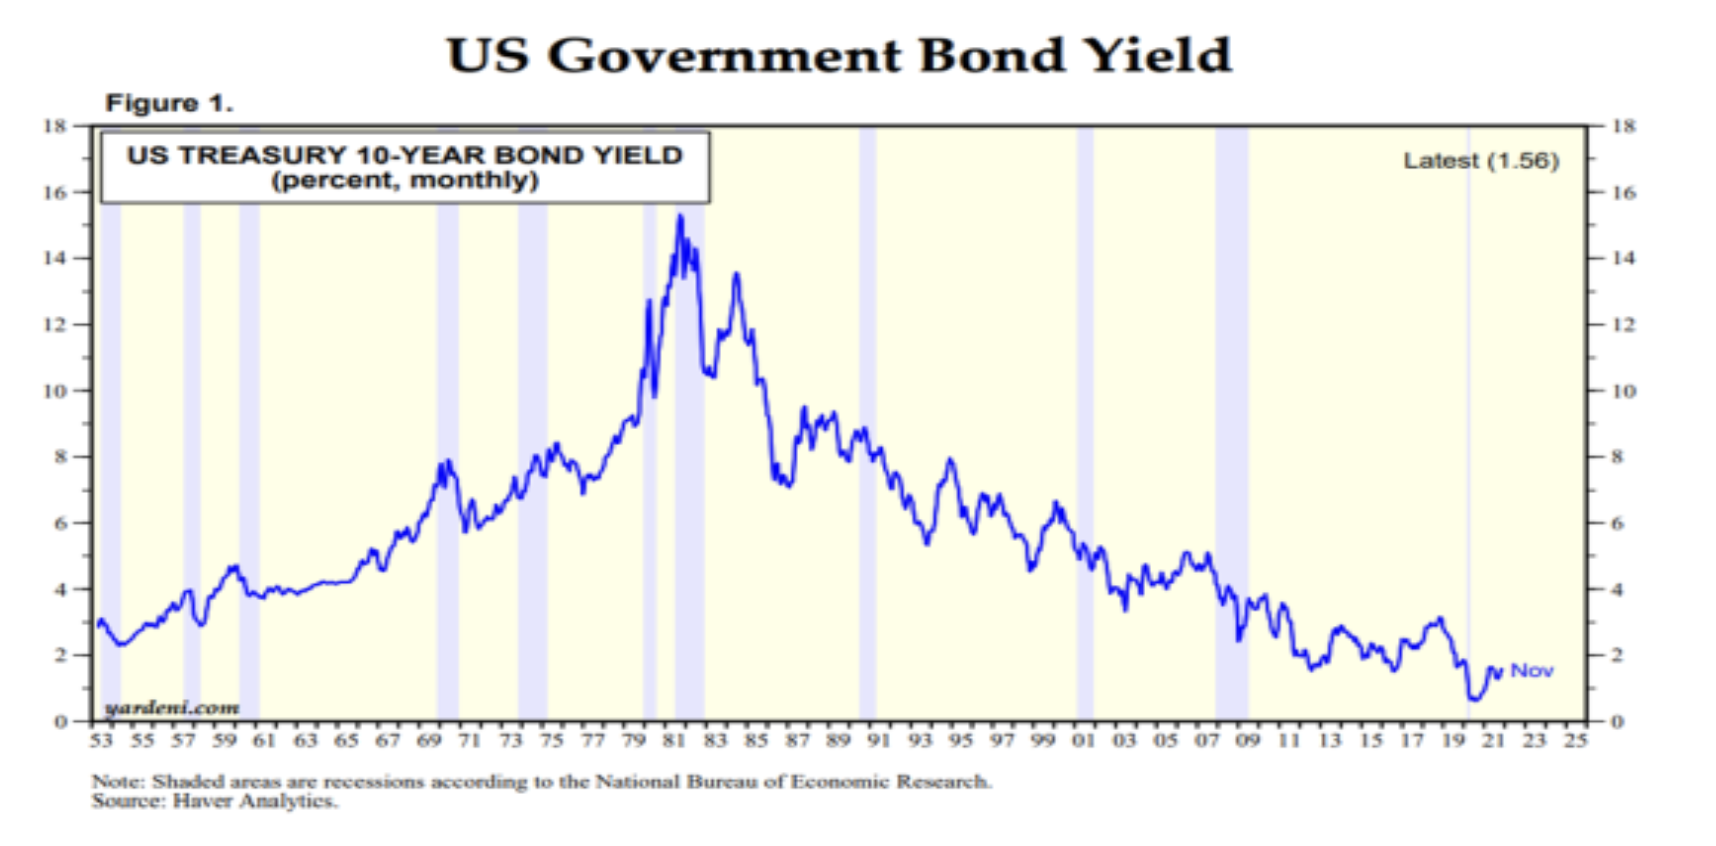
Since the start of 2022, interest rates have trended upward causing negative bond returns (BB Aggregate Index -3.25% YTD thru 02/28/22). Given the current inflation rate of over 7.0% on the CPI and over 9.0% for the PPI, coupled with the expectation that the Fed will raise short rates several times this year… this interest rate trend to higher rates should continue. As a result, pensions should expect negative fixed income returns this year and for the foreseeable future.
Certain Cash Flow Value
If you buy bonds for their intrinsic value (certainty of cash flows) you will immunize or mitigate interest rate risk! Since cash flows are future values, they are not affected by interest rate movements.Moreover, any excess cash flow reinvested will be able to buy new cash flows at reduced costs. This is truly the value in bonds and we strongly recommend that pensions use bonds as their liquidity or Beta assets. Let the performance or Alpha assets be the non-bond assets. Use bonds to cash flow match pension benefits and expenses chronologically. This synergy of Beta and Alpha assets should secure benefits, reduce funding costs, and buy time for the Alpha assets to grow unencumbered.
Cash flow matching by any name (defeasance, dedication, immunization) may be the oldest fixed-income strategy. It should be the core portfolio of a pension and the fixed income strategy chosen by pensions today given the likelihood of higher interest rates. Cash flow matching will secure benefits in a cost-efficient manner. The Ryan ALM cash flow matching product (Liability Beta Portfolio™) will reduce funding costs by about 1% per year of matching (i.e. 1-10 years = 10% funding cost reduction).
With the stock market struggling this year (S&P 500 -10.7% YTD thru 03/07/22), a cash flow matching bond allocation will buy time for the equity allocation to recover without any dilution to fund benefits and expenses. Let bonds be the liquidity assets to fund benefits + expenses. Let the growth assets grow unencumbered without any dilution. History tells us that 48% of the S&P 500 returns on a rolling 10-year basis come from dividends reinvested.
NIRS Innovative Pension Funding Strategies
The NIRS pension objectives for this paper are: Reduce contribution volatility Promote intergenerational equity Keep plan on sound funding trajectory Cash Flows (Future Values versus Present Values) Pensions are all...
Source: NIRS Innovative Pension Funding Strategies
The NIRS pension objectives for this paper are:
Reduce contribution volatility
Promote intergenerational equity
Keep plan on sound funding trajectory
Cash Flows (Future Values versus Present Values)
Pensions are all about cash flows: asset cash flows versus liability cash flows. It is the future value of these cash flows that are the most meaningful and need to be monitored. Asset cash flows are pension assets (A) to grow at some ROA forecasted rate + projected contributions (C). Liability cash flows are projected benefit payments (B) + projected administrative expenses (E). The formula of: (A + C) – (B + E) is what dictates the soundness and solvency of any pension. However, funded ratios and status are based on the present value of A/B or A – B. Contributions and expenses are not included in the funded ratio/status. Contributions are the first source to fund B + E. Accordingly, assets fund net liabilities not gross. This is the first innovative funding strategy: subtract contributions from B + E to calculate net liabilities. Have assets focus on fully funding net liabilities. Indeed, GASB requires an asset exhaustion test (AET) as a test of solvency which takes cumulative projected A + C minus projected B + E on an annual basis to determine how far out is the plan solvent. The AET is truly the battlefield that the pension asset/liability game is played on and should play a major role in asset allocation.
Present values may help us understand if we are on track like a scoreboard but can be very misleading. Take for example, two portfolios: one is 100% in Treasuries yielding 1.75% and the second portfolio is 100% in corporate bonds yielding 2.50%. They have the same present values, but their future values are much different by as much as 20% to 30% depending on maturities. They have the same funded ratio and status, but they are certainly different in pension solvency. The same problem exists with asset smoothing and actuarial valuations. Only a market valuation will tell you the true or accurate economic value. Imagine your bank telling you that they cannot provide your current balance but only the five-year average balance. Would you be comfortable writing a check on that information? Asset liability management (ALM) requires accurate and frequent information in order to be successful.
Return on Asset Assumption (ROA)
Assets need to know what they are funding… net not gross liabilities. The AET can be modified to calculate the ROA needed for assets to fully fund net liabilities. This is the second innovative funding strategy: calculate the ROA based on the AET and not asset allocation. Currently, the ROA is calculated based on what asset allocation tells us is a high probability of achieving a target return given a certain asset allocation. This in no way tells us if this ROA is capable of achieving accurate full funding, which is the true goal of the assets. The ROA may be too high creating surpluses and higher contribution costs (too often the result). The AET can be used to calculate what ROA will fully fund residual net liabilities. This accurately determined ROA will now be the hurdle rate for asset allocation.
Assure Plan Remains on Sound Funding Trajectory
It is the future value of A + C versus B + E that counts. That is what the AET focuses on and what assets should focus on. Since we only know the future value of bonds with certainty then bonds should be the core or Beta portfolio. This is the third innovative funding strategy: install a Beta portfolio to cash flow match net liabilities chronologically. The Beta assets are the liquidity assets to fund B + E chronologically and buy time for the Alpha or growth assets to grow unencumbered. Asset allocation should initially focus on the weighting of Beta + Alpha assets that produce the highest probability of fully funding B + E net of C. The question of how much is allocated to the Beta assets is based on the how well funded the plan is. The higher the funded ratio, the greater the allocation to Beta assets. Logically, you want the Beta assets to fund the next 10-years since history tells us that the alpha assets need time to perform and grow. This will allow the Alpha assets to reinvest their dividends and income streams. Historically, about 48% of the S&P 500 growth on a 10-year rolling basis since 1950 comes from dividends and reinvestment.
This is not how asset allocation has worked for decades. Instead, asset allocation is based on achieving a target ROA which favors a high allocation to riskier (Alpha) assets no matter what the funded status is. Two plans, one at 40% funded and the other at 80% funded should have distinctly different asset allocations. But if they have the same ROA, they will have the same or similar asset allocations. This was the asset allocation mistake made in the 1990s when public pension plans had surpluses. Why didn’t they secure B + E and the surplus with a high allocation to Beta assets that would have cash flow matched B + E for many years? Instead, they reduced their allocation to bonds to achieve a ROA target return as interest rates were going down in a secular trend over 38 years. The equity correction of 2000-02 sent funded ratios into deep deficits and spiking contribution costs which public pensions have not yet cured.
Reduce Contribution Cost Volatility
Cash flow matching (CDI) with bonds reduces contribution cost volatility by definition. It will fully fund B + E chronologically thereby reducing contribution cost volatility in the area it is funding (i.e., 1-10 years). CDI is based on matching and funding future values not present values. This eliminates the actuarial noise from actuarial valuations. It also mitigates interest rate risk which is the dominant risk factor in bonds. The future value of B + E is not very volatile especially on shorter projections (i.e., 1-10 years). Moreover, CDI will rebalance whenever actuarial projections change to always be cash flow matched to projected B + E. It also assures that the pension plan remains on a strong fiscal path. The certainty of their cash flows is the value of bonds and why bonds have always been used for cash flow matching, defeasance, dedication and immunization. A cash flow matching portfolio should be the anchor or core portfolio for prudent pension ALM.
Intergenerational Equity
The AET will calculate the residual or remaining assets based on fully funding B + E after C. As a result, you want AET to show an increase in assets or, at least, show the initial assets as the remainder so intergenerational equity has improved its asset position or no dilution of assets. The AET is certainly the best measurement for intergenerational equity and should be monitored annually.
Hypothetical Pension Plan
Applying our innovative funding strategies to the NIRS hypothetical pension plan, we first calculated net liabilities (B + E) – C by using the projected B + E provided by NIRS and taking contributions (normal cost) of $184.75 million and growing it at 3% for payroll inflation which creates a constant 12% of payroll contribution cost. We ran three asset exhaustion test (AET) versions (see link _____________________):
Keeping Contributions as a constant 12% of payroll with 3% inflation grows contribution costs to exceed B + E by 1/01/64. As a result, a ROA of less than 3% will fully fund all projected B + E thru 12/31/99.
Removing Contributions after 1/01/64 (crossover point where C > B + E) would result in a ROA of 4.63% to fully fund all projected B + E thru 12/31/99.
Freezing Contribution costs at the initial amount would result in a ROA of 6.19% to fully fund all projected B + E thru 12/31/99.
The major point of this exercise is to show and prove that the ROA is not a calculated number based on the funded status. If the mission of pension assets is to fully fund B + E in a cost-efficient manner with prudent risk, then assets need to know the correct ROA needed to accomplish this mission. But that is not what happens today with the ROA and asset allocation. A rounded ROA hurdle rate is commonly used based on the asset allocation model with no regards to the funded status. As a result, a surplus funded status and a significant deficit funded status could have the same ROA if that they had the same or similar asset allocation. This is not logical or in the best interest of the plan solvency. Again, my example of what happened in the 1990s which led to spiking contribution costs in the early 2000s and beyond should never be repeated.
Today, most public plans have seen an improvement in their funded status but little or no change in their asset allocation. To be true to the pension objective, asset allocation needs to be responsive to the economic funded status based on valuing assets and liabilities on market valuations not actuarial valuations. We ran a Custom Liability Index (CLI) to compare and calculate the present value of B + E before and after C based on both a 7% ROA and an ASC 715 discount rate of 2.61%. Here are the calculations:
Custom Liability Index
| Assets | $7,665,500,000 | $7,665,500,000 |
| Gross Liabilities (w/o Contributions) | $40,998,000,000 | $40,998,000,000 |
| PV of Gross CLI (w/o Contributions) | $9,259,823,437 | $19,351,264,070 |
| Funded Ratio | 82.78% | 39.61% |
| PV of Net CLI (C @ 3% growth to 1/1/64) | $5,349,624,369 | $11,215,430,808 |
| Net Funded Ratio (with C) | 143.29% | 68.35% |
Noticeably, there is a significant difference in PV based on the two discount rates (ROA vs. ASC 715). Which one provides the best calculation of the true economic funded ratio/status? Which one should asset allocation be focused on? Certainly, the ASC 715 is based on reality… current market rates. FASB accounting rules clearly state that the discount rate should be a rate that can settle the liabilities… a rate you can buy to defease liabilities. The ROA discount rate is eliminated here since it is a rate that you can NOT buy.
Cash flow matching (CDI) with bonds focuses on future values and eliminates this confusion over discount rates and the correct present value of liabilities and funded ratio/status. Our third innovative funding strategy is to install CDI as the core portfolio or liquidity assets to fully fund B + E (net after contributions) for as far out as makes sense. Logically, the CDI allocation should allow for the asset allocation to achieve the new calculated ROA. Based on the AETs we ran, it looks like a 4.63% ROA is the proper hurdle rate if C are used to initially fund B + E up to 1/01/64 leaving net liabilities to be funded by the assets. This would suggest that 47% invested in CDI yielding 2.00% + and 53% invested in residual assets earning 7.00% would earn the 4.63% hurdle rate. This is the prudent approach to a calculated ROA and a responsive asset allocation to fully funding (B + E) – C. It is also a far more conservative asset allocation than that of most plans that should lead to significantly reduced volatility of returns, contribution expenses, and the plan’s funded status while keeping the plan on a sound funding trajectory.
Resume
Ronald J. Ryan, CFA
——
CEO and founder of Ryan ALM, Inc. in 2004. Ryan ALM provides a turnkey system for pensions that reduces cost and risk based on three synergistic and proprietary models:
ASC 715 Discount Rates
Custom Liability Index (CLI)
Liability Beta Portfolio™ (LBP)
The CLI and LBP cash flow matching model are both unique in the pension industry. The index division of Ryan ALM also provides custom indexes for ETFs.
Prior to creating Ryan ALM, Mr. Ryan founded Ryan Labs, Inc. in 1988 which became one of the largest Enhanced Bond Index Fund managers in America. In 1982, he founded the Ryan Financial Strategy Group (RFSG) which was a fixed income quantitative firm focused on helping bond managers outperform bond Indexes. At RFSG, he and his team created many unique financial models and index innovations. Mr. Ryan is the former Director of fixed income research at Lehman Bros. Kuhn Loeb from 1977–1982 where he designed most of the popular Lehman bond indexes.Prior to Lehman, he was the head of fixed income for the First in Dallas from 1973-1977, the largest bank holding company in Texas. From 1966-1973 he was a security analyst at Pan-American Life Insurance company, the largest institutional investor in Louisiana.
Mr. Ryan has a CFA degree, and a MBA and BBA from Loyola University.
Ryan ALM Pension Monitor 4Q ‘21
Ryan ALM Pension Monitor (Through December 31, 2021) Pension plan liabilities need to be measured and monitored regularly. Without knowledge of plan liabilities, the allocation of plan assets cannot be...
Source: Ryan ALM Pension Monitor 4Q
(Through December 31, 2021)
Pension plan liabilities need to be measured and monitored regularly. Without knowledge of plan liabilities, the allocation of plan assets cannot be done appropriately.
The funded ratio/status of pension plans are present value calculations. Each type of plan is governed by accounting rules and actuarial practices, which determine the discount rate used to calculate the present value of liabilities. Single employer corporate plans are under ASC 715 (FASB) discount rates (AA corporate zero-coupon yield curve); multiemployer plans and public plans use the ROA (return on asset assumption) as the liability discount rate. The difference in liability growth between these plans can be quite significant, which will affect funded status and contribution levels.
The table below compares these different liability growth rates (based on a 12-year average duration) versus the asset growth rate based on the P&I asset allocation survey of the top 1,000 plans which is updated each year. The graph below shows the contrasting annual differences of asset versus liability growth for corporate and public plans since 2015. The impact of different accounting rules is massive.
| ASSET ALLOCATION | 2021 Return | Corporate | Public | Union |
|---|---|---|---|---|
|
Domestic Stock International Stock Global Equity Domestic Fixed Income Global Fixed Income Cash Private Equity Real Estate Equity Alternative Investments Other |
28.7% 11.9% 16.8% -1.5% -7.0% 0.1% 14.4% 22.0% 10.0% 10.0% |
10.6% 7.1% 13.3% 48.3% 0.7% 2.4% 6.2% 4.5% 4.6% 2.5% |
24.6% 16.9% 6.2% 21.0% 2.3% 2.0% 10.3% 8.7% 7.6% 1.4% |
24.7% 8.6% 11.4% 28.0% 0.9% 0.6% 8.2% 9.3% 8.3% 0.0% |
| TOTAL ASSETS Growth Rate | 7.9% | 13.8% | 13.6% | |
| LIABILITIES Growth Rate | -4.6% | 7.3% | 7.3% | |
| Asset Growth – Liability Growth | 12.5% | 6.5% | 6.3% |
Index Benchmarks: Domestic Stock = S&P 500; Int’l Stock = EAFE, Global Equity = All Country World; Domestic Fixed Income = BB Aggregate; Global Fixed Income = FTSE World Gov’t (unhedged); Cash = 3 mo. T-Bill; Private Equity =10-year return for the R2500 + 2%; Real estate Equity =NFI-DP Index; Alternative Investments and Other = CPI-U & 3%.
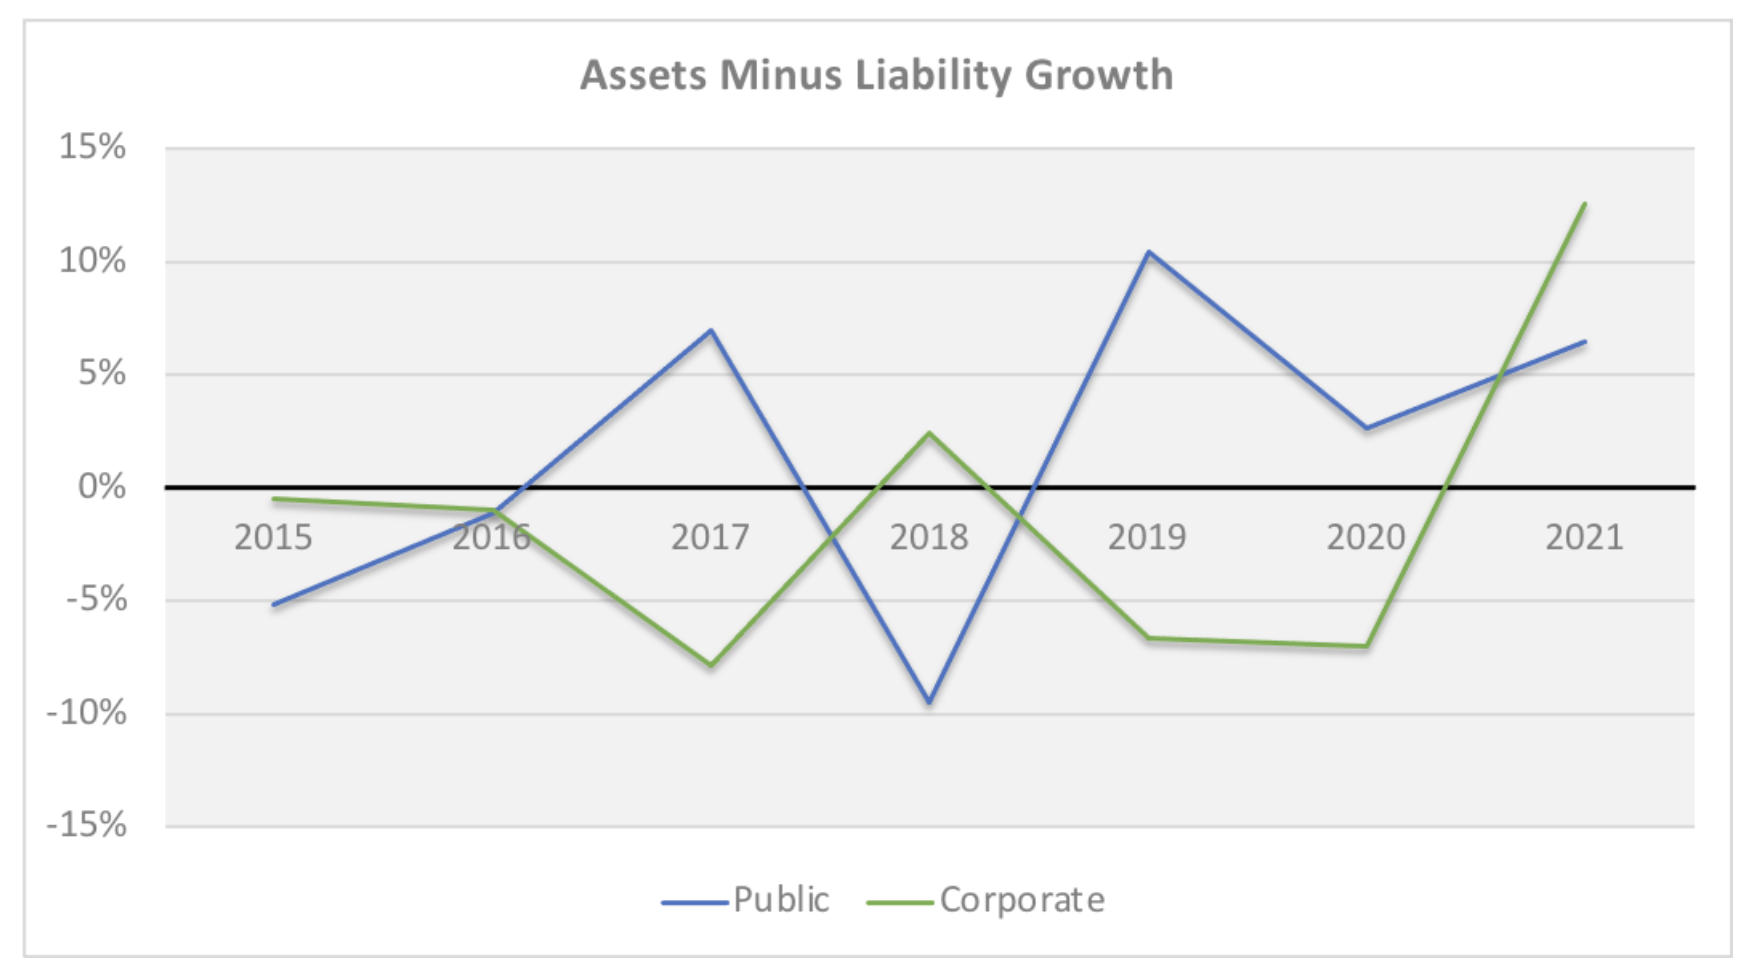
Footnote: The measurement of asset growth to liability growth is an annual calculation beginning on December 31, 2015. For periods shorter than 1-year, the observation is a YTD calculation.
Ryan ALM Pension Monitor 3Q ‘21
Ryan ALM Pension Monitor (Through September 30, 2021) Pension plan liabilities need to be measured and monitored regularly. Without knowledge of plan liabilities, the allocation of plan assets cannot be...
Source: Ryan ALM Pension Monitor 3Q
(Through September 30, 2021)
Pension plan liabilities need to be measured and monitored regularly. Without knowledge of plan liabilities, the allocation of plan assets cannot be done appropriately.
The funded ratio/status of pension plans are present value calculations. Each type of plan is governed by accounting rules and actuarial practices, which determine the discount rate used to calculate the present value of liabilities. Single employer corporate plans are under ASC 715 (FASB) discount rates (AA corporate zero-coupon yield curve); multiemployer plans and public plans use the ROA (return on asset assumption) as the liability discount rate. The difference in liability growth between these plans can be quite significant, which will affect funded status and contribution levels.
The table below compares these different liability growth rates (based on 12-year average duration) versus the asset growth rate based on the P&I asset allocation survey of the top 1,000 plans. The graph below shows the contrasting annual differences of asset versus liability growth for corporate and public plans since 2015.
| ASSET ALLOCATION | YTD 09/21 Return | Corporate | Public | Union |
|---|---|---|---|---|
|
Domestic Stock International Stock Global Equity Domestic Fixed Income Global Fixed Income Cash Private Equity Real Estate Equity Alternative Investments Other |
15.9% 8.3% 11.5% -1.6% -5.9% 0.1% 15.3% 10.5% 8.3% 8.3% |
10.6% 7.1% 13.3% 48.3% 0.7% 2.4% 6.2% 4.5% 4.6% 2.5% |
24.6% 16.9% 6.2% 21.0% 2.3% 2.0% 10.3% 8.7% 7.6% 1.4% |
24.7% 8.6% 11.4% 28.0% 0.9% 0.6% 8.2% 9.3% 8.3% 0.0% |
| TOTAL ASSETS Growth Rate | 5.0% | 8.7% | 8.4% | |
| LIABILITIES Growth Rate | -6.3% | 5.3% | 5.3% | |
| Asset Growth – Liability Growth | 11.3% | 3.4% | 3.1% |
Index Benchmarks: Domestic Stock = S&P 500; Int’l Stock = EAFE, Global Equity = All Country World; Domestic Fixed Income = BB Aggregate; Global Fixed Income = FTSE World Gov’t (unhedged); Cash = 3 mo. T-Bill; Private Equity =10-year return for the R2500 + 2%; Real estate Equity =NFI-DP Index; Alternative Investments and Other = CPI-U & 3%.
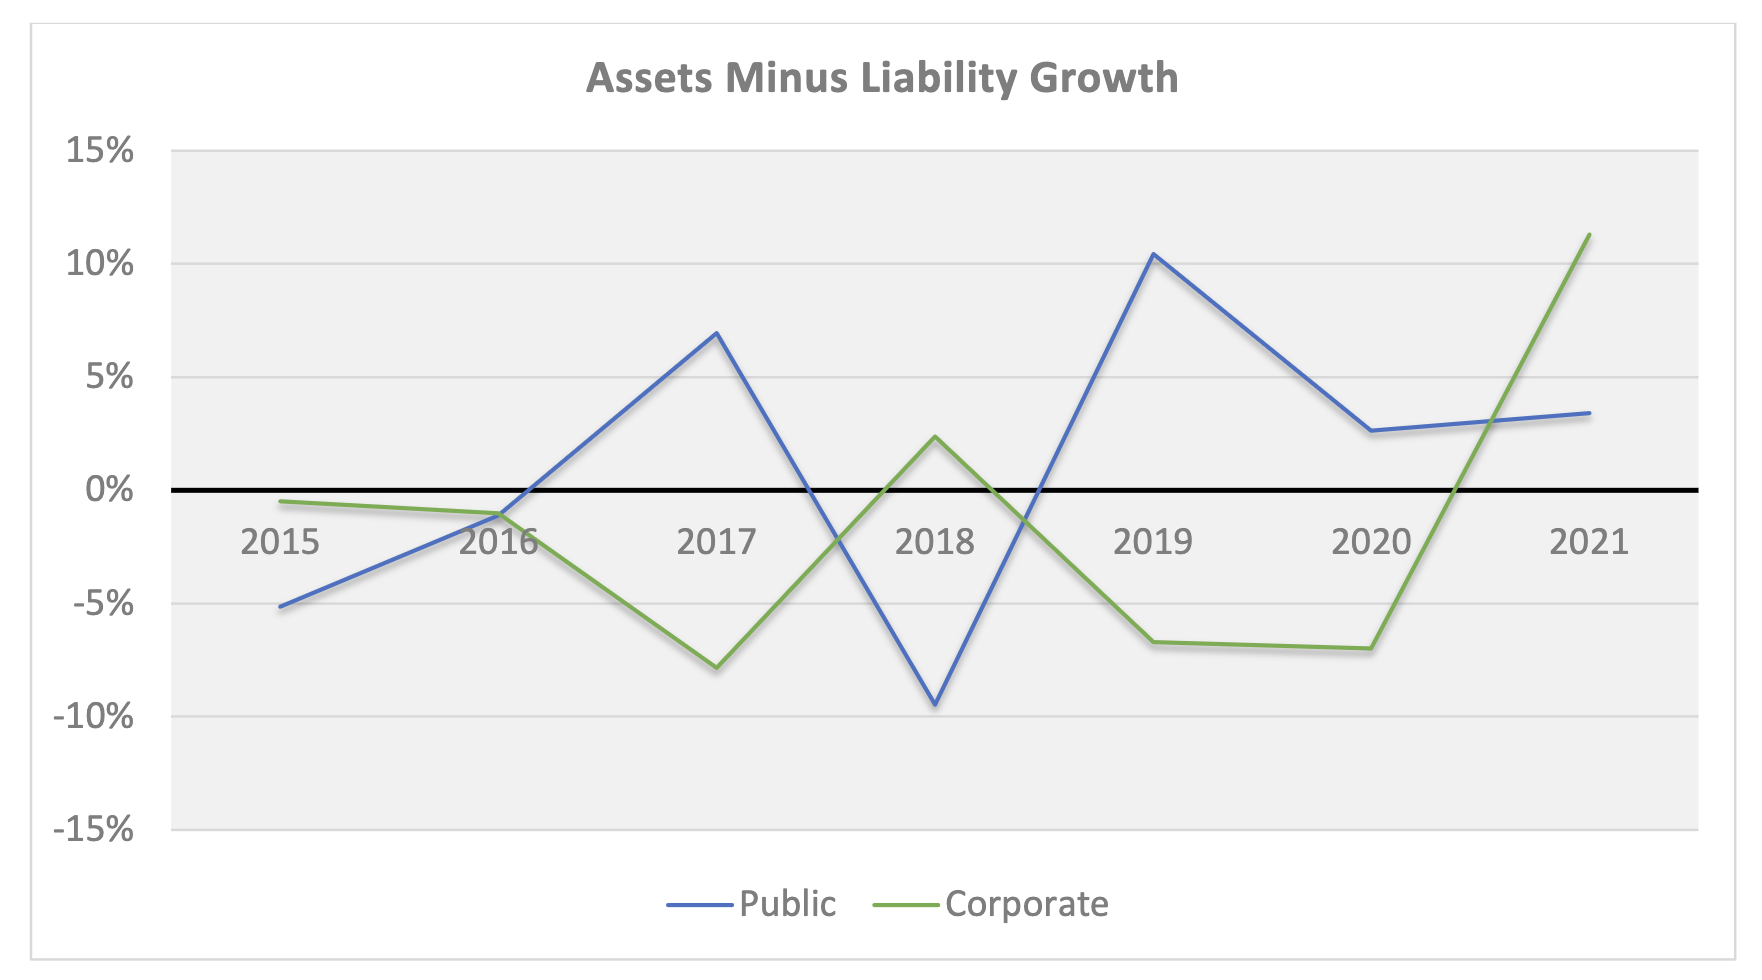
Footnote: The measurement of asset growth to liability growth is an annual calculation beginning on December 31, 2015. For periods shorter than 1-year, the observation is a YTD calculation.
Pension Confusion - The Problem with Averages
Pension Confusion: The Problem with Averages Most pension have assets managed to generic market index benchmarks and/or liabilities. In both cases, the focus of these assets is to match or...
Source: Pension Confusion - The Problem with Averages
Pension Confusion:
The Problem with Averages
Most pension have assets managed to generic market index benchmarks and/or liabilities. In both cases, the focus of these assets is to match or beat some average (i.e., duration, total return, YTM). Unfortunately, few understand how these averages can be misleading if not erroneous.
Liabilities (Duration Matching)
Duration matching is a common LDI strategy for pensions where the plan sponsor looks to immunize their bond portfolio versus the interest rate sensitivity of the liabilities they are funding. To achieve this interest rate immunization, the strategy is to match the average duration of the liabilities. There are at least four problems here:
The actuary does not provide the average duration of projected benefits.
The actuarial report usually comes out annually… months after the fiscal year. Duration is a present value calculation that changes with interest rates and time, both of which change daily.
Assets do not fund gross projected benefits. They fund net benefits after contributions. This net liability is not calculated by the actuary which can be much different than the gross liability in dollars and duration especially for Corporate and Public pension plans that have a high contribution rate. Pension assets need to know what they are funding. The economic reality is… assets are funding net liabilities after contributions!
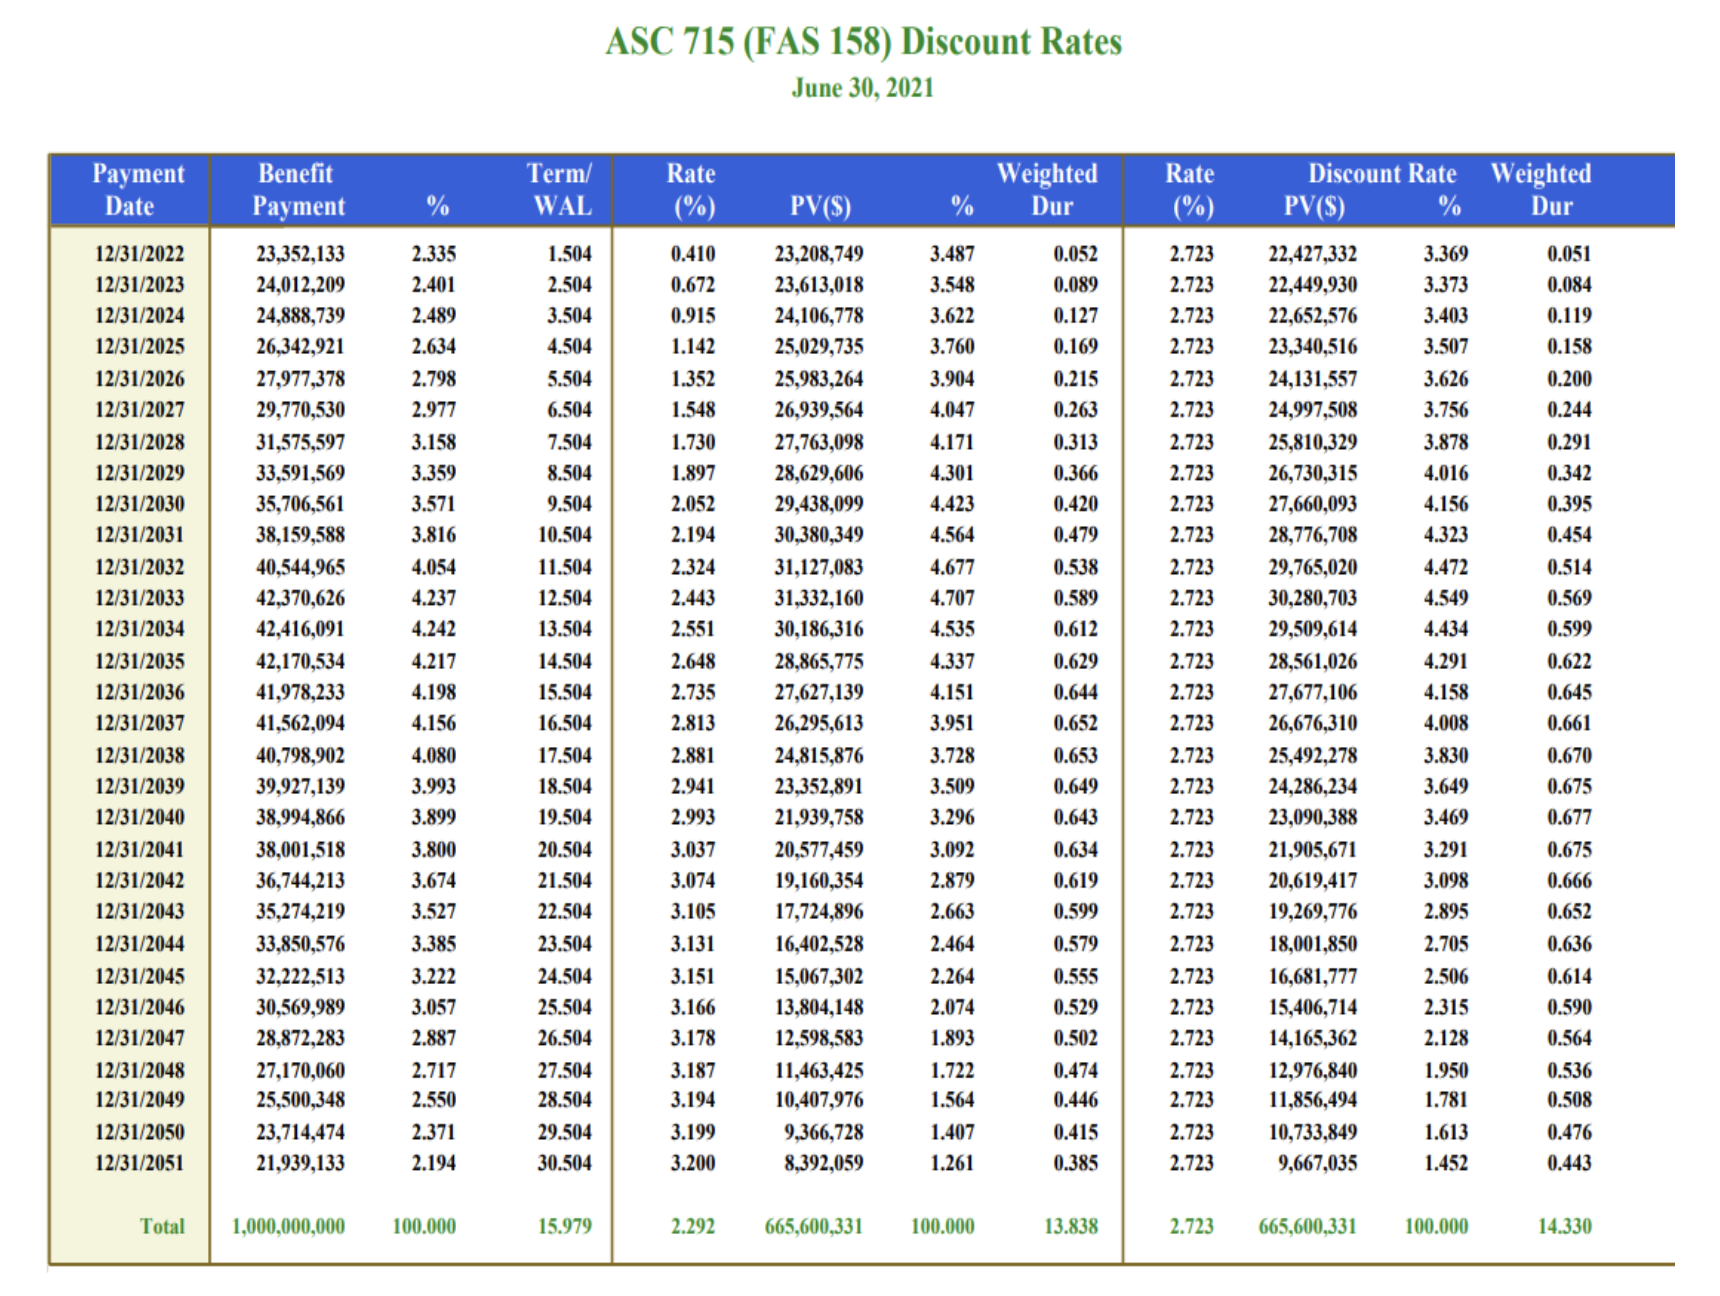
Duration is a present value calculation based on a discount rate yield curve. ASC 715 is the most prominent and acceptable for corporate and multiemployer pension plans. Moreover, Moody’s has adopted ASC 715 discount rates to assess municipal credits instead of the ROA discount rate commonly used under GASB accounting. FASB requires that this ASC 715 discount rate yield curve be converted to a single rate average discount rate. The duration of this single discount rate is certainly different than the average of a multiple discount rate yield curve. In the sample liability term structure shown on the next page priced with ASC 715 discount rates, we calculate:
| ASC 715 Yield Curve | Single Rate | Difference | |
|---|---|---|---|
| Average Yield | 2.29% | 2.72% | 0.43% |
| Duration | 13.84 years | 14.34 years | 0.50 years |
Note: For an accurate immunization, you need to match the duration of the ASC 715 yield curve (all liabilities) not the single rate average duration.
Solution: $ Duration Matching with Modified Duration
Maturity is an indicator of interest rate risk because longer maturity bonds move more in price than shorter maturity bonds given a change in yield. However, maturity is not a good measure of interest rate risk because maturity only considers the timing of the final principal cash flow at maturity and ignores the sizes and timing of all the other cash flows leading up to maturity.
The present value or price volatility of pension liabilities behaves just like bonds. A pension liability schedule is a term structure or yield curve of ASC 715 rates. Therefore, the interest rate risk in a pension liabilities schedule (actuarial projected benefits) can be matched with a portfolio of bonds.
A better measure for interest rate risk in the form of price sensitivity is called Modified Duration. Modified Duration considers all the bonds cash flows and is the weighted average time to receipt of all the cash flows, with the weights being the present values of the cash flows divided by a factor of (1+Y) where Y is the annual yield to maturity of the bond.
Modified Duration represents the percentage price change in market value in response to a change in the asset or liability yield. By weighting modified duration by the market value of the holding, that is, by multiplying the market value of the position by its modified duration, we get dollar-weighted duration. This dollar-weighted duration is known as Dollar Duration and represents the actual dollar change in market value for a bond given a change in its yield. Dollar duration is typically expressed in the dollar value change per one basis point change in yield (DV01).
The major advantages of using dollar duration are that it is additive and better suited for asset liability management. Dollar duration extends easily from individual securities to entire portfolios. The dollar duration of a portfolio is simply the sum of the dollar durations of all the individual holdings. The dollar duration of a bond portfolio can be matched to the dollar duration of pension liabilities. Bond durations cap out around 20-years so for liabilities with durations longer than 20-years it is not possible to match duration but… it is possible to match the Dollar duration of liabilities with durations longer than 20-years. Therefore, Dollar duration is very useful in asset liability management for liability driven investors such as defined benefit pension plans.
Ryan ALM uses dollar duration matching to help reduce pension volatility as defined as the dollar value difference in interest rate sensitivity between the present value of assets and liabilities. Ryan ALM starts by creating a Custom Liability Index (CLI) for each pension client. The Custom Liability Index is derived from the unique liabilities cash flow schedule provided by the plan actuary. The CLI measures and monitors the change in present value for the liabilities given a change in ASC 715 discount rates and is the proper benchmark for a plan sponsor and their liability driven investor(s).
Once we have determined the interest rate risk in the liabilities, the next step is to ensure that the bond portfolio has the same amount of interest rate risk as liabilities in order to reduce volatility between the present value of assets and liabilities. Ryan ALM builds a bond portfolio called the Liability Beta Portfolio (LBP) that matches the cash flows of the bonds to the liability cash flows (benefit payments). Since dollar duration is additive, we can set the dollar duration of the bond portfolio equal to the dollar duration of liabilities. Ryan ALM believes that cash flow matching liabilities with bond cash flows along with the use of dollar duration is a lower cost and lower volatility approach to pension asset liability management. It is certainly more accurate than traditional duration matching to immunize interest rate sensitivity.
Ryan ALM Pension Monitor 2Q ‘21
Ryan ALM Pension Monitor (Through June 30, 2021) Pension plan liabilities need to be measured and monitored regularly. Without knowledge of plan liabilities, the allocation of plan assets cannot be...
Source: Ryan ALM Pension Monitor 2Q
(Through June 30, 2021)
Pension plan liabilities need to be measured and monitored regularly. Without knowledge of plan liabilities, the allocation of plan assets cannot be done appropriately.
The funded ratio/status of pension plans are present value calculations. Each type of plan is governed by accounting rules and actuarial practices, which determine the discount rate used to calculate the present value of liabilities. Single employer corporate plans are under ASC 715 (FASB) discount rates (AA corporate zero-coupon yield curve); multiemployer plans and public plans use the ROA (return on asset assumption) as the liability discount rate. The difference in liability growth between these plans can be quite significant, which will affect funded status and contribution levels.
The table below compares these different liability growth rates (based on 12-year average duration) versus the asset growth rate based on the P&I asset allocation survey of the top 1,000 plans. The graph below shows the contrasting annual differences of asset versus liability growth for corporate and public plans since 2015.
| ASSET ALLOCATION | YTD Return | Corporate | Public | Union |
|---|---|---|---|---|
|
Domestic Stock International Stock Global Equity Domestic Fixed Income Global Fixed Income Cash Private Equity Real Estate Equity* Other |
-20.0% -19.2% -20.5% -10.4% -14.8% -0.1% 6.2% 6.9% 6.2% |
11.1% 6.5% 10.4% 46.7% 1.3% 2.0% 8.5% 4.1% 9.4% |
24.4% 16.3% 5.3% 20.2% 1.7% 2.0% 12.7% 7.9% 9.5% |
24.7% 8.6% 11.4% 28.0% 0.9% 0.6% 8.2% 9.3% 8.3% |
| TOTAL ASSETS Growth Rate | -9.2% | -9.5% | -10.3% | |
| LIABILITIES Growth Rate | -18.3% | 3.7% | 3.7% | |
| Asset Growth – Liability Growth | 9.1% | -13.2% | -14.0% |
Index Benchmarks: Domestic Stock = S&P 500; Int’l Stock = EAFE, Global Equity = All Country World; Domestic Fixed Income = BB Aggregate; Global Fixed Income = FTSE World Gov’t (unhedged); Cash = 3 mo. T-Bill; Private Equity =10-year return for the R2500 + 2%; Real estate Equity =NCREIF Index; Alternative Investments and Other = CPI & 3%.
Liabilities: ASC 715 discount rate, produced by Ryan ALM, is 2.35% and GASB ROA is 7.0% annually
Footnote: The measurement of asset growth to liability growth is an annual calculation beginning on December 31, 2015. For periods shorter than 1-year, the observation is a YTD calculation.