
Ryan ALM
White Papers
Pension Confusion - The Problem with Averages
Pension Confusion: The Problem with Averages Most pension have assets managed to generic market index benchmarks and/or liabilities. In both cases, the focus of these assets is to match or...
Source: Pension Confusion - The Problem with Averages
Pension Confusion:
The Problem with Averages
Most pension have assets managed to generic market index benchmarks and/or liabilities. In both cases, the focus of these assets is to match or beat some average (i.e., duration, total return, YTM). Unfortunately, few understand how these averages can be misleading if not erroneous.
Liabilities (Duration Matching)
Duration matching is a common LDI strategy for pensions where the plan sponsor looks to immunize their bond portfolio versus the interest rate sensitivity of the liabilities they are funding. To achieve this interest rate immunization, the strategy is to match the average duration of the liabilities. There are at least four problems here:
The actuary does not provide the average duration of projected benefits.
The actuarial report usually comes out annually… months after the fiscal year. Duration is a present value calculation that changes with interest rates and time, both of which change daily.
Assets do not fund gross projected benefits. They fund net benefits after contributions. This net liability is not calculated by the actuary which can be much different than the gross liability in dollars and duration especially for Corporate and Public pension plans that have a high contribution rate. Pension assets need to know what they are funding. The economic reality is… assets are funding net liabilities after contributions!
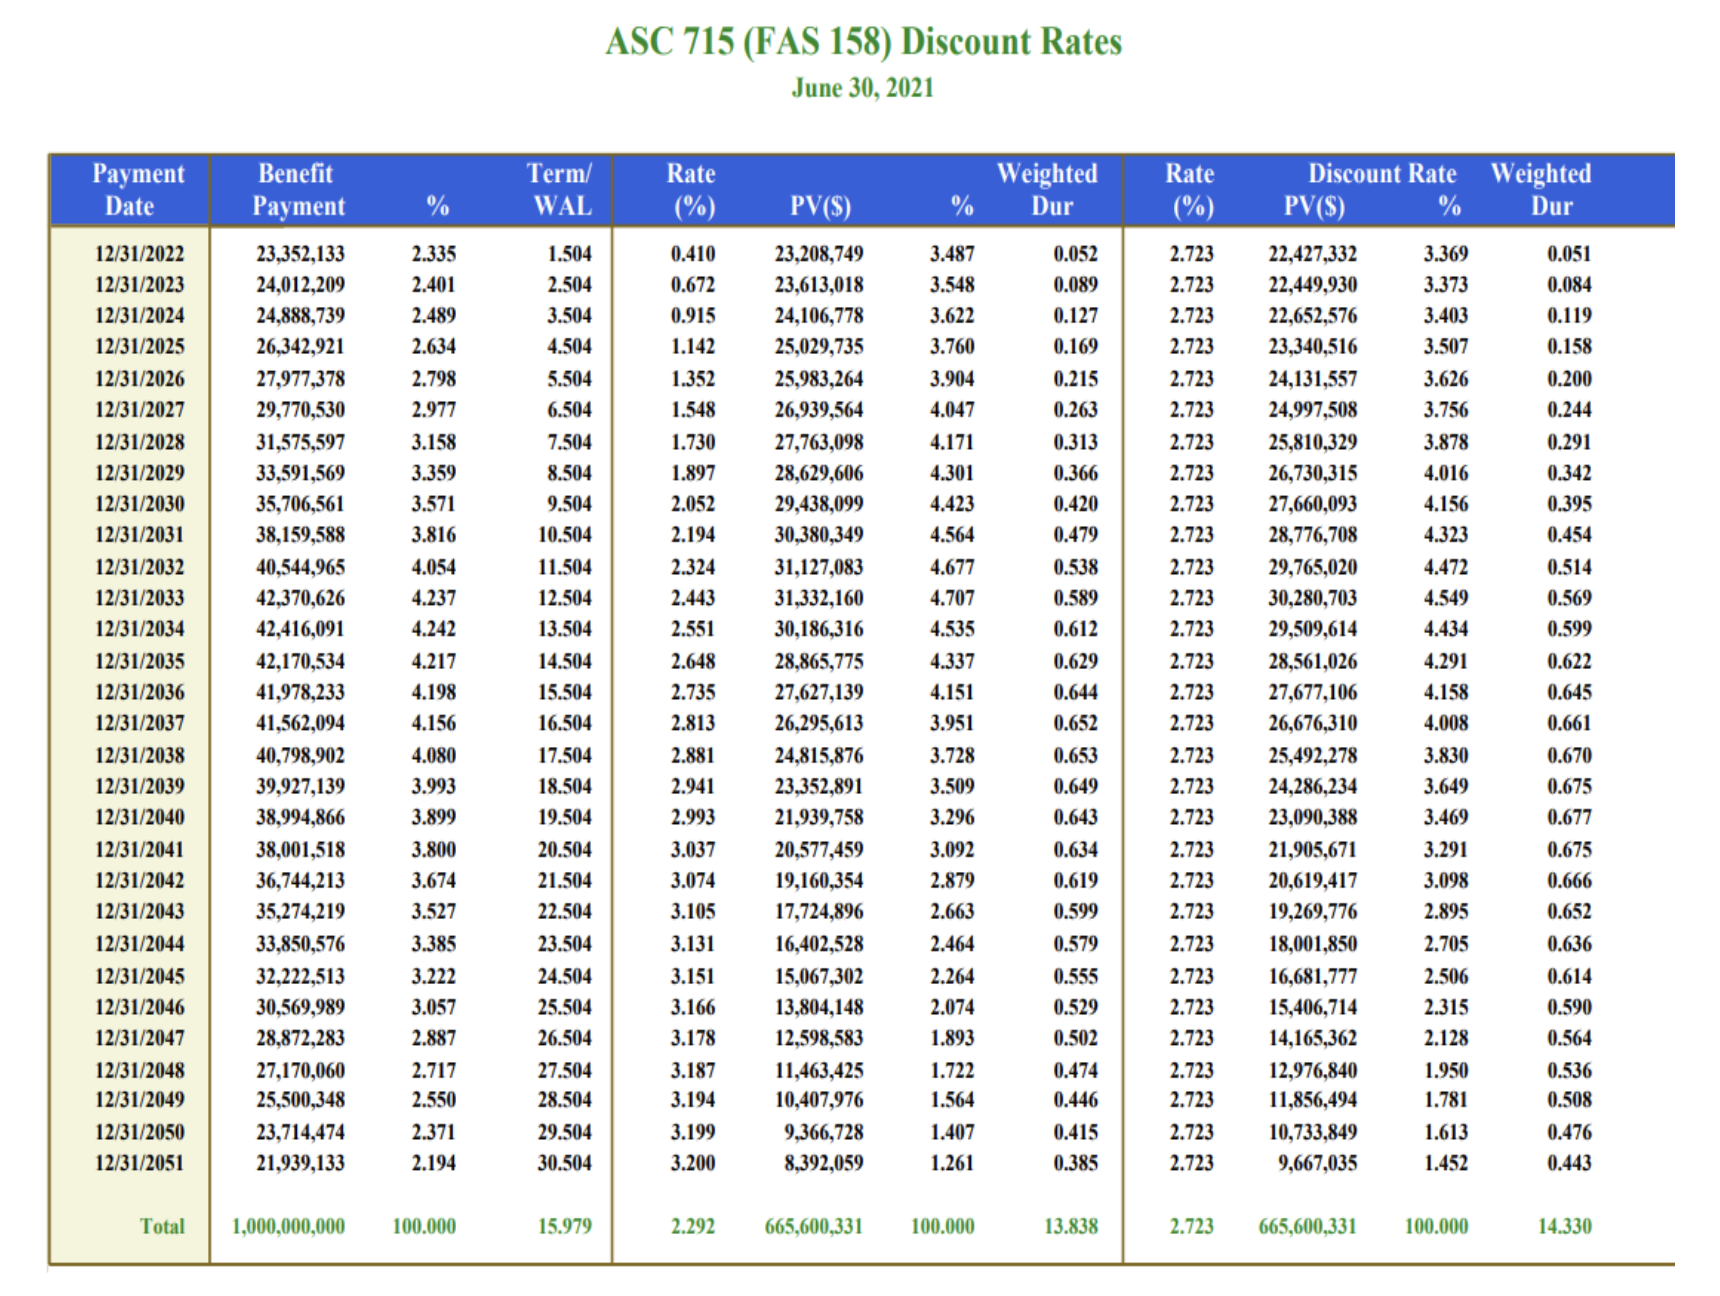
Duration is a present value calculation based on a discount rate yield curve. ASC 715 is the most prominent and acceptable for corporate and multiemployer pension plans. Moreover, Moody’s has adopted ASC 715 discount rates to assess municipal credits instead of the ROA discount rate commonly used under GASB accounting. FASB requires that this ASC 715 discount rate yield curve be converted to a single rate average discount rate. The duration of this single discount rate is certainly different than the average of a multiple discount rate yield curve. In the sample liability term structure shown on the next page priced with ASC 715 discount rates, we calculate:
| ASC 715 Yield Curve | Single Rate | Difference | |
|---|---|---|---|
| Average Yield | 2.29% | 2.72% | 0.43% |
| Duration | 13.84 years | 14.34 years | 0.50 years |
Note: For an accurate immunization, you need to match the duration of the ASC 715 yield curve (all liabilities) not the single rate average duration.
Solution: $ Duration Matching with Modified Duration
Maturity is an indicator of interest rate risk because longer maturity bonds move more in price than shorter maturity bonds given a change in yield. However, maturity is not a good measure of interest rate risk because maturity only considers the timing of the final principal cash flow at maturity and ignores the sizes and timing of all the other cash flows leading up to maturity.
The present value or price volatility of pension liabilities behaves just like bonds. A pension liability schedule is a term structure or yield curve of ASC 715 rates. Therefore, the interest rate risk in a pension liabilities schedule (actuarial projected benefits) can be matched with a portfolio of bonds.
A better measure for interest rate risk in the form of price sensitivity is called Modified Duration. Modified Duration considers all the bonds cash flows and is the weighted average time to receipt of all the cash flows, with the weights being the present values of the cash flows divided by a factor of (1+Y) where Y is the annual yield to maturity of the bond.
Modified Duration represents the percentage price change in market value in response to a change in the asset or liability yield. By weighting modified duration by the market value of the holding, that is, by multiplying the market value of the position by its modified duration, we get dollar-weighted duration. This dollar-weighted duration is known as Dollar Duration and represents the actual dollar change in market value for a bond given a change in its yield. Dollar duration is typically expressed in the dollar value change per one basis point change in yield (DV01).
The major advantages of using dollar duration are that it is additive and better suited for asset liability management. Dollar duration extends easily from individual securities to entire portfolios. The dollar duration of a portfolio is simply the sum of the dollar durations of all the individual holdings. The dollar duration of a bond portfolio can be matched to the dollar duration of pension liabilities. Bond durations cap out around 20-years so for liabilities with durations longer than 20-years it is not possible to match duration but… it is possible to match the Dollar duration of liabilities with durations longer than 20-years. Therefore, Dollar duration is very useful in asset liability management for liability driven investors such as defined benefit pension plans.
Ryan ALM uses dollar duration matching to help reduce pension volatility as defined as the dollar value difference in interest rate sensitivity between the present value of assets and liabilities. Ryan ALM starts by creating a Custom Liability Index (CLI) for each pension client. The Custom Liability Index is derived from the unique liabilities cash flow schedule provided by the plan actuary. The CLI measures and monitors the change in present value for the liabilities given a change in ASC 715 discount rates and is the proper benchmark for a plan sponsor and their liability driven investor(s).
Once we have determined the interest rate risk in the liabilities, the next step is to ensure that the bond portfolio has the same amount of interest rate risk as liabilities in order to reduce volatility between the present value of assets and liabilities. Ryan ALM builds a bond portfolio called the Liability Beta Portfolio (LBP) that matches the cash flows of the bonds to the liability cash flows (benefit payments). Since dollar duration is additive, we can set the dollar duration of the bond portfolio equal to the dollar duration of liabilities. Ryan ALM believes that cash flow matching liabilities with bond cash flows along with the use of dollar duration is a lower cost and lower volatility approach to pension asset liability management. It is certainly more accurate than traditional duration matching to immunize interest rate sensitivity.
Ryan ALM Pension Monitor 2Q ‘21
Ryan ALM Pension Monitor (Through June 30, 2021) Pension plan liabilities need to be measured and monitored regularly. Without knowledge of plan liabilities, the allocation of plan assets cannot be...
Source: Ryan ALM Pension Monitor 2Q
(Through June 30, 2021)
Pension plan liabilities need to be measured and monitored regularly. Without knowledge of plan liabilities, the allocation of plan assets cannot be done appropriately.
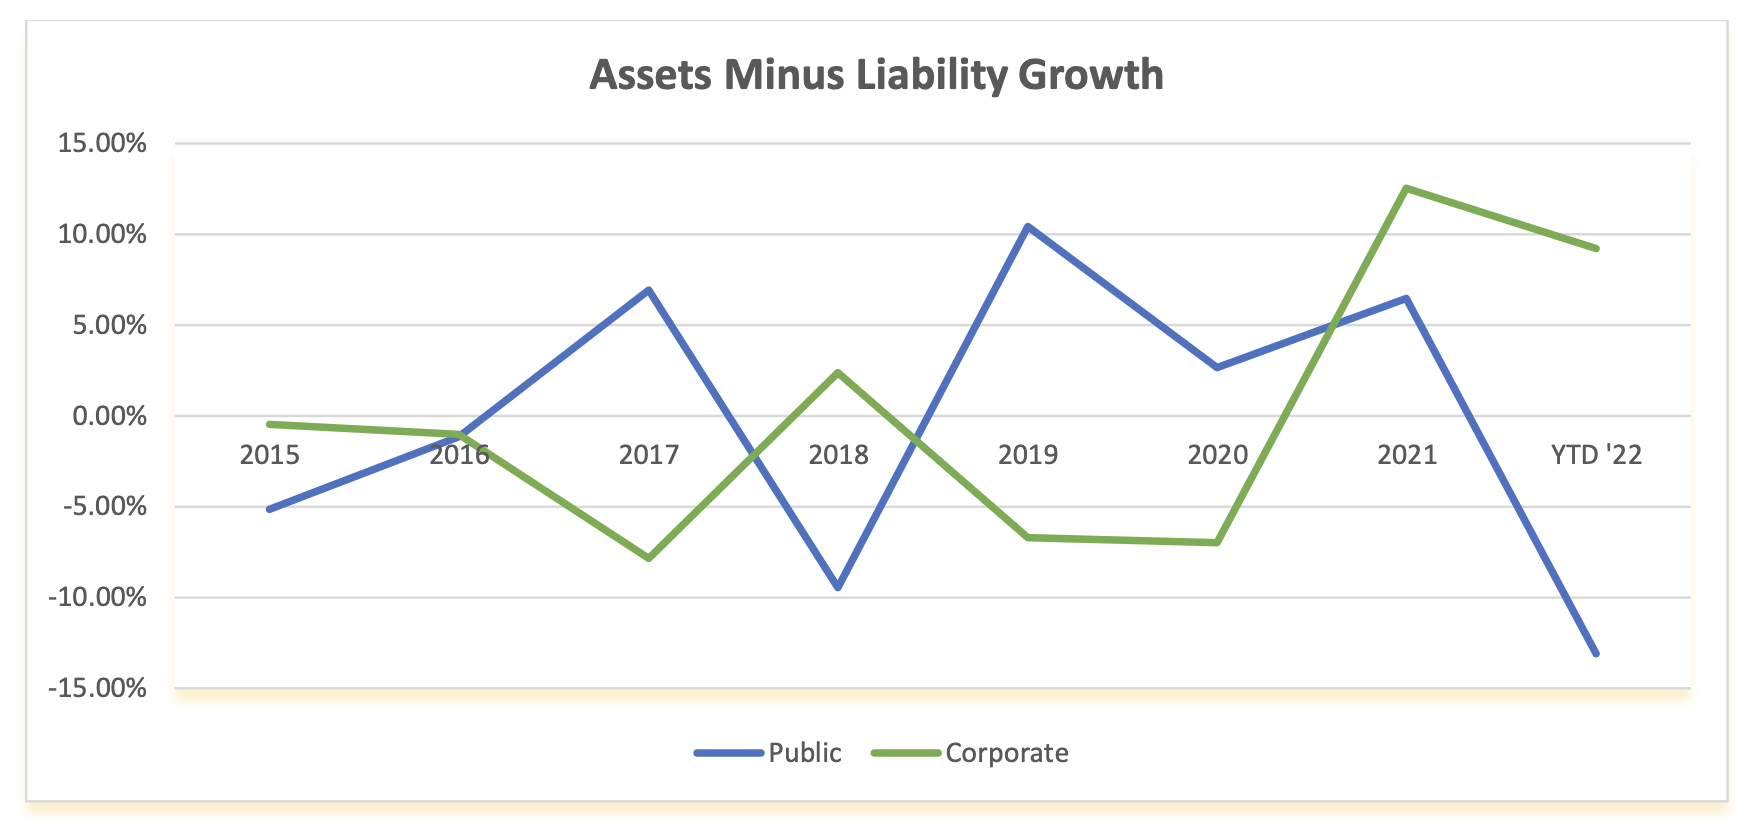
The funded ratio/status of pension plans are present value calculations. Each type of plan is governed by accounting rules and actuarial practices, which determine the discount rate used to calculate the present value of liabilities. Single employer corporate plans are under ASC 715 (FASB) discount rates (AA corporate zero-coupon yield curve); multiemployer plans and public plans use the ROA (return on asset assumption) as the liability discount rate. The difference in liability growth between these plans can be quite significant, which will affect funded status and contribution levels.
The table below compares these different liability growth rates (based on 12-year average duration) versus the asset growth rate based on the P&I asset allocation survey of the top 1,000 plans. The graph below shows the contrasting annual differences of asset versus liability growth for corporate and public plans since 2015.
| ASSET ALLOCATION | YTD Return | Corporate | Public | Union |
|---|---|---|---|---|
|
Domestic Stock International Stock Global Equity Domestic Fixed Income Global Fixed Income Cash Private Equity Real Estate Equity* Other |
-20.0% -19.2% -20.5% -10.4% -14.8% -0.1% 6.2% 6.9% 6.2% |
11.1% 6.5% 10.4% 46.7% 1.3% 2.0% 8.5% 4.1% 9.4% |
24.4% 16.3% 5.3% 20.2% 1.7% 2.0% 12.7% 7.9% 9.5% |
24.7% 8.6% 11.4% 28.0% 0.9% 0.6% 8.2% 9.3% 8.3% |
| TOTAL ASSETS Growth Rate | -9.2% | -9.5% | -10.3% | |
| LIABILITIES Growth Rate | -18.3% | 3.7% | 3.7% | |
| Asset Growth – Liability Growth | 9.1% | -13.2% | -14.0% |
Index Benchmarks: Domestic Stock = S&P 500; Int’l Stock = EAFE, Global Equity = All Country World; Domestic Fixed Income = BB Aggregate; Global Fixed Income = FTSE World Gov’t (unhedged); Cash = 3 mo. T-Bill; Private Equity =10-year return for the R2500 + 2%; Real estate Equity =NCREIF Index; Alternative Investments and Other = CPI & 3%.
Liabilities: ASC 715 discount rate, produced by Ryan ALM, is 2.35% and GASB ROA is 7.0% annually
Footnote: The measurement of asset growth to liability growth is an annual calculation beginning on December 31, 2015. For periods shorter than 1-year, the observation is a YTD calculation.
Pension Alert: Secure Funded Status!
Private Pension Alert: Secure Funded Status! The pension objective is to secure benefits in a cost-efficient manner! Many private pension plans are in the best funded status since 1999. It...
Source: Pension Alert: Secure Funded Status!
Private Pension Alert: Secure Funded Status!
The pension objective is to secure benefits in a cost-efficient manner!
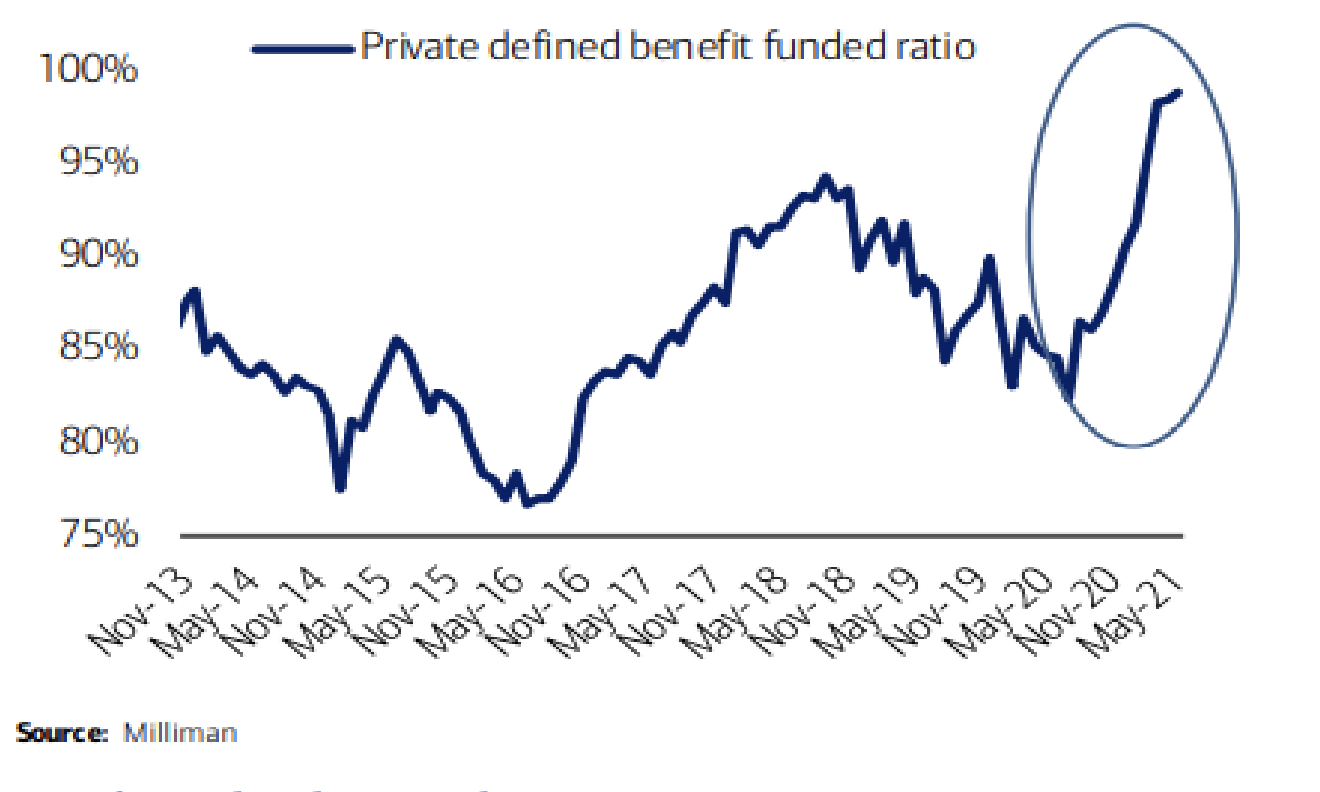
Many private pension plans are in the best funded status since 1999. It should be a high priority to secure this funded status NOW if not enhance it.
Secure Benefits and Reduce Funding Costs
There are basically only two ways to secure pension benefits: insurance annuities and defeasement (through cash flow matching benefit payments). Ryan ALM has been a pension watchdog and written many articles on the benefits of cash flow matching. Insurance buyout annuities (IBA) are expensive, but corporations are purchasing IBAs in record amounts to get rid of the high and rising PBGC premiums caused by the MAP 21 legislation of July 6, 2012 and to avoid longevity risk. However, corporations would be wise to do a cost analysis of the IBA versus a cash flow matching defeasance. The typical IBA prices Retired Lives (liabilities) at a discount rate of ASC 715 (AA corporate zero-coupon yield curve) plus a 3% to 4% premium. According to our calculations, a defeasance strategy (cash flow matching) using investment grade corporates would provide a cost savings of about 30% versus IBA, which is a very significant cost savings and should be reviewed. Such cost savings are immediate while the IBA savings of eliminating PBGC premiums is in the future.
Cash flow matching (using the Ryan ALM Liability Beta Portfolio™) is a cost optimization process where we go through numerous iterations to find the optimal cost savings that will fund each and every monthly Retired Lives benefit payment. Since liabilities are priced like bonds (ASC 715 discount rates) they behave like bonds. As a result, bonds become the proper assets to match and fund liabilities. Bond math tells us that the longer the maturity and the higher the yield… the lower the cost. Our LBP model skews the portfolio weights to longer maturities such that a 30-year coupon bond will partially fund 29 years of benefits through interest income. The same is true for a 29-year, 28-year, 27-year bond, etc. plus principal cash flow at maturities adds even more cash flow. Cash flow matching reduces funding risk because the bond cash flows are certain and the bonds may be held to maturity. Moreover, cash flow matching is the matching and funding of future values which do not change with changes in interest rates.
Reduce and Stabilize Contribution Costs
The LBP will match each and every monthly benefit payment in the liability schedule it is funding (Retired Lives). This will greatly reduce funded status volatility which will help stabilize contribution costs. The LBP is comprised of investment grade bonds skewed to longer maturities and A/BBB credits, so it will out yield liabilities priced as AA corporates (ASC 715 discount rates) by 50 – 100+ bps. Importantly, this extra yield creates an excess return (Alpha), which enhances the funded status, reduces contribution costs and could reduce the PBGC variable premium.
Only cash flow matching (defeasance) can secure benefits and reduce funding costs with certainty! By matching liabilities (benefit payments) it reduces risk accordingly.
Our LBP has numerous benefits that best achieve the true pension objective:
Cash flow matching the liability benefit payment schedule (Retired Lives) at the lowest cost is the ideal way to manage assets for a pension plan. Since Retired Lives are the most certain and most important (most tenured employees) liabilities, cash flow matching is a perfect fit given the certainty of the bond cash flows. Since the pension objective is a cost focus, cash flow matching would produce the optimal cost savings. We urge corporations to do a cost analysis before they buy an IBA! Even if an IBA is the future goal then the LBP would provide the perfect pension risk transfer of assets to an IBA.
Problem: Immunization (Duration Matching)
Duration matching is a strategy that attempts to reduce financial statement volatility while cash flow matching is a strategy for reducing funding volatility. Another difference is that duration is an ever-changing number so with duration matching the manager must continually rebalance for duration drift, while cash flow matching has the advantage that bond cash flows do not change. When we use duration matching to hedge financial statement volatility, we make assumptions that the yield levels of the liability hedging vehicle will move in parallel with liability yields. The fact is yields for different credits, and maturities do not all move in parallel. To facilitate benefits funding management ALM should focus on the liability yield curve or term structure which is exactly what the Ryan ALM custom liabilities cash flow matching and $ duration matching portfolios do in the most cost-efficient manner.
Traditional duration matching has definite liability cash flow mismatches and cost inefficiencies. Since the longest duration coupon bonds are around 19-years today, duration matching is forced to use Treasury zero-coupon bonds (STRIPS) to fund any liability past 19-years. Since Treasuries are the lowest yielding bonds, they are the highest cost bonds to fund and match liabilities. Moreover, duration is a present value (PV) calculation that is very interest rate sensitive. Duration matching is focused on matching liability % growth rates and not on matching and funding benefit payments (future values) and dollar growth rates.
Solution: Dollar Duration Matching (DDM)
DDM matches the dollar value change per basis point change in yield for assets with the dollar value change per basis point change in yield for liabilities. When the dollar duration of assets is matched to the dollar duration of liabilities for every year in the term structure of liabilities, then DDM is in its most precise form. That would be the equivalent of 30 Key Rate durations… one at every point along the liabilities yield cure or benefit payment schedule. The Ryan ALM DDM approach offers several value-added differences:
Actuarial Projections - We use the actuarial projected benefits of our clients and not a generic bond index benchmark.
Modified durations - to be an effective price sensitivity measurement, duration must be modified. Modified Duration measures the percent change in market value or present value for future value cash flows given a 100-basis point movement in yield.
The Ryan ALM DDM approach greatly improves the accuracy of Key Rate duration matching by matching the dollar value changes in liabilities with the dollar value changes in assets across the term structure and yield curve for liabilities. The liabilities are measured and monitored by using a Custom Liability Index (CLI) to more precisely calculate the dollar value (PV) movement in assets versus liabilities given any movement in interest rates.
Duration vs. Cash Flow Matching
Pension Solutions: Dollar Duration Matching and Cash Flow Matching Ryan ALM believes that the objective for a defined benefit pension is to fund and secure benefits in a cost-effective manner...
Source: Duration vs. Cash Flow Matching
Pension Solutions:
Dollar Duration Matching and Cash Flow Matching
Ryan ALM believes that the objective for a defined benefit pension is to fund and secure benefits in a cost-effective manner. Pension management is an assets vs. liabilities objective rather than assets versus generic market indexes objective. Pension asset/liability management (ALM) starts with understanding the pricing and interest rate sensitivity of liabilities and continues with measuring and monitoring such liabilities. There are two primary asset/liability bond strategies in use today: Duration Matching and Cash Flow Matching.
Duration Matching
The purpose of duration matching is an attempt to match the interest rate risk sensitivity of assets to liabilities. The objective is to have the market value or PV changes (growth rate) in the bond portfolio match the market value or PV changes (growth rate) in liabilities for a given change in interest rates. Many fixed income managers attempt to match the average duration of the bond portfolio to the average duration of a bond market index with a similar duration to liabilities (i.e., Bloomberg Barclays long Corporate index). They use the generic bond index as a proxy for liabilities. There are several problems with this strategy.
The fatal flaws in this approach are:
a generic bond index cannot replicate any client’s unique liability cash flows. Client’s liabilities are like snowflakes: different labor force, salaries, mortalities and plan amendments.
average durations give erroneous information because there are an infinite number of combinations of maturities for a bond portfolio that can all have the same average duration, but they will not have the same risk/reward profile.
duration matching is only accurate for small parallel shifts in the yield curve. But the yield curve rarely moves an equal number of basis points at every point along the curve. For more info, Ron Ryan wrote a research paper “The Seven Flaws of Duration” while head of Ryan Labs… see the Ryan ALM website/insights/white papers/classics.
Bond management evolved to remedy these flaws by using Key Rate Durations which attempts to match the duration of multiple points along the yield curve. Key Rate Duration is an improvement over using a single average duration, but it still has several deficiencies:
Actuaries usually do not provide the average duration of liabilities and the projected benefits in their annual actuarial report… reason why generic bond indexes are used.
Matching key rate durations of a generic market index = wrong Key Rate Durations.
Duration is a present value calculation requiring pricing each projected benefit with a discount rate yield curve (i.e., ASC 715 discount rates). As a result, 30 annual benefit payments require 30 separate discount rates.
Duration must be modified (duration/1+YTM) to use as a price return measurement.
Modified duration is a price return measurement and does not include income.
Dollar Duration Matching (DDM)
DDM matches the Dollar Value change per basis point change in yield for assets with the Dollar Value change per basis point change in yield for liabilities. When the Dollar Duration of assets is matched to the Dollar Duration of liabilities for every year in the term structure of liabilities, then DDM is the most precise form of Key Rate duration matching because it matches the Key Rate durations at every point along the liabilities yield cure or benefit payment schedule (30 years = 30 key rate durations). The Ryan ALM approach offers several value-added differences:
Actuarial Projections - We use the actuarial projected benefits of our clients and not a generic bond index.
Modified durations - to be an effective price sensitivity measurement, duration must be modified. Modified Duration measures the percent change in market value or
Dollar duration - our objective here is to match the dollar value change per basis point in assets and liabilities in every maturity on the projected benefit schedule.
The Ryan ALM DDM approach greatly improves the accuracy of Key Rate duration matching by matching the Dollar Value changes in liabilities with the Dollar Value changes in assets across the term structure and yield curve for both assets and liabilities. The liabilities are represented by using a Custom Liability Index to more precisely measure and monitor the dollar value movement in assets versus liabilities given any movement in interest rates.
Cash Flow Matching (CFM)
Ryan ALM believes that the objective for a defined benefit pension is to fund and secure benefits when due in a cost-efficient manner. Ryan ALM does not believe that bonds are performance assets. The value in bonds is in their known and scheduled cash flows which is why cash flow matching has been used as a major strategy for hedging liabilities for many decades (i.e., dedication, defeasance). It is the matching and funding of benefits (future values) that is of primary concern. As such, future values are not interest rate sensitive… a major benefit of cash flow matching. Cash flow driven investing (CDI) dominates the way European pensions are managed under IASB accounting standards. Key Rate Duration using Dollar Duration is great for matching market value (PV) movements between assets and liabilities but what about funding liability payments (future values)?
Since the primary value in bonds is in the certainty of their cash flows, Ryan ALM will cash flow match (fund) projected benefit payments chronologically which provide the plan sponsor with numerous benefits:
Secures the benefits,
Significantly de-risks the plan,
Reduces funding costs significantly,
Reduces volatility of funded ratio and contributions,
Buys time for performance assets (Alpha) to grow unencumbered,
Hedges pension inflation on Retired Lives, Active Lives and Expenses, and
No interest rate risk since LBP is funding future values (benefit payments).
A major cash flow matching benefit is that it buys time for the performance assets to grow unencumbered. History tells us that given time risky assets perform better (i.e., S&P 500). History also tells us if the Alpha assets can grow without any dilution, they perform much better (dividends reinvested > 50% of the S&P 500 growth in the last 50 years). If interest rates rise, cash flow matching can reinvest any excess cash flows at the then higher yields (lower costs) while bonds managed with a purely total return focus would get hurt with lower price returns.
Solutions
Ryan ALM uses a turnkey system approach to asset/liability management for defined benefit pensions:
ASC 715 Discount Rates – Ryan ALM is one of few vendors providing ASC 715 discount rates (AA corporate zero-coupon bonds). We will price each annual projected benefit payment on a monthly basis.
Custom Liability Index (CLI) - Ryan ALM creates a Custom Liability Index (CLI) for each client based on their actuarial projected benefits. We do not use generic market indexes because that would be assets vs. assets. We measure and monitor the performance of assets versus liabilities. The CLI provides all of the calculations needed for either duration matching or cash flow matching. The CLI will calculate YTM, duration, growth rate and interest rate sensitivity for each annual projected benefit as a term structure as well as total liabilities.
Liability Beta Portfolio™ (LBP) – our LBP will cash flow match projected benefits either chronologically or as a dollar duration match using our proprietary LBP cost optimization model that will reduce funding costs significantly.
Whether it is dollar duration matching or cash flow matching, Ryan ALM provides both products as part of our asset/liability management product line. Please contact us to learn how our turnkey system can enhance your pension fund.
Response to: Presidential Memo on Pensions
Response to: Presidential Memo on Pensions Mr. President, I applaud your memo of October 22 to the Secretaries of Treasury, Commerce and Labor. You gave them an order to review...
Source: Response to: Presidential Memo on Pensions
Response to: Presidential Memo on Pensions
Mr. President,
I applaud your memo of October 22 to the Secretaries of Treasury, Commerce and Labor. You gave them an order to review the Delphi pension matter and inform you “within 90 days of this memorandum of any appropriate action that may be taken, consistent with applicable law to (i) address affected Delphi retirees’ lost pension benefits and (ii) bring transparency to the decision to terminate the plan. This review shall include an evaluation of the feasibility of enacting legislation.”
The solution you are looking for can be found in the Butch Lewis Act (BLA) passed by the House through a bipartisan vote (all Democrats + 29 Republicans) on July 26, 2019 as H.R. 397. It has been awaiting approval by the Senate since then. The BLA would create a new agency under the Treasury Department called the Pension Rehabilitation Administration (PRA). The PRA would provide low-interest-rate loans to critical and declining multi-employer pensions at the 30-year Treasury rate plus a profit margin (@ 0.25%). The BLA would provide 100% payment of all retirees benefits in sharp contrast to the PBGC limit of $12,870 for a 30-years of services retiree ($35.75 x 12 months x years of service). The Council of Budget Office estimates the cost of the BLA at $34 billion (if no loans are repaid), which can be minimized by the fact that all PRA loans come with a profit margin. Even at $34 billion it is a small burden compared to the potential cost to cover 1.4 million workers’ pensions affected by the current pension crisis. The PBGC is not the answer… but the BLA is. I urge you to have the Senate approve the BLA legislation that is awaiting their approval for over 15 months now. Time is of the essence!
God Bless Pension America!
The Flaws of Bond Indexes…Benchmark, Bogey or Bogus?
The first bond indexes were born June 1973 created by Art Lipson (my boss) at Kuhn, Loeb. As my mentor, I owe Art much for his educational leadership. When Lehman...
Source: The Flaws of Bond Indexes…Benchmark, Bogey or Bogus?
The first bond indexes were born June 1973 created by Art Lipson (my boss) at Kuhn, Loeb. As my mentor, I owe Art much for his educational leadership. When Lehman purchased Kuhn, Loeb at the end of 1977 such indexes became the Lehman bond indexes. Since there was no bond exchange (still true today) you needed a Wall Street broker/dealer to create bond indexes because they knew how to price all the securities that comprised a bond index as well as calculate some of the difficult yield and duration calculations. In 1979 Lehman became the accepted bond index benchmark(s) for most U.S. institutions although Salomon (now Citigroup) and Merrill Lynch (now Bank of America) provided numerous bond indexes. These old traditional indexes have dictated the risk/reward of most bond managers for over 40 years. Investment bankers embraced these bond indexes as a way to win clients suggesting that any issuance of bonds would result in inclusion in their indexes. Through time these traditional bond indexes became garbage cans of investment banking as the index portfolios swelled to many thousands of bonds. Such bond indexes have structural flaws that should prevent them from being accepted as benchmarks for most institutions especially those with a liability objective:
Flaw: Weights
Traditional bond indexes use market weighting as their preferred valuation. In order to market weight a bond index you need two data requirements: end of day pricing of all bonds in the index and the current amount outstanding. Since there is no bond exchange end of day pricing is difficult. Different market vendors will all have different prices for the same bonds. This leads to different risk/reward behaviors. But the more difficult data, believe it or not, is the amount outstanding. As simple as it sounds, we do not know the amount outstanding for many issues at month-end rebalancing and calculation. Treasuries and Agencies are stripped thereby reducing the float on these bonds. Such information is provided delinquently (Treasuries) or not at all (Agencies). As a result, traditional bond indexes leave the original amount issued as the amount outstanding. A $10 billion Treasury issue may have only $4 billion left in float. Since bond indexes do not include STRIPS they will overweight Treasuries and Agencies coupon issues by not changing the original amount outstanding. This will skew the returns of the index accordingly. Corporate bonds have tenders, sinking funds and puts which could affect the amount outstanding. Usually such information is only reported annually in the 10-k. As a result, corporate bonds are never correctly updated if they face any of the principal reduction features. Mortgage-backed securities have monthly payments of principal (as regular amortizations and prepayments). Such information is reported after the end of the month several weeks delinquent. As a result, bond indexes have to use previous month’s data. Since prepayments affect total returns not only is the amount outstanding incorrect but the prepayment used for the current month is not accurate. Both inaccuracies lead to erroneous return calculations however small or large they may be. In truth, it is Mission Impossible to update accurately the amount outstanding of most bonds which in turn affects the accuracy of the risk/reward calculations.
Solution: Equal Weighted. When I left Lehman, I began to create equal-weighted bond indexes as the solution to the market weighting problems. Not only does equal-weighting have no weighting skewness or bias but it also best represents how most investors do their work (every bond is analyzed without weights as individual securities with an equal opportunity to be purchased). Moreover, why should one bond be superior to another bond in its portfolio weight in an unbiased index? Treasuries with their huge and growing issuances could and do dominate a bond index portfolio such that other bonds hardly affect the risk/returns of the index. Can you imagine how a Treasury 2-year auction of $44 billion skews the weights when compared to a $400 million corporate bond. That’s a ratio of 110 to 1. Is that really what investors want? All Treasuries, Agencies, Corporate and Mortgage-backed securities should be equal weighted in an index construction. The only question should be …do you weight these sectors differently?
Tracking Error
Given the enormous size of most traditional bond indexes (in number of issues) it is most difficult, if not impossible, to purchase such a portfolio. Most bonds in an index are not liquid. So, what do Index Funds and especially ETFs do to duplicate these illiquid bond indexes? Wall Street provides replication strategies that supposedly get you close to the risk/reward behavior of such indexes. In most replication models they only buy the most liquid securities and try to match the average duration of the index benchmark. Investors will then be faced with some degree of tracking error since you cannot purchase the index portfolio. Tracking error tends to measure the monthly average return differences. However, a five basis point monthly tracking error could be a 30 basis points annual return difference. The question remains why not build the index the way replication models work with only the most liquid issues?
Solution: Investible Indexes. All Ryan ALM Indexes are investible indexes as a rule of our index methodology. We only take the largest and most liquid issues as the composition in any of our indexes to insure liquidity which also insures better pricing. Equity indexes have certainly worked this way for several decades as the Dow Jones Industrial Average (30 stocks) and the S&P 500 are a testament.
Transparency
Flaw: Portfolio Averages
Summary statistics are critical data for bond asset managers. Most investors will build their bond portfolios around the average yields and durations displayed by the index benchmarks. Index funds try to match these averages while active bond managers will try to tilt their portfolio longer or shorter than this average duration. Unfortunately, portfolio averages are misleading, if not erroneous, data. To prove this accusation please input any bond index’s posted average price, coupon and maturity into a bond calculator and see if you get the average YTM. NO …so what happened? A classic was the Lehman Aggregate reported averages as of July 1990:
Average Coupon = 9.13%
Average Price = 100.00
Average YTM = 8.57%
How could a bond at par have a YTM that is 0.56% less than the coupon? Because portfolio averages are not indicative of the true risk/reward of the index portfolio… Caveat Emptor!
About Ryan ALM, Inc.
Ryan ALM was founded by Ronald J. Ryan, CFA on July 12, 2004 as an Asset/Liability Management firm. The firm builds a turnkey system of proprietary synergistic products designed to measure liabilities as a Custom Liability Index (CLI) and manage assets to the CLI as Liability Beta Portfolios.
Ryan ALM is unique in having its own proprietary Index company named ALM Research Solutions, LLC. This company builds both custom and generic bond indexes. Such indexes range from Custom Liability Indexes to ETF Indexes.
Our Liability Beta Portfolio™ is our proprietary cost optimization model that "cash flow matches" clients projected liability benefit payment schedules at the least cost using investment grade bonds. It is back-tested since 2009 showing a consistent cost savings of 8% to 15%. Our LBP best represents the core portfolio of a pension plan.
Best way to hedge pension inflation
Ronald J. Ryan, CFA, CEO July 2020 Executive Summary Pension inflation is what a plan sponsor agrees to as a cost of living adjustment (COLAs) benefit increase for retired lives...
Source: Best way to hedge pension inflation
Executive Summary
Pension inflation is what a plan sponsor agrees to as a cost of living adjustment (COLAs) benefit increase for retired lives and a salary increase factor for active lives. Quite often, these COLAS are based on the CPI with a floor and a cap or even a % of the CPI while salary increases tend to be quite static @ a 3% annual increase. As a result, pension inflation tends to be less volatile and certainly different than the CPI. Please note that the plan will mismatch the actuarial pension inflation and may introduce
Best way to hedge pension inflation
Many pensions have an allocation to some type of inflation hedge strategy. The most common asset strategies are TIPS and real assets. These strategies are based on hedging or outperforming the CPI. The truth is… these are not appropriate strategies for hedging pension inflation. Pension inflation is what a plan sponsor agrees to as a cost of living adjustment (COLAs) benefit increase for retired lives and a salary increase factor for active lives. Quite often, these COLAS are based on the CPI with a floor and a cap or even a % of the CPI while salary increases tend to be quite static at a 3% annual increase. As a result, pension inflation tends to be less volatile and certainly different than the CPI. Please note that the plan sponsor actuary includes pension inflation (COLAs and salary increases) in their projected benefit payment schedule for both retired and active lives. As a result, the best and, perhaps only way, to hedge pension inflation is to… cash flow match projected benefits! All other inflation strategies (i.e. TIPS and real assets) will mismatch the actuarial pension inflation and may introduce higher cost and fees.
Solution: Cash Flow Match Liabilities
Securing benefits of Retired Lives by matching and funding the projected liability benefit payment schedule (liability cash flows) at the lowest cost is the highest priority of any pension. This is also the ideal way to de-risk a pension plan and hedge pension inflation. Since the actuary includes pension inflation in their liability projections, by cash flow matching the projected liability cash flows (benefit payments) you have hedged pension inflation accurately. There is no other asset strategy that can hedge actuarial pension inflation exactly except insurance annuities which come at a high cost (25% to 40% higher than cash flow matching liability cash flows).
Ryan ALM built a liability cash flow matching product, named the Liability Beta Portfolio™ (LBP), as a cost optimization model that matches and funds the actuarial projected liability benefit payment schedule for retired lives at the lowest cost given the investment policy restrictions of our clients. The LBP portfolio is composed of investment grade corporate bonds skewed to A and BBB corporate bonds since that represents about 89% of the investable investment grade corporate bond universe. Our LBP also accepts and uses high yield bonds if the client investment policy allows.
The LBP provides a 10% to 20% funding cost savings versus the projected benefit payments of retired lives (liability cash flows) and a 20% to 30% cost savings versus using Treasury STRIPS to defease the same liabilities (STRIPS is the discount rate method used by insurance annuities)! This is a serious cost reduction and should be a major consideration of any defined benefit pension plan asset allocation, inflation hedge or de-risking strategy. Yes, the LBP model has some credit risk but very limited since we are using investment grade bonds with several credit filters (to enhance solvency) plus the cost savings provide a large value-added cushion.
We recommend funding the first 10 years of Retired Lives on a net liability basis (after contributions). In truth, current assets fund the net liabilities not the gross liabilities as contributions are the initial funding source of liabilities. Our LBP model will calculate with precision the cost to fund net liabilities chronologically in a cost-effective manner which will de-risk the plan gradually. Since liabilities are funded initially by contributions, using the LBP model to cash flow match net liabilities chronologically may be able to fund more liabilities than you think. Contributions tend to be quite large (especially with many Public plans where actuarially determined contributions are legislated) such that a 10% allocation to our LBP could often fund the next 10-years of net Retired Lives easily.
Matching liabilities chronologically should also buy time for the non-bond assets (Alpha assets) to perform and outgrow liabilities. Given time (10 years) most non-bond asset classes tend to outperform bonds. Since pension liabilities behave like bonds there is a high probability that non-bond asset classes should outperform liability growth over an extended time horizon, especially at today’s low yield on bonds (and liabilities) which would enhance the funded status.
Since the primary pension liability objective is to secure benefits in a cost-effective manner, cash flow matching net liabilities with our Liability Beta Portfolio™ would secure benefits and produce the optimalcost savings.
Asset Allocation (AA)
Pension consultants and plan sponsors should consider installing our LBP as the core portfolio in asset allocation. The best value in bonds is the certainty of their cash flows. Bonds are usually not considered performance assets (Alpha assets) especially versus pension liabilities which behave like bonds. By installing the LBP to fund the first 10 years of net Retired Lives, the pension plan buys time for the Alpha assets (non-bonds) to perform. As the Alpha assets perform versus liability growth, thereby enhancing the funded ratio, such excess returns could be transferred (ported) over to the Liability Beta Portfolio™ (LBP) to de-risk more and more liabilities thereby creating a … Portable Alpha strategy. Had this Portable Alpha discipline been in place during the decade of the 1990s when funded ratios grew to their highest historical levels with true economic surpluses… there would be no U.S. pension crisis today!
Note – The largest U.S. DB pension (CalPERS) removed their 9% asset allocation to inflation hedge assets in 2019.
About Ryan ALM, Inc.
Ryan ALM was founded by Ronald J. Ryan, CFA on July 12, 2004 as an Asset/Liability Management firm. The firm builds a turnkey system of proprietary synergistic products designed to measure liabilities as a Custom Liability Index (CLI) and manage assets to the CLI as Liability Beta Portfolios.
Ryan ALM is unique in having its own proprietary Index company named ALM Research Solutions, LLC. This company builds both custom and generic bond indexes. Such indexes range from Custom Liability Indexes to ETF Indexes.
Our Liability Beta Portfolio™ is our proprietary cost optimization model that "cash flow matches" clients projected liability benefit payment schedules at the least cost using investment grade bonds. It is back-tested since 2009 showing a consistent cost savings of 8% to 15%. Our LBP best represents the core portfolio of a pension plan.
Our team has been recognized for our expertise and results including Ron Ryan having won the William F. Sharpe Index Lifetime Achievement Award.
Cash Flow is King!
Executive Summary Pensions are all about cash flows. They require asset cash flows including projected contributions to fund projected benefits + expenses.Retired Lives are the most imminent and certain liability...
Source: Cash Flow is King!
Executive Summary
Pensions are all about cash flows. They require asset cash flows including projected contributions to fund projected benefits + expenses.Retired Lives are the most imminent and certain liability cash flows and should be the highest priority to fund and secure these benefits.Cash flow matching Retired Lives chronologically with bonds (Beta assets) is the most prudent way to secure these benefits in a cost efficient manner. Unfortunately, most bond assets) who need to grow unencumbered to fund
Pension Solution:
Cash Flow Is King!
The primary objective of a pension is to secure benefits in a cost-efficient manner and then secondarily to enhance the efficiency of the plan’s asset allocation. Securing benefits is all about asset cash flows matching and funding liability cash flows chronologically for 10-years or for as far out as the plan sponsor deems necessary.
Insurance Buyout Annuity (IBA)
Cash Flow Matching (CDI) with bonds
IBA is too expensive for Public and multi-employer plans and unnecessary. Corporations use them to remove the PBGC premium expense on Retired Lives. However, corporations would be wise to compare cash flow matching (Cash Flow Driven Investments or CDI) to IBA. We believe they will find that CDI would reduce funding costs by over 20% in present value dollars versus the future value savings of eliminating PBGC premiums. CDI has been in vogue the longest (since the 1960s) and is a proven way to defease liabilities in a low cost, low risk manner.
It would be wise to separate Retired Lives from Active Lives. The Retired Lives are the most important liabilities since they are the most imminent and known benefits as well as they represent long tenured employees. These are the benefits that need to be secured as best as possible. The Active Lives are the less known and longest liabilities, which allow assets time to grow to fund these benefits.
Since contributions are the first source to fund benefits, current assets fund net liabilities. The actuarial projections of benefits and contributions tend to be annual. Net liabilities are usually not provided by the actuary. Moreover, benefits are paid monthly. Although an easy calculation, it is critical that current assets know what they are funding… monthly net liabilities (projected benefits + expenses – contributions).
It would be wise to separate liability Beta assets from Alpha assets. The Beta assets should be the allocation to bonds to cash flow match net Retired Lives chronologically for a target horizon (we recommend 10 years). Our cash flow matching model (Liability Beta Portfolio™ or LBP) is well tested showing a funding cost savings of 8% to 15% depending on the liability term structure.
It would be wise to take the Cash plus the Fixed Income allocation in your plan’s current asset allocation and apply it to a CDI allocation. This would match and secure benefits chronologically for as far out as the allocation of funds allow. Since we are dealing with net liabilities (after contributions) a 15% allocation may fund liabilities out to 10-years +.
Typically bond allocations are expected to outperform some generic bond index whose cash flows look nothing like the Retired Lives. Moreover, the index benchmark may be skewed to long bonds and Government securities. This introduces interest rate risk and more cost, as yields on government securities are generally the lowest for a similar maturity. Our LBP model is funding benefits (future values) which are not interest rate sensitive. This eliminates the largest risk in bonds. Our LBP model will usually outyield active bond managers by over 50 bps, which will reduce costs. The key value added is the efficiency of the cash flows.
No matter what generic bond index is chosen, active fixed income management cannot produce enough cash flows to fund benefits and expenses. As a result, bonds will require help from performance assets to fund benefits. This will create dilution and disruption of the growth rate of such performance assets. With the Liability Beta Portfolio™ in place as the core portfolio to fund the shorter Retired Lives net liabilities (1-10 years), the Alpha assets are now free to grow without being diluted or unencumbered to pay any benefits. Alpha assets returns will be volatile, but the Liability Beta Portfolio™ bought the plan time (10 years) for the Alpha assets to grow. The example below shows the cash flow difference of bonds managed to a generic index versus cash flow matching to liabilities:
Assumptions
Bond + Cash Allocation = $150 million (15%)
Net Benefits + Expenses (B + E) = $20 m per year ($200 million for 10 years)
Active bond management vs. generic bond index
YTM = 2.50%
Cash flow = $3.75 million annually ($150m x 2.50%)
Cash flow shortfall = $16.25m annually ($20m - $3.75m)
Requires dilution of Alpha assets cash flow to fund the B + E
Liability Beta Portfolio™
YTM = 3.50%
Cash flow = $20 million annual
No dilution of Alpha assets cash flows
Cash flow = Principal + Income + Reinvestment
Benefits of a CDI Approach
Secures benefits for 10 years
No change in Cash and Bond allocation
No dilution of Alpha assets to fund B + E
No interest rate risk (funding future values)
Outyield active bond management which reduces costs
LBP is skewed to higher yielding A/BBB corporate bonds
LBP has no maturities longer than last benefit payment date
Observations
Generic bond indexes cash flows look nothing like the projected benefit payment schedule of a pension.
This leads to a mismatch of cash flows and risk/reward behaviors… serious issues over time.
Alpha assets need time to perform without any dilution of their cash flows to pay benefits so they shouldn’t be a source of liquidity
CDI funds benefit payments and expenses chronologically
CDI will out yield current bond managers and enhance the ROA
Cash flow matching buys time for Alpha assets to grow unencumbered
Logic
Let the performance assets (Alpha assets) perform (grow unencumbered) as the liquidity assets (Beta) assets provide cash flow sufficient to fund benefits plus expenses chronologically.
Was founded by Ronald J. Ryan, CFA on July 12, 2004 as an Asset/Liability Management (ALM) firm. The firm builds a turnkey system of proprietary synergistic products designed to measure liabilities as a Custom Liability Index (CLI) and manage assets to the CLI as a Liability Beta Portfolio™
Our Liability Beta Portfolio™ is our proprietary cost optimization model that "cash flow matches" clients projected liability benefit payment schedules at the least cost using investment grade bonds. It is back-tested since 2009 showing a consistent cost savings of 8% to 15%. Our LBP best represents the core portfolio of a pension plan.