

Ryan ALM
White Papers
Cash Flow is King!
Executive Summary Pensions are all about cash flows. They require asset cash flows including projected contributions to fund projected benefits + expenses.Retired Lives are the most imminent and certain liability...
Source: Cash Flow is King!
Executive Summary
Pensions are all about cash flows. They require asset cash flows including projected contributions to fund projected benefits + expenses.Retired Lives are the most imminent and certain liability cash flows and should be the highest priority to fund and secure these benefits.Cash flow matching Retired Lives chronologically with bonds (Beta assets) is the most prudent way to secure these benefits in a cost efficient manner. Unfortunately, most bond assets) who need to grow unencumbered to fund
Pension Solution:
Cash Flow Is King!
The primary objective of a pension is to secure benefits in a cost-efficient manner and then secondarily to enhance the efficiency of the plan’s asset allocation. Securing benefits is all about asset cash flows matching and funding liability cash flows chronologically for 10-years or for as far out as the plan sponsor deems necessary.
Insurance Buyout Annuity (IBA)
Cash Flow Matching (CDI) with bonds
IBA is too expensive for Public and multi-employer plans and unnecessary. Corporations use them to remove the PBGC premium expense on Retired Lives. However, corporations would be wise to compare cash flow matching (Cash Flow Driven Investments or CDI) to IBA. We believe they will find that CDI would reduce funding costs by over 20% in present value dollars versus the future value savings of eliminating PBGC premiums. CDI has been in vogue the longest (since the 1960s) and is a proven way to defease liabilities in a low cost, low risk manner.
It would be wise to separate Retired Lives from Active Lives. The Retired Lives are the most important liabilities since they are the most imminent and known benefits as well as they represent long tenured employees. These are the benefits that need to be secured as best as possible. The Active Lives are the less known and longest liabilities, which allow assets time to grow to fund these benefits.
Since contributions are the first source to fund benefits, current assets fund net liabilities. The actuarial projections of benefits and contributions tend to be annual. Net liabilities are usually not provided by the actuary. Moreover, benefits are paid monthly. Although an easy calculation, it is critical that current assets know what they are funding… monthly net liabilities (projected benefits + expenses – contributions).
It would be wise to separate liability Beta assets from Alpha assets. The Beta assets should be the allocation to bonds to cash flow match net Retired Lives chronologically for a target horizon (we recommend 10 years). Our cash flow matching model (Liability Beta Portfolio™ or LBP) is well tested showing a funding cost savings of 8% to 15% depending on the liability term structure.
It would be wise to take the Cash plus the Fixed Income allocation in your plan’s current asset allocation and apply it to a CDI allocation. This would match and secure benefits chronologically for as far out as the allocation of funds allow. Since we are dealing with net liabilities (after contributions) a 15% allocation may fund liabilities out to 10-years +.
Typically bond allocations are expected to outperform some generic bond index whose cash flows look nothing like the Retired Lives. Moreover, the index benchmark may be skewed to long bonds and Government securities. This introduces interest rate risk and more cost, as yields on government securities are generally the lowest for a similar maturity. Our LBP model is funding benefits (future values) which are not interest rate sensitive. This eliminates the largest risk in bonds. Our LBP model will usually outyield active bond managers by over 50 bps, which will reduce costs. The key value added is the efficiency of the cash flows.
No matter what generic bond index is chosen, active fixed income management cannot produce enough cash flows to fund benefits and expenses. As a result, bonds will require help from performance assets to fund benefits. This will create dilution and disruption of the growth rate of such performance assets. With the Liability Beta Portfolio™ in place as the core portfolio to fund the shorter Retired Lives net liabilities (1-10 years), the Alpha assets are now free to grow without being diluted or unencumbered to pay any benefits. Alpha assets returns will be volatile, but the Liability Beta Portfolio™ bought the plan time (10 years) for the Alpha assets to grow. The example below shows the cash flow difference of bonds managed to a generic index versus cash flow matching to liabilities:
Assumptions
Bond + Cash Allocation = $150 million (15%)
Net Benefits + Expenses (B + E) = $20 m per year ($200 million for 10 years)
Active bond management vs. generic bond index
YTM = 2.50%
Cash flow = $3.75 million annually ($150m x 2.50%)
Cash flow shortfall = $16.25m annually ($20m - $3.75m)
Requires dilution of Alpha assets cash flow to fund the B + E
Liability Beta Portfolio™
YTM = 3.50%
Cash flow = $20 million annual
No dilution of Alpha assets cash flows
Cash flow = Principal + Income + Reinvestment
Benefits of a CDI Approach
Secures benefits for 10 years
No change in Cash and Bond allocation
No dilution of Alpha assets to fund B + E
No interest rate risk (funding future values)
Outyield active bond management which reduces costs
LBP is skewed to higher yielding A/BBB corporate bonds
LBP has no maturities longer than last benefit payment date
Observations
Generic bond indexes cash flows look nothing like the projected benefit payment schedule of a pension.
This leads to a mismatch of cash flows and risk/reward behaviors… serious issues over time.
Alpha assets need time to perform without any dilution of their cash flows to pay benefits so they shouldn’t be a source of liquidity
CDI funds benefit payments and expenses chronologically
CDI will out yield current bond managers and enhance the ROA
Cash flow matching buys time for Alpha assets to grow unencumbered
Logic
Let the performance assets (Alpha assets) perform (grow unencumbered) as the liquidity assets (Beta) assets provide cash flow sufficient to fund benefits plus expenses chronologically.
Was founded by Ronald J. Ryan, CFA on July 12, 2004 as an Asset/Liability Management (ALM) firm. The firm builds a turnkey system of proprietary synergistic products designed to measure liabilities as a Custom Liability Index (CLI) and manage assets to the CLI as a Liability Beta Portfolio™
Our Liability Beta Portfolio™ is our proprietary cost optimization model that "cash flow matches" clients projected liability benefit payment schedules at the least cost using investment grade bonds. It is back-tested since 2009 showing a consistent cost savings of 8% to 15%. Our LBP best represents the core portfolio of a pension plan.
Buy Time!
Executive Summary U.S. pension plans have been hard hit by rising pension costs since 2000. This has been primarily characterized by spiking contribution costs and volatile funded ratios. A solution...
Source: Buy Time!
Executive Summary
U.S. pension plans have been hard hit by rising pension costs since 2000. This has been primarily characterized by spiking contribution costs and volatile funded ratios. A solution to this dilemma is to implement a strategy that will buy time! By separating assets into liquidity (Beta) and performance (Alpha) assets, you can achieve the true objective of a pension, which is to secure benefits. The Beta assets secure Retired Lives benefits chronologically (we recommend 10 years) thereby buying time for the Alpha assets to enhance the funded status, while besting future liability growth.
Pension Solution: Buy Time!
Ryan ALM's mission is to solve liability driven problems through low cost, low risk solutions.
Most pensions have been hard hit this year. According to a March study by Milliman of the top 100 Public Pensions, the average funded ratio fell to 66% from 74.9% at the end of 2019. This represents the largest decline Milliman has ever recorded. The funded status deficit grew to $1.82 trillion. They reported only four plans with funded ratios > 90% and 35% were < 60% funded using the ROA as the discount rate. Imagine the funded ratio if Public Plans adopted FASB discount rates of AA corporates. Lower funded ratios also suggest higher contributions are coming. What to do?
How do you buy time? Cash flow match liabilities for the time you need.
We believe the answer is… BUY TIME!
Given time, equities (S&P 500) perform well but they need time. The more time you give equities… the better the returns. Here are historical average S&P 500 return measurements for rolling 10-year, 15-year and 20-year periods ending 12/31/19 over a 50-year horizon starting 1969:
Best, worst, and average returns
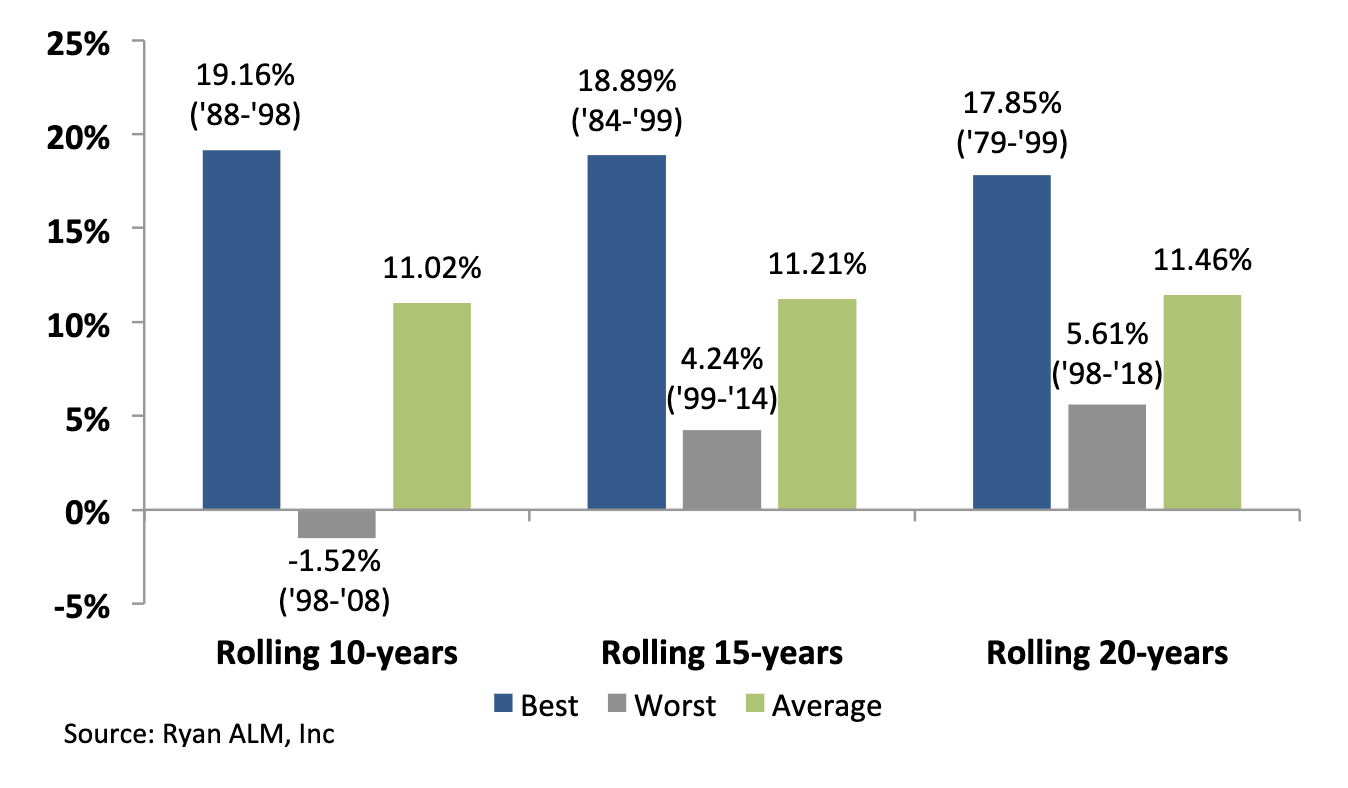
So how do you buy time? The answer is… cash flow match liabilities for the time you need. This is best accomplished by transferring the cash + bond allocation assets in kind over to cash flow match net liabilities + expenses. Our cash flow matching model (Liability Beta Portfolio™ or LBP) will calculate with precision the cost to fund net liabilities + expenses in a cost-effective manner chronologically. Since liabilities are funded initially by contributions, using the LBP model to cash flow match net liabilitieschronologically may be able to fund more liabilities than you think. Assume that a 15% bond + 3% cash allocation could match the next 10 years of net Retired Lives benefit payments + expenses chronologically. Based on the Ryan ALM Liability Beta Portfolio™ (LBP) model we show a cost savings (projected benefits – cost of LBP) of about 10% to 15% on cash flow matching the first 10 years of net liabilities (projected benefit payment schedule – projected contributions).
Matching liabilities chronologically should buy time for the non-bond assets (Alpha assets) to perform. Given time (10 years) most non-bond asset classes tend to outperform bonds and the ROA. Since liabilities behave like bonds there is a high probability that non-bond asset classes could outperform liability growth (earn liability Alpha) over an extended time horizon especially at today’s low yield on bonds and liabilities. This would enhance the funded status allowing for reduced contribution costs or increased benefits or both. Our LBP also has numerous benefits that enhance the pension plan:
Secures Benefits
Cash flow match monthly Retired Lives benefits chronologically
Reduces Costs
LBP reduces Contribution, Funding and Asset Management Costs:
(LBP Fee = 15 bps… much less than most active bond managers)
Reduces Volatility
Reduces volatility of Contributions and Funded Ratio
Reduces Risk
Risk = Uncertainty of Funding Benefit Payments
(LBP funds benefits with certainty)
Projected Benefit Payments are Future Values
(FV have NO Interest Rate Sensitive)
Enhances ROA
LBP should out yield most active management bond portfolios
Buys Time
LBP matches & funds liabilities chronologically
Moves deficit out longer extending the investment horizon
Buys Time for Non-bond assets (Alpha assets) to grow
No dilution of Alpha assets to fund benefits
However, most bond allocations are for active bond management versus a generic index benchmark(s). As the designer of the Lehman bond indexes from my days as the Director of Fixed Income Research at Lehman, I can tell you unequivocally that generic bond indexes look nothing like a projected pension benefit payment schedule. Such a mismatch will distort the cash flows and risk/reward behavior of assets vs. liabilities. The major issues and differences are:
Versus Generic Bond Indexes
Does not fund benefits + expenses
Aggregate Index = low yielding @ 1.42%
Generic bond index =/= plan sponsor’s liabilities
Cash flows do not match plan sponsor’s liabilities
Index skewed to long bonds + Government securities
Performance (value added) = small to none (after fees)
Cash Flow Matching (Liability Beta Portfolio™ – LBP)
Custom Liability Index = plan sponsor’s liabilities
LBP funds Net Benefit + Expense payments (monthly)
Performance = immediate funded cost savings of 8% to 20%
But the worst difference and discrepancy is… all about cash flows. Active bond management is focused on outperforming the returns of a generic bond index benchmark. As a result, cash flows are not a consideration. But no matter what generic bond index is chosen; the fixed income assets cannot produce enough cash flows to fund benefits + expenses. As a result, bonds will require help from performance assets to fund benefits. This will create dilution and disruption of the growth rate of such performance assets. With the Liability Beta Portfolio™ in place as the corebond management is focused on outperforming the returns of a generic bond index benchmark. As a result, cash flows are not a consideration. But no matter what generic bond index is chosen; the fixed income assets cannot produce enough cash flows to fund benefits + expenses. As a result, bonds will require help from performance assets to fund benefits. This will create dilution and disruption of the growth rate of such performance assets. With the Liability Beta Portfolio™ in place as the core portfolio to fund the shorter Retired Lives net liabilities (1-10 years), the Alpha assets are now free to grow without being diluted or unencumbered to pay any benefits. Alpha assets returns will be volatile, but the Liability Beta Portfolio™ bought time (10 years) for the Alpha assets to grow. The example below shows the cash flow difference of bonds managed to a generic index versus cash flow matching to liabilities:
Bond + Cash allocation = $150 million
Net Benefits + Expenses = $20 million per year
Bond management vs. generic bond index
YTM = 2.50%
Cash flow = $3.75 million annual ($2.50% x $150m)
Annual cash flow shortfall = $16.25 million ($20m - $3.75m)
Dilution of Alpha assets cash flow to fund benefits + expenses
Cash Flow Matching
YTM = 3.50% (skewed to A/BBB corporate bonds)
Cash flow = $20 million annual (includes principal + income + income reinvested)
No dilution of Alpha assets cash flows
Observations:
Generic bond indexes look nothing like the projected benefit payment schedule of a pension.
This leads to a mismatch of cash flows and risk/reward behaviors… serious issue over time.
Alpha assets need time to perform without any dilution of their cash flows to pay benefits.
Cash flow matching funds benefit payments chronologically
Cash flow matching will out yield current bond managers and enhance ROA
Cash flow matching buys time for Alpha assets to grow unencumbered
Logic
Let the performance (Alpha) assets perform (grow) as the liquidity (Beta) assets provide cash flow sufficient to fund benefits plus expenses over a time horizon sufficient to let the Alpha assets grow unencumbered.
Pension Solutions Series Part 4 - Performance Measurement
Pension Solution: Performance Measurement Most pension assets are managed versus a market index as the objective or benchmark. However, the true objective of a pension is to fund the pension...
Source: Pension Solutions Series Part 4 - Performance Measurement
Pension Solution: Performance Measurement
Most pension assets are managed versus a market index as the objective or benchmark. However, the true objective of a pension is to fund the pension liabilities (benefit payments) at the lowest cost to the plan with prudent risk. No market index could ever represent the liability objective of any pension. Just like snowflakes, no two pension liabilities are alike due to each plan having a different labor force, salaries, mortality and plan amendments. As pensions have experienced too often, given the wrong index objective … you will get the wrong risk/reward profile!
This has been the pattern for most pension plans as their Funded Ratios have been on a roller coaster for several decades. Until the true liability objective of a pension plan (and any liability driven objective) is measured and monitored frequently and accurately, pension assets are in jeopardy of being managed to the wrong index objective(s). Until a Custom Liability Index is built and put in place as the proper benchmark, all asset decisions are in danger of being mismanaged. Given the wrong index objective(s), performance measurement will then provide inappropriate risk/reward measurements. It is rare that pension assets are ever compared to pension liabilities in performance measurement reports. It follows that if you outperform the S&P 500 or any market index but lose to liability growth …the pension plan loses!
Traditional generic bond indexes do a good job of measuring the risk/reward behavior of a market sector but have nothing to do with pension liabilities. Only a Custom Liability Index (CLI) could ever measure and monitor the risk/reward behavior of any pension liability cash flow schedule. Since contributions are the initial source to fund benefits, current assets fund net liabilities (benefits – contributions). Assets need to know what they are funding… net liabilities!
Solution: Performance Measurement
Once the Liability Beta Portfolio™ is installed to cash flow match net Retired Lives chronologically, you now need the Alpha assets to outgrow net residual liability growth (benefits – contributions of 10-year + Retired Lives and Active Lives)) to enhance the funded status. The CLI will provide the growth rate of net residual liabilities just like any index benchmark so performance measurement of Alpha assets versus net residual liabilities (as measured by the CLI) can be easily assessed. If Alpha assets can outgrow net residual liabilities, then the funded status will be enhanced and contribution costs should be reduced. The Ryan ALM Performance Attribution Report (PAR) will calculate:
eight measurements of risk
four measurements of reward
two measurements of risk-adjusted returns
Pension Solutions Series Part 3 - Asset Exhaustion Test (AET)
Pension Solution: Asset Exhaustion Test (AET) The primary pension objective is to secure promised benefits (Retired Lives) in a cost- effective manner (stable to lower contribution costs) with prudent risk...
Source: Pension Solutions Series Part 3 - Asset Exhaustion Test (AET)
Pension Solution: Asset Exhaustion Test (AET)
The primary pension objective is to secure promised benefits (Retired Lives) in a cost-effective manner (stable to lower contribution costs) with prudent risk. In our last Pension Solution blog, we explained that this is best accomplished through cash flow matching with fixed income… hopefully through our Liability Beta Portfolio™ (LBP). We recommend that our LBP should fund the first 10-years of NET Retired Lives (after Contributions). This buys time for the Alpha assets (performance assets) to grow without being diluted to fund any benefits. This leaves the residual liabilities to be monitored and funded through Alpha assets. As a result, the Alpha assets need to know their target ROA that will fully fund residual liabilities. This requires an Asset Exhaustion Test (AET).
Asset Exhaustion Test (AET)
GASB 67/68 requires an AET. We recommend this test for all pension plans. The AET requires projected contributions be subtracted from projected benefits to get a net liability schedule. The assets are then grown at an actuarial driven ROA to see if they fully fund these annual net liabilities. If the assets are exhausted, GASB requires the discount rate to be bifurcated and the area of future deficits to be discounted at the AA muni 20-year index rate. We have always recommended a market rate to discount all liabilities to calculate the true economic present value of liabilities so the economic funded status can be known. We also recommend that contributions be included as an asset or liability offset in the funded status calculation.
Ryan ALM modifies the GASB AET into a matrix that calculates the ROA needed to fully fund the net liabilities to be fully funded by the Alpha assets. Asset allocation needs to know its target ROA in order to function efficiently. A 5.27% ROA should have a different asset allocation than an 8.23% ROA. Since contributions are included in the ROA as an asset or liability offset, the calculated ROA is way lower than without contributions included. The point here is that assets need to know what their required hurdle rate is… or target ROA. Without this calculation, asset allocation is misaligned and may invite more risk into the equation than needed. A calculated ROA should be a requirement for asset allocation.
Ryan ALM, Inc. is an asset/liability manager specializing in cash flow matching thru a proprietary cost optimization model called the Liability Beta Portfolio™.
Pension Solutions Series Part 2 - Liability Beta Portfolio™ (LBP)
Pension Solution: Liability Beta Portfolio™ (LBP) The primary pension objective is to secure promised benefits (Retired Lives) in a cost- effective manner (stable to lower contribution costs) with prudent risk...
Source: Pension Solutions Series Part 2 - Liability Beta Portfolio™ (LBP)
Pension Solution: Liability Beta Portfolio™ (LBP)
The primary pension objective is to secure promised benefits (Retired Lives) in a cost-effective manner (stable to lower contribution costs) with prudent risk. This is best accomplished through cash flow matching.
Cash Flow Matching
Since benefits (liabilities) are future value numbers, it is consistent and necessary to match the future value of assets to the future value of liabilities. This is better said as cash flow matching asset cash flows to liability cash flows… cash flow driven investments (CDI). Since bonds are the only asset class with a known future value, it has been the obvious choice to cash flow match liabilities. Indeed, this is the true value of fixed income assets. In truth,cash flow matching the liability benefit payment schedule (liability cash flow) isthe ideal way to de-risk a pension plan. Since projected benefits (future values) are not interest rate sensitive, cash flow matching projected benefits eliminates the biggest risk in bonds… interest rate sensitivity.
Since contributions are the initial source to fund liabilities, current assets fund net liabilities (benefits – contributions). It is critical that current assets know what they are funding… net liabilities! Fixed income assets are best cash flow managed versus Retired Lives, which are the most certain and imminent liabilities. Active Lives tend to be the most uncertain cash flows (actuarial noise). Matching Retired Lives net liabilities chronologically is wise and recommended as it not only secures benefits over a certain time horizon, it buys time for the non-bond assets (Alpha assets) to perform and outgrow Active Lives liabilities. It would not be prudent to use volatile, risky assets to fund the shorter Retired Lives liabilities… too uncertain.
Ryan ALM has developed a cash flow matching model called the Liability Beta Portfolio™ (LBP). Our LBP is a cost optimization model that matches and funds Retired Lives monthly benefit payments chronologically at the lowest cost to the plan sponsor. Our LBP should reduce funding costs by 8% to 10% vs. 1-10 years Retired Lives. The true value in bonds is the certainty of their cash flows. We urge plan sponsors to transfer current active fixed income management from generic index benchmarks to our LBP to de-risk the plan gradually and reduce costs.
Asset Allocation
Asset allocation would be wise to separate Retired Lives from Active Lives and liability Beta assets from liability Alpha assets. We recommend using bonds cash flow matched to Retired Lives chronologically as the liability Beta assets and use Alpha assets (risky assets) for the Active Lives. The funded ratio should dictate the allocation to bonds. The higher the funded ratio: the higher the allocation to liability Beta assets. The pension plan’s current allocation to bonds should determine how much of the net liabilities bonds can cash flow match (i.e. 15% bond allocation might fund the next seven to 10-years of Net Retired Lives). By switching from traditional bond management and generic bond indexes to a Custom Liability Index coupled with a Liability Beta Portfolio will produce many benefits to the pension plan:
1. Reduce Funding Costs
The Liability Beta Portfolio should be the core portfolio since it best represents the true pension objective… securing benefits in a cost-effective manner. Our LBP will reduce funding costs by 8% to 10% in funding 1-10 years of Retired Lives. The true quest of any pension or liability driven objective is to reach and maintain a fully funded liability cash flow matched asset position. This can only be achieved with a cash flow matching bond portfolio. Any other asset class does not match the behavior of liabilities and creates the roller coaster effect of victories (surplus) and losses (deficits).
2. Reduces Volatility in Funded Ratio
If you match liabilities then you match the risk/reward behavior of the present value of liabilities. This eliminates the roller coaster effect that most plans have in their Funded Ratio due to a mismatching of assets vs. liabilities. This erratic growth difference between assets vs. liabilities plays havoc with budgets (i.e. Contributions), benefit decisions and financial statements.
3. Reduces Contribution Volatility and Cost
If you match liabilities then the funded ratio is less volatile which in turns means that contribution costs become less volatile. Our LBP will also outyield liabilities thereby creating some Alpha which will reduce Contribution costs.
4. Reduces Interest Rate Risk
Benefit payments are future value amounts which are not interest rate sensitive. By cash flow matching future values, we have neutralized interest rate risk.
5. Reduces Bond Asset Management Fees
The Ryan ALM Liability Beta Portfolio (LBP) has a low fee which should save clients about 50% on bond asset management fees.
6. Buys Time for Alpha assets
The LBP will match and fund Retired Lives chronologically. If the LBP funds 1-10 years of Retired Lives it buys 10-years of time for the Alpha assets to grow and perform. History tells us that risky assets do better the more time you give them to perform.
Pension Solutions Series Part 1 - Custom Liability Index (CLI)
Pension Solution: Custom Liability Index (CLI) Most pension assets are managed versus a market index as the objective or benchmark. However, the true objective of a pension is to fund...
Source: Pension Solutions Series Part 1 - Custom Liability Index (CLI)
Pension Solution: Custom Liability Index (CLI)
Most pension assets are managed versus a market index as the objective or benchmark. However, the true objective of a pension is to fund the pension liabilities (benefit payments) at the lowest cost to the plan with prudent risk. No market index could ever represent the liability objective of any pension. Just like snowflakes, no two pension liabilities are alike due to each plan having a different labor force, salaries, mortality and plan amendments. As pensions have experienced too often, given the wrong index objective … you will get the wrong risk/reward profile!
This has been the pattern for most pension plans as their Funded Ratios have been on a roller coaster for several decades. Until the true liability objective of a pension plan (and any liability driven objective) is measured and monitored frequently and accurately, pension assets are in jeopardy of being managed to the wrong index objective(s). Until a Custom Liability Index is built and put in place as the proper benchmark, all asset decisions are in danger of being mismanaged. Asset Allocation, Asset Management and Performance Measurement are all index driven. Given the wrong Funded Ratio, asset allocation will most probably function inappropriately. It follows that a pension plan with a surplus should have a different asset allocation than a plan with a large deficit. Such Funded Ratios need to be based on market or economic valuations not accounting or actuarial valuations. Given the wrong index objective(s), asset management will behave accordingly and produce an inappropriate risk/reward profile (same as index benchmark). Given the wrong index objective(s), performance measurement will then provide inappropriate risk/reward measurements. It is rare that pension assets are ever compared to pension liabilities in performance measurement reports. It follows that if you outperform the S&P 500 or any market index but lose to liability growth …the pension plan loses!
Traditional generic bond indexes do a good job of measuring the risk/reward behavior of a market sector but have nothing to do with pension liabilities. It is mission impossible for any generic index to measure the unique cash flows of any pension. Only a Custom Liability Index could ever measure and monitor the risk/reward behavior of any pension liability cash flow schedule.
Accounting and Actuarial Reports
Most accounting and actuarial reports are based on an annual fiscal year basis. These tedious and complicated reports usually take months to compile. Such reports usually include a thorough analysis of pension liabilities based on current accounting rules (i.e. ASC 715, ASC 960, PPA, GASB) and actuarial practices (i.e. ASOP 27).
Although these annual accounting and actuarial reports are quite thorough they do not provide the calculations, transparency and frequency needed for proper asset/liability management (ALM). What asset manager could manage assets to an index that comes out annually, months delinquent and you are not provided with the index portfolio. It is rare that the liability cash flow schedule of benefit payments is provided in an actuarial report or CAFR.
Solution: Custom Liability Index (CLI)
Given a liability objective, the first step in a solution is a Custom Liability Index that accurately and frequently measures the size, term structure shape and risk/reward behavior of this unique cash flow. A Custom Liability Index is the proper benchmark for liability driven objectives. The CLI creates a true economic ormarket value measurement of liabilities instead of a single discount rate approach (that is not a market rate) used by most clients today. Since Contributions are the first source to fund benefit payments, the Ryan ALM Custom Liability Index creates a gross and net CLI (after Contributions). Assets need to know what they are funding… net liabilities (after Contributions). Unlike actuarial reports that come out annually and even tri-annually (delinquent), the Ryan ALM Custom Liability Indexes are monthly reports. Our CLI will calculate:
YTM
Duration
Future Value
Present Value
Growth Rate %
Term Structure
Interest Rate Sensitivity
Gross and Net Liabilities
Benefit: Asset Allocation (AA)
Plan sponsors can now know their economic funded status monthly on both a gross and net liability basis. Asset allocation should be based on the economic net liability funded status. A surplus should have a much different AA than a deficit. A deep deficit should have a different AA than a small deficit.
Benefit: Proper Benchmark for Assets
Assets need to know what they are funding… net liabilities (after Contributions). Bonds are best as the core portfolio to cash flow match Retired Lives chronologically. Out Liability Beta Portfolio (LBP) is the proper cash flow matching tool and is explained in our future research topic. This buys time for the Alpha assets to grow and perform vs. the CLI.
Benefit: Performance Measurement
Once the Liability Beta Portfolio is installed to cash flow match Retired Lives chronologically, you now need the Alpha assets to outgrow liability growth to enhance the funded status. The CLI will provide the growth rate of net liabilities just like any index benchmark so performance measurement can be easily assessed.
An error is not a mistake until you refuse to correct it. John F. Kennedy
The Role of Bonds in Pension Asset Allocation
Custom Liability Index (CLI) The first step in prudent pension management is to install a Custom Liability Index (CLI) to calculate and monitor the present and future value term structure,...
Source: The Role of Bonds in Pension Asset Allocation
Custom Liability Index (CLI)
The first step in prudent pension management is to install a Custom Liability Index (CLI) to calculate and monitor the present and future value term structure, growth rate and interest rate sensitivity of the plan’s liabilities. The CLI is the proper benchmark for any pension defined benefit plan. It is based on the actuarial projections of the future benefit payment schedule. The CLI will produce all of the critical calculations needed to manage and understand a pension: future value, present value, yield, duration, growth rate, term structure and interest rate sensitivity. Since contributions are the initial source to fund liabilities, current assets truly fund the net liabilities (after contributions). As a result, there needs to be both a gross and net CLI to show the significant differences in future values, present values, yield, duration, growth rates and interest rate sensitivity. It is rare to find a CLI installed in most pensions which leads to a misalignment of assets vs. liabilities. Beware of custom indexes that are a blend of generic bond indexes… where are the client’s liabilities? Ron Ryan created the first CLI in 1991 and Ryan ALM is a leader in providing CLIs to plan sponsors. We will price the CLI at any discount rate the client prefers: ASC 715, ROA, PPA, Treasury STRIPS. Since Moody’s has adopted the ASC 715 discount rates (zero-coupon AA corporates) for Public pensions and FASB uses ASC 715 discount rates for corporations, the ASC 715 discount rates would be the logical choice to calculate liability present value to understand the true economic funded status and liability growth rate.
Asset Allocation (AA)
Asset allocation is the single most important asset decision since it affects all assets. The goal of AA is to enhance the funded ratio and funded status in a cost-effective manner with prudent risk. AA should be based on the funded ratio and funded status not the ROA. A pension plan with a surplus should have a radically different asset allocation than a plan with a major deficit. Yet if these two plans had the same ROA (return on asset assumption) they would most probably have the same asset allocation… totally inappropriate! Note once again, assets fund the net liabilities (after contributions). So it is the net liabilities that should be used to calculate a net funded ratio and funded status which drives the AA. It is this net funded ratio and funded status that should be the focus of asset allocation. It is critical that current assets know what they are funding… net liabilities!
Funded Ratios History
Most pensions had a surplus in the 1990s. Prudent fiduciary responsibility should have secured this surplus through an asset liability matching (ALM) strategy using bonds (i.e. cash flow matching, defeasance or immunization). But since bond interest rates were low and trending lower, asset allocation models went the other way and reduced their allocation to bonds consistently and skewed their allocation to more and more risky assets (i.e. equity) in an attempt to achieve the ROA. This became a fatal mistake as funded ratios eroded by about 50% in the 2000-2002 equity correction period and have stayed in a deficit position ever since. The old adage, “if you go down 50%, you have to go up 100% to get back to 0%”... rang true in pensions. Had asset allocation been responsive to the rising funded ratio in the 1990s, it would have transferred more and more assets to bonds in an ALM strategy. Moreover, there was no anchor or core portfolio to de-risk the plan (ALM strategy) that would have significantly reduced the volatility of the funded ratio and secured the surplus.
De-Risking a Pension
Pension plans should want to de-risk their plans consistently over time. The lowest risk assets for a pension are those that match the liability benefit payment schedule (future values) with certainty. By definition, Treasury zero-coupon bonds (STRIPS) and annuities would be the lowest risk assets for pension since they have a known future value… but they tend to come at a high cost since they are low yielding and have high fees (annuities). Given that the pension objective is a liability objective with cost constraints, then solving for cost while matching the liability benefit payment schedule would be the ideal way to de-risk a pension. This is best accomplished thru a cash flow matching strategy. A pension liability benefit payment schedule is a term structure or yield curve often referred to as the liability cash flow. In order to match or de-risk the liability cash flow requires a matching cash flow from assets. Basically, only bonds and annuities produce a certain cash flow. That is why bonds and annuities are preferred as the way to defease, immunize and de-risk a pension plan.
Problem: Immunization Strategies (Duration Matching)
The initial problem with duration matching is where do you get the duration of each client’s liabilities. The actuary does not calculate and provide the average duration of liabilities in the annual actuarial report. Most, if not all, duration matching strategies use a generic bond market index as the proxy for liabilities. How could one generic index represent each unique pension plan? Pension liabilities are like snowflakes, you will never find two alike… different labor force, salaries, mortality, plan amendments, etc. The difference in liability cash flows and durations could be quite significant. For every year you are off in duration, should represent a 1% difference in liability growth per 100 bp move in the discount rates. Without a custom liability index, duration matching is a futile effort.
Imagine a 12-year average duration liability benefit payment schedule. It could have many different term structure shapes to come up with an average 12-year average duration. Imagine a bond portfolio where 100% of the bond assets have a 12-year duration. If interest rates rose 50 basis points in a year the total assets and liabilities supposedly would both have a -6% price return (interest rate movement x duration (as a negative number)). If they had the same income return = 4% they would match again (note that assets usually don’t match the income or yield of liabilities). However, if the matching assets are used to fund the liability cash flow of annual benefits then a -2% loss (-6% + 4% = -2%) on assets could be funding a one-year liability which should have a small positive growth rate. Consequently, the assets could be taking a loss each year to fund the next liability payment if interest rates continue to rise. This could be a serious costly mismatch if interest rates began a secular trend to higher rates for the next five years. But the point is… there is no cash flow match of the liability term structure, only a duration match of total liabilities so there is serious funding risk!
Imagine another duration matching approach where you buy bonds that exactly match the duration of each liability payment. So you would buy a 3-year duration bond to fund a 3-year benefit payment, a 5-year bond to fund a 5-year benefit payment, etc. Using corporate bonds to duration match is difficult, if not impossible. First, there are no corporate zero-coupon bonds. Second, the duration of a coupon bond changes with interest rates so if interest rates go down the durations should go up and vice versa. This is not compatible with funding each benefit payment as they come due over time since liabilities behave like zero-coupon bonds. Third, duration matching does not match or fund each benefit payment (the benefit payment schedule). Last, there are no corporate coupon bonds whose durations exceed 16-years so you are forced into Treasury STRIPS to fund liabilities past 16 years. Treasury STRIPS will certainly match these longer liabilities but come at a high cost. You want to buy longer bonds whose cash flows match the liability benefit payment schedule but at a much lower cost. This requires long coupon bonds which would create a duration mismatch.
Interest rate swaps and futures (derivatives) are another immunization strategy. They are contracts not true assets. There is no cash flow or funds available to make the liability cash flow payments. They are certainly NOT de-risking strategies but hedges vs. the liability growth rate. In fact, these strategies introduce more risk: counter party risk, interest rate risk, non-matching risk of assets purchased (usually equities) vs. liabilities and leverage. In addition, interest rate swaps and futures have all of the problems associated with a liability duration proxy… as listed with duration matching.
Problems with Insurance Buyout Annuities (IBA)
The buyout annuity is certainly the least risky approach to de-risking a pension but it comes at the highest cost. The current trend is to price liabilities at the Treasury STRIPS yield curve and create a single discount rate (i.e. 3.00%) + a fee of around 4%. The plan sponsor would have to transfer assets and funds over to the insurance company such that the plan is fully funded (or even up to 105% funded) at this single discount rate.
The insurance buyout annuity should be more costly than defeasing the plan with Treasury STRIPS which was always considered the high cost de-risking strategy. Defeasance with Treasury STRIPS should also allow an accounting removal of the pension liability debt. Since the primary pension objective is to fund liabilities at low and stable costs, the buyout annuity should be given a second thought before executing. In addition, if the insurance company goes bankrupt there may be a claw back of pension liabilities to the plan sponsor.
Solution: Cash Flow Matching
As stated in the beginning, matching the liability benefit payment schedule (liability cash flow) at the lowest cost is the ideal way to de-risk a pension plan. Ryan ALM spent two years building a liability cash flow matching product, named the Liability Beta Portfolio™ (LBP), as a cost optimization model that matches the liability benefit payment schedule at the lowest cost given the investment policy restrictions of our clients. Based on the same sample benefit payment schedule used above for the buyout annuity vs Treasury defeasance comparison, our LBP model shows a 26.84% funding cost savings vs. the buyout annuity and 26.54% vs. STRIPS! This is a serious funding cost reduction and should be a major consideration of any de-risking strategy. Yes, the LBP model has some credit risk but very small since we are using investment grade bonds only. The funding cost savings + the extra yield vs. liabilities annually (@100 bps) provide a large value-added cushion vs. any credit problems. Since our LBP is matching and funding the liability benefit payment schedule (future values), there is no interest rate risk since future values are not interest rate sensitive.
The funded ratio should dictate the allocation to bonds. A surplus should have a high allocation to bonds matched to liabilities and vice versa for a deficit funded status. Unfortunately, asset allocation did not respond to the surplus status in the 1990s which led to the US pension crisis. I wrote a book “The U.S. Pension Crisis” detailing the causes and solutions of this enormous financial crisis. With funded ratios at 120% to 150% in the 1990s, why didn’t pensions de-risk their plan (cash flow match) and secure this victory? Because pensions were focused on achieving the ROA (return on asset assumption) instead of focusing on the funded ratio and status, they reduced their bond allocations when bond yields went below the ROA… around 1988. Amazingly, instead of increasing their bond allocation in response to a growing funded ratio they reduced it consistently to the lowest bond allocations in modern history by 1999. The equity correction of 2000-02 erased pension surpluses and created severe deficits that most pensions have not recovered from with spiking contribution costs ever since 2000.
Based on the allocation to bonds should determine how much of the liabilities we can cash flow match (i.e. 25% bond allocation could fund the next 10 years of net liabilities). Most current bond allocations are historically low. As a result, you cannot match and de-risk 100% of liabilities with a 25% bond allocation, especially if you have a funded status deficit. Such a 25% allocation could be used to match and de-risk either a % of total net liabilities or net liabilities chronologically… both methods will de-risk the plan gradually. There are advantages for each method.
Since liabilities are funded initially by contributions, using the LBP model to cash flow match net liabilities chronologically may be able to fund more liabilities than you think. Assume that a 25% bond allocation could match the next 10 years of net liability payments chronologically. Based on the Ryan ALM Liability Beta Portfolio™ (LBP) model we show a funding cost savings of about 4% to 6% on cash flow matching the first 10 years of liabilities versus the ASC 715 discount rate (AA corporate zero-coupon bonds). Note that Ryan ALM is one of few vendors who provide the ASC 715 discount rates since 2008. Our discount rates are consistently higher than the Citigroup rates providing a lower present value on liabilities and enhancing funded ratios and balance sheets. Price Waterhouse has been a subscriber to our ASC 715 discount rates since 2008.
Matching liabilities chronologically should also buy time for the non-bond assets (Alpha assets) to perform and outgrow liabilities (as measured by the CLI). Given time (10 years) most non-bond asset classes tend to outperform bonds. Since liabilities behave like bonds there is a high probability that non-bond asset classes should outperform liability growth over an extended time horizon especially at today’s low yield on bonds (i.e. liabilities).
Since the pension liability objective is also a cost focus, cash flow matching a % of total liabilities would produce the optimal funding cost savings since the longer the bond the less it costs given the same future value. Our LBP model is back tested since 2009 showing a cost savings of 8% to 12% on cash flow matching a % of total net liabilities. For every $1 billion in bonds used in our LBP model could save about $100 million in cost savings vs. the ASC 715 present value of liabilities.
Core Bond Portfolio (De-Risk)
Pension consultants and plan sponsors should consider installing a LBP as the core portfolio in asset allocation. This would gradually de-risk the plan and facilitate portable alpha asset allocation. The best value in bonds is their cash flows. Bonds are usually not considered performance assets (Alpha assets) especially vs. pension liabilities which behave like bonds. The P&I performance study has proven for decades that fixed income managers have little or no value added vs. bond index benchmarks (after fees).
Given no change in the bond allocation… replace high fee active bond management with a LBP that will de-risk the plan, reduce funding costs and reduce contribution volatility at a low asset management fee (@ 12 bps). As the Alpha assets (non-bonds) perform vs. liability growth (as measured by the CLI), thereby enhancing the economic funded ratio, such excess returns (liability Alpha) should be transferred over to the Liability Beta Portfolio™ (LBP) to de-risk more and more liabilities… Portable Alpha. Had this portable Alpha discipline been in place during the decade of the 1990s when funded ratios grew to their highest historical levels with true economic surpluses… there would be no U.S. pension crisis today!
Nota Bene (Note Well)
Please note that the definition of risk used in this research report is in sharp contrast to the traditional approach produced by the Nobel Prize winner Ph.D. William F. Sharpe back in 1966. Professor Sharpe proposed that risk is the volatility of total returns and that the three-month T-Bill was the default risk-free rate. He developed the Sharpe Ratio as a means of calculating the risk-adjusted return by subtracting the return of the three-month T-Bill from the mean return of the assets being analyzed and dividing the net return by the volatility of the return of the assets in review. For many decades the Sharpe Ratio was the standard measurement of risk-adjusted returns. In 1994 Prof. Sharpe called me and invited me to Stanford to discuss our unique custom liability index data and index reports. I had the unique pleasure to meet and debate with one of the finest intellects I ever met.
I proposed that risk is not a generic measurement but based on each client’s objective. I referenced pensions where every client’s liabilities are different (like snowflakes). As proof, I asked him what is the risk-free asset for a 10-year liability payment? Prof. Sharpe answered… a 10-year Treasury zero-coupon bond that matches the liability payment with certainty. Prof. Sharpe identified that the three-month T-Bill would have 39 reinvestment moments of uncertainty, so there is no way the three-month T-Bill could match a 10-year liability future value with any certainty and would become a risky asset. Our discussion led to Prof. Sharpe re-inventing the Sharpe Ratio in 1994 to include the benchmark objective instead of the three-month T-Bill in the numerator and denominator such that the average return of the asset portfolio is reduced by the average return of the objective (numerator). This net average return is then divided by the standard deviation of the asset portfolio return vs. the objective return (tracking error). This is commonly called today… the Information Ratio.
April Fools: Misleading Indicators
The Commerce Department reports with some glee that sales and income figures show an easing up of the rate of which business is easing off, which is taken as proof...
Source: April Fools: Misleading Indicators
The Commerce Department reports with some glee that sales and income figures show an easing up of the rate of which business is easing off, which is taken as proof that there is a slow down as well as a noticeable slowing up of a slowdown.
In order to clarify the cautious terminology of the experts, it should be noted that a slowing up of the slowdown is not as good as an upturn in the down curve, but it is a good deal better than either a speedup of the slowdown or a deepening of the down curve, and it does suggest that the climate is about right for an adjustment to the readjustment.
Turning to unemployment, we find a definite decrease in the rate of increase, which clearly shows that there is a letting up of the letdown. Of course, if the slowdown should speed up, the decrease in the rate of increase of unemployment would turn into an increase in the rate of decrease of unemployment. In other words, the deceleration would be accelerated.
But the indicators suggest a leveling off, referred to on Wall Street as a bumping along rock bottom. This will be followed by a gentle pickup, then a faster pickup, a slowdown of the pickup, and finally a leveling off again.
It is hard to tell, before the slowdown is completed, whether a particular pickup is going to be fast. At any rate, the climate is right for a pickup this season, especially if you are about twenty-five, unmarried, and driving a red convertible.
It’s April 1… don’t be fooled!
Becoming Liability Aware
A Strategy For Improved Pension Funding The Objective in managing a defined benefit plan is to fund benefit payments (liabilities) in a cost effective manner and to reduce risk over...
Source: Becoming Liability Aware'
A Strategy For Improved Pension Funding
The Objective in managing a defined benefit plan is to fund benefit payments (liabilities) in a cost effective manner and to reduce risk over the long term.
The Process to improve funding starts with becoming more liability aware, and it includes the following steps / products to assist the sponsor in meeting the Objective.
Price your liability - ASC 715 Discount Rates
Provide a series of yield curves that conform to ASC 715. Price Waterhouse is a major subscriber. Ryan ALM discount rates consistently out-yield Citigroup’s rates.
Measure your liability - Custom Liability Index (CLI)
CLI provides all calculations needed to measure and monitor the PV risk/reward behavior of liabilities including: growth rate, statistical summary (YTM, Duration, etc.) and interest rate sensitivity. We will create both a gross and net CLI (after Contributions). The CLI is the proper benchmark for pensions.
Monitor your liability - Asset / Liability Summary
Based on the CLI calculations, we will create a summary page to clearly show the difference between gross and net CLI, the present value difference between discount rates, and the growth rate of the plan’s liabilities.
Will the plan go broke? - Asset Exhaustion Test (AET)
The AET will calculate when the current assets are exhausted and can no longer fund benefit payments. The AET includes all cash flows from current assets and the projected contributions. We will run a matrix of asset growth rates to calculate the proper ROA needed to fully fund liabilities.
Set the glide path - Allocation of Assets to Beta (insurance) and alpha (growth) The output from the CLI and AET will highlight that portion of the assets that can be allocated to beta versus alpha. This bifurcated approach is unique relative to single asset allocation strategies, and it is dynamic in its response to changes in the funded ratio / funded status.
Begin to de-risk the plan - Liability Beta Portfolio (LBP)
The LBP is a fixed income portfolio designed to cash flow match and fund the projected benefit payment schedule at the lowest cost to the plan. The LBP is a cost optimization model that should reduce funding costs versus the ASC discount rates using investment grade bonds.
PPA Recommendation for Multiemployer Plans
Replace Active Bond Management with Liability Beta Portfolio
Reduce Asset Management Costs by 50%
Match Net Liabilities Chronologically
Reduces Funding Costs by 4%+
De-Risks the Plan Gradually
Buys Time for the Alpha assets to Outgrow Liabilities
Transfer Alpha Victories to LBP (Portable Alpha)
Stabilizes Funded Ratio + Funded Status
The Smartest Beta
The term “beta” is credited to William F. Sharpe, Ph.D. in his 1964 work in development of the “Capital Asset Pricing Model (CAPM)”. It means (1) the covariance of the...
Source: The Smartest Beta
The term “beta” is credited to William F. Sharpe, Ph.D. in his 1964 work in development of the “Capital Asset Pricing Model (CAPM)”. It means (1) the covariance of the return on a security or portfolio with that of the market portfolio divided by (2) the variance of the return on the market portfolio. Professor Sharpe originally called this “market sensitivity” since you are comparing an investment to the market as defined by a market index. A beta of 1.0 suggests you have no residual risk in that you match the risk/reward behavior of the market index you are being compared against. Ideally, a market index fund should consistently have a market beta of 1.0.
Beta is a measurement based on a market or objective index. Without the index benchmark there is no applicable beta calculation. Traditionally, this has been the popular index benchmarks (i.e. S&P 500, Lehman Aggregate, etc.) but in truth it can be any index that best represents the objective of such funds (i.e. ETFs, index funds). Back in 1964 there was the absence of market indexes so beta was limited mainly to a measurement versus the S&P 500. The first bond index was introduced by Kuhn Loeb in 1973 (merged into Lehman in 1977). Since the advent of ETFs in 1993 there has been numerous new indexes created to feed the explosive growth of ETFs. Such new indexes are the stated objective of these many new ETFs.
Smart Beta
Smart beta is the optimization of the risk/reward behavior of a market index usually by changing the weights. Popular smart beta weighting schemes have been: fundamental weighting, equal-weighting, risk-clusters, and diversity weighting (combines equal and cap weighting). By changing the weights methodology the goal is to enhance returns or reduce volatility or both. Smart beta products have grown well in a short period of time but for the most part are still equity index derivatives. Rob Arnott and Research Affiliates, LLC have been a leader here introducing fundamental weighting for both bond and stock indexes as risk/reward value-added.
There is debate as to whether changing the weight methodology of a market index is really active management or an alpha strategy rather than a beta strategy or discipline. My recommendation is that the objective decides what is beta and alpha. What is important is to have the objective defined by a rules based index. If this reweighted index is the stated objective of an ETF, mutual fund or client then beta is the portfolio that matches the risk/reward of this objective index version. It also follows that alpha is the excess return versus this modified index objective. All comparisons to the traditional generic market index are just good information to know but do not determine the alpha and beta calculations.
Liability Beta Portfolio (The Smartest Beta)
The “smartest beta” portfolio is the portfolio that best matches and achieves the true client objective with the least amount of risk and cost. Risk is best measured as the uncertainty of achieving the objective. Cost is the amount required to fund the objective. The true objective of most institutions and even individuals is some type of liability (annuities, banks, insurance, lotteries, NDT, OPEB, pensions, etc.). The absolute level of volatility of returns is not risk given a liability objective. Indeed a 10-year liability payment is best matched and funded (defeased) by a 10-year Treasury STRIPS which has a certain future value. A three month T-bill would be very risky given this liability objective as it has 39 reinvestment moments of uncertainty. Although the 10-year Treasury STRIPS would be much more volatile in returns, such a return pattern would match the present value behavior of the 10-year liability and thus be low risk or even risk-free (defeasance).
Given a liability objective it is critical to create a custom liability index (CLI) as the proper benchmark. It must be a custom index since liabilities are like snowflakes… you will never find two alike. The CLI is a portfolio of liability payments weighted by the schedule of payments (term structure). Most institutional liabilities are calculated by actuaries who produce an actuarial projection of the liability payment schedule for each client. As such, the CLI is weighted by the actuarial projection in present value dollars. To calculate the present value of each liability payment you need to price liabilities based on a yield curve of discount rates. Depending on the type of liability there are accounting rules (ASC, FASB, GASB, IASB, PPA, etc.) that dictate the discount rate methodology.
Most, if not all, liabilities are priced as zero-coupon bonds since they produce a certain future value. Using U.S. corporate pensions, as an example, they are regulated by ASC 715 (formerly FAS 158) for GAAP accounting purposes. These rules suggest pricing liabilities as if they were AA corporate zero-coupon bonds. Since such bonds are not available in the bond market, they have to be manufactured as hypothetical zero-coupon bonds. As a result, liabilities behave like a yield curve of zero-coupon bonds weighted by the actuarial projections. This means that pension liabilities are extremely interest rate sensitive.
The CLI should calculate all of the necessary statistics to maintain and monitor a liability beta portfolio: term structure weights, total present value, YTM, duration, growth rate, interest rate sensitivity. The CLI is also the proper benchmark to measure liability alpha. If equity assets outperform the S&P 500 but underperform the CLI growth rate… did you earn alpha? In the eyes of the client you lost to liability growth which will damage the funded ratio
(assets/liabilities), credit rating and increase contribution cost. Liability alpha is the excess return versus the CLI return (growth rate) and not versus a market index return. Based on Ryan ALM indexes, liability YTD returns through November 30 should be between 12.7% (10-year duration) and 22.2% (15-year duration). Hard to believe that any pension has earned liability alpha so far in 2014.
The key point here is that the client objective is truly the focus and determinant of relative risk and reward (beta and alpha). The client objective is to fund liabilities in such a way that risk and cost are reduced and stable over a long horizon. Given a long average life (duration) based on the liability payment schedule then the liability beta portfolio needs to match these term structure weights. An S&P 500 index fund or any generic market index fund could never represent the beta portfolio for a liability driven objective. Cash or a money market fund is a very risky investment for most liability objectives that have long average lives (duration).
The most appropriate and smartest beta portfolio is the one that matches the liabilities cash flow as measured by the CLI. In essence, the smartest beta portfolio is a custom liability index fund. Such a portfolio should be the core portfolio for any liability objective. By matching the liability term structure the uncertainty risk of matching liabilities is eliminated and interest rate sensitivity is neutralized. By matching the liability term structure with bonds that have higher yields and lower present values (price) than the discount rates used… you have reduced costs. Since the accounting rules (ASC 715, IASB, and PPA) use AA zero-coupon discount rates then a liability beta portfolio of A and BBB will produce higher yields and lower costs. This should provide significant cost savings of 10% to 15%. This matching process is called cash flow matching. Beware of duration matching strategies (i.e. immunization) which do not match the liability cash flows but just the average duration. This is not an accurate or cost effective way to match liabilities. The smartest beta portfolio is a liability cash flow matched portfolio!