
Ryan ALM
White Papers
Browse
Ryan ALM Pension Monitor 3Q ‘21
Ryan ALM Pension Monitor (Through September 30, 2021) Pension plan liabilities need to be measured and monitored regularly. Without knowledge of plan liabilities, the allocation of plan assets cannot be...
Source: Ryan ALM Pension Monitor 3Q
(Through September 30, 2021)
Pension plan liabilities need to be measured and monitored regularly. Without knowledge of plan liabilities, the allocation of plan assets cannot be done appropriately.
The funded ratio/status of pension plans are present value calculations. Each type of plan is governed by accounting rules and actuarial practices, which determine the discount rate used to calculate the present value of liabilities. Single employer corporate plans are under ASC 715 (FASB) discount rates (AA corporate zero-coupon yield curve); multiemployer plans and public plans use the ROA (return on asset assumption) as the liability discount rate. The difference in liability growth between these plans can be quite significant, which will affect funded status and contribution levels.
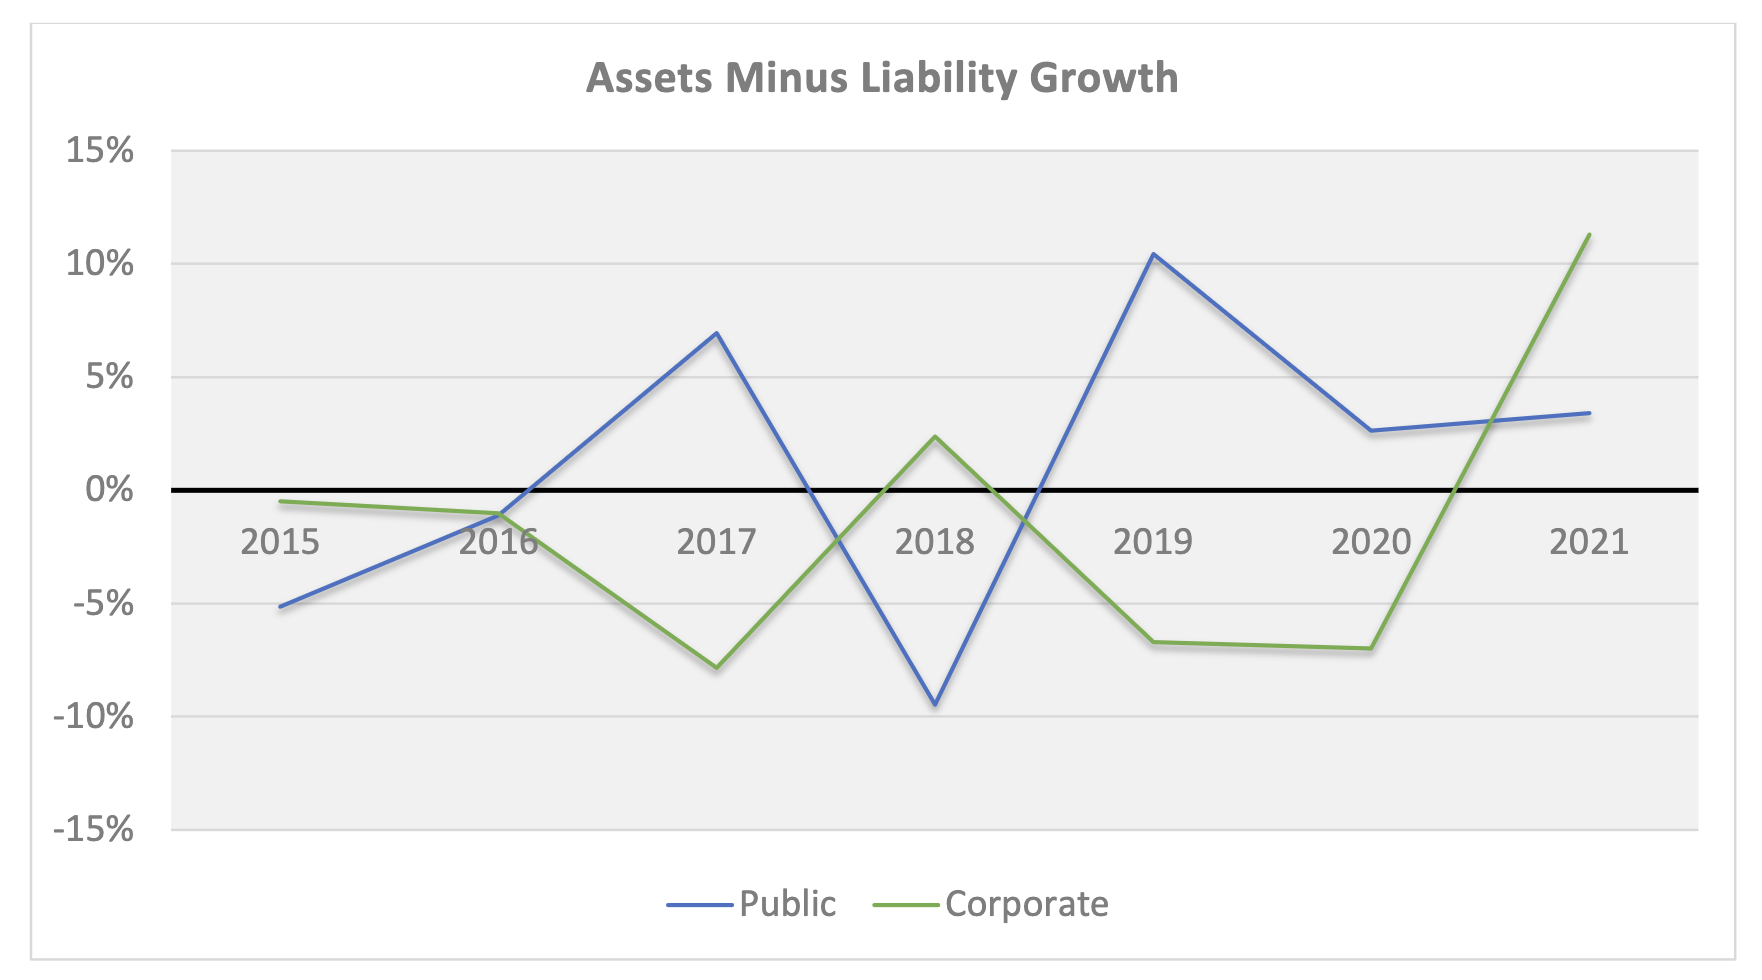
The table below compares these different liability growth rates (based on 12-year average duration) versus the asset growth rate based on the P&I asset allocation survey of the top 1,000 plans. The graph below shows the contrasting annual differences of asset versus liability growth for corporate and public plans since 2015.
| ASSET ALLOCATION | YTD 09/21 Return | Corporate | Public | Union |
|---|---|---|---|---|
|
Domestic Stock International Stock Global Equity Domestic Fixed Income Global Fixed Income Cash Private Equity Real Estate Equity Alternative Investments Other |
15.9% 8.3% 11.5% -1.6% -5.9% 0.1% 15.3% 10.5% 8.3% 8.3% |
10.6% 7.1% 13.3% 48.3% 0.7% 2.4% 6.2% 4.5% 4.6% 2.5% |
24.6% 16.9% 6.2% 21.0% 2.3% 2.0% 10.3% 8.7% 7.6% 1.4% |
24.7% 8.6% 11.4% 28.0% 0.9% 0.6% 8.2% 9.3% 8.3% 0.0% |
| TOTAL ASSETS Growth Rate | 5.0% | 8.7% | 8.4% | |
| LIABILITIES Growth Rate | -6.3% | 5.3% | 5.3% | |
| Asset Growth – Liability Growth | 11.3% | 3.4% | 3.1% |
Index Benchmarks: Domestic Stock = S&P 500; Int’l Stock = EAFE, Global Equity = All Country World; Domestic Fixed Income = BB Aggregate; Global Fixed Income = FTSE World Gov’t (unhedged); Cash = 3 mo. T-Bill; Private Equity =10-year return for the R2500 + 2%; Real estate Equity =NFI-DP Index; Alternative Investments and Other = CPI-U & 3%.
Footnote: The measurement of asset growth to liability growth is an annual calculation beginning on December 31, 2015. For periods shorter than 1-year, the observation is a YTD calculation.
Ryan ALM Pension Monitor 2Q ‘21
Ryan ALM Pension Monitor (Through June 30, 2021) Pension plan liabilities need to be measured and monitored regularly. Without knowledge of plan liabilities, the allocation of plan assets cannot be...
Source: Ryan ALM Pension Monitor 2Q
(Through June 30, 2021)
Pension plan liabilities need to be measured and monitored regularly. Without knowledge of plan liabilities, the allocation of plan assets cannot be done appropriately.
The funded ratio/status of pension plans are present value calculations. Each type of plan is governed by accounting rules and actuarial practices, which determine the discount rate used to calculate the present value of liabilities. Single employer corporate plans are under ASC 715 (FASB) discount rates (AA corporate zero-coupon yield curve); multiemployer plans and public plans use the ROA (return on asset assumption) as the liability discount rate. The difference in liability growth between these plans can be quite significant, which will affect funded status and contribution levels.
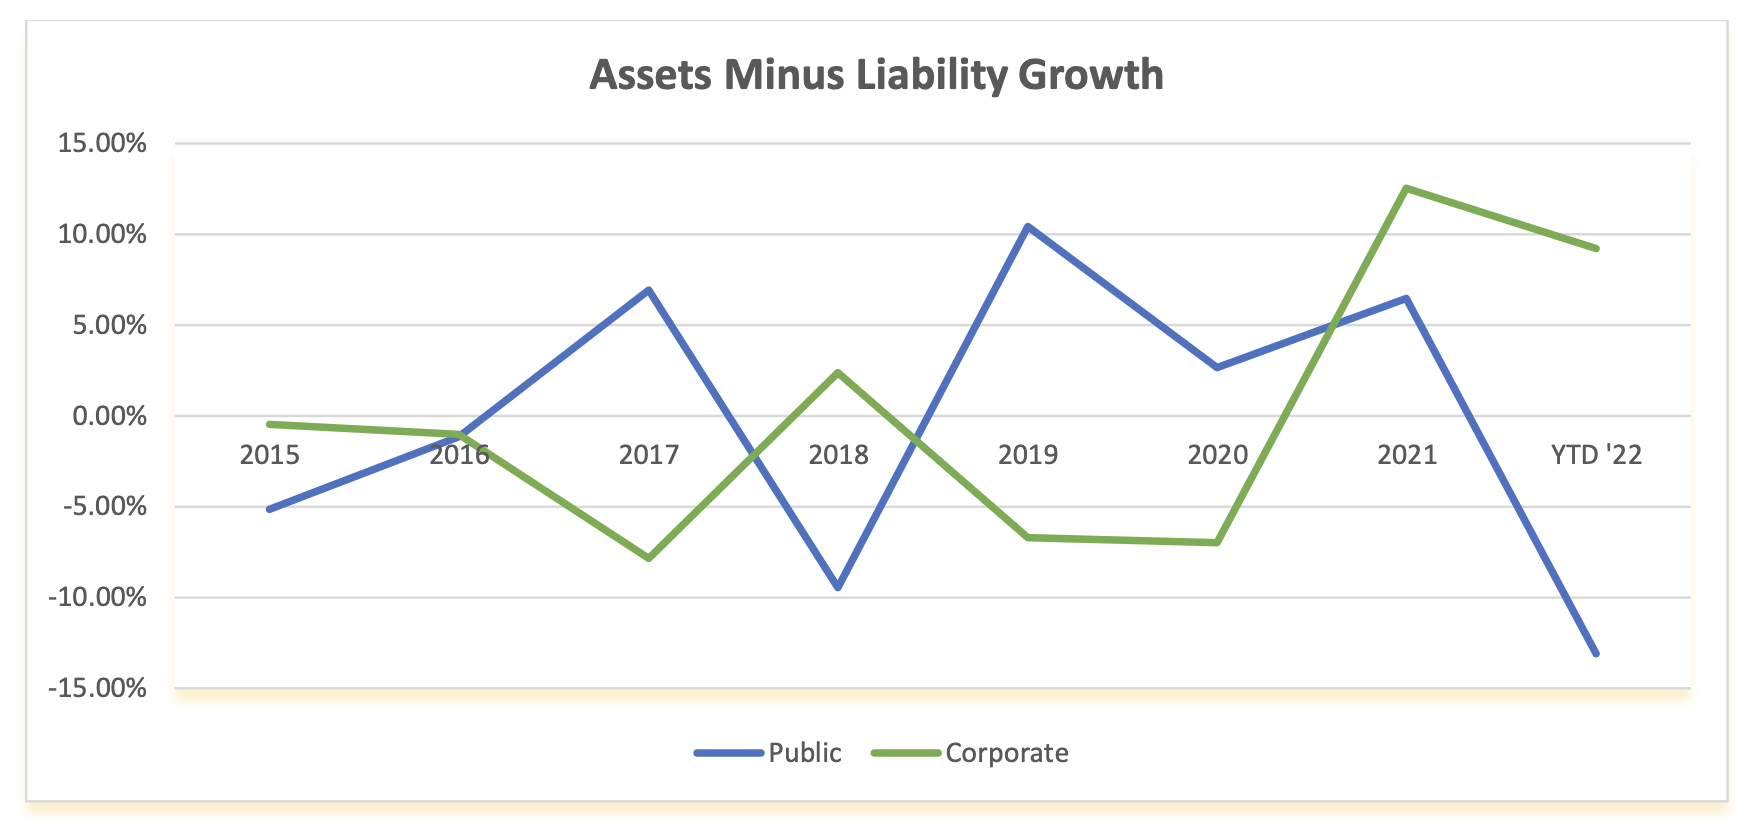
The table below compares these different liability growth rates (based on 12-year average duration) versus the asset growth rate based on the P&I asset allocation survey of the top 1,000 plans. The graph below shows the contrasting annual differences of asset versus liability growth for corporate and public plans since 2015.
| ASSET ALLOCATION | YTD Return | Corporate | Public | Union |
|---|---|---|---|---|
|
Domestic Stock International Stock Global Equity Domestic Fixed Income Global Fixed Income Cash Private Equity Real Estate Equity* Other |
-20.0% -19.2% -20.5% -10.4% -14.8% -0.1% 6.2% 6.9% 6.2% |
11.1% 6.5% 10.4% 46.7% 1.3% 2.0% 8.5% 4.1% 9.4% |
24.4% 16.3% 5.3% 20.2% 1.7% 2.0% 12.7% 7.9% 9.5% |
24.7% 8.6% 11.4% 28.0% 0.9% 0.6% 8.2% 9.3% 8.3% |
| TOTAL ASSETS Growth Rate | -9.2% | -9.5% | -10.3% | |
| LIABILITIES Growth Rate | -18.3% | 3.7% | 3.7% | |
| Asset Growth – Liability Growth | 9.1% | -13.2% | -14.0% |
Index Benchmarks: Domestic Stock = S&P 500; Int’l Stock = EAFE, Global Equity = All Country World; Domestic Fixed Income = BB Aggregate; Global Fixed Income = FTSE World Gov’t (unhedged); Cash = 3 mo. T-Bill; Private Equity =10-year return for the R2500 + 2%; Real estate Equity =NCREIF Index; Alternative Investments and Other = CPI & 3%.
Liabilities: ASC 715 discount rate, produced by Ryan ALM, is 2.35% and GASB ROA is 7.0% annually
Footnote: The measurement of asset growth to liability growth is an annual calculation beginning on December 31, 2015. For periods shorter than 1-year, the observation is a YTD calculation.
April Fools: Misleading Indicators
The Commerce Department reports with some glee that sales and income figures show an easing up of the rate of which business is easing off, which is taken as proof...
Source: April Fools: Misleading Indicators
The Commerce Department reports with some glee that sales and income figures show an easing up of the rate of which business is easing off, which is taken as proof that there is a slow down as well as a noticeable slowing up of a slowdown.
In order to clarify the cautious terminology of the experts, it should be noted that a slowing up of the slowdown is not as good as an upturn in the down curve, but it is a good deal better than either a speedup of the slowdown or a deepening of the down curve, and it does suggest that the climate is about right for an adjustment to the readjustment.
Turning to unemployment, we find a definite decrease in the rate of increase, which clearly shows that there is a letting up of the letdown. Of course, if the slowdown should speed up, the decrease in the rate of increase of unemployment would turn into an increase in the rate of decrease of unemployment. In other words, the deceleration would be accelerated.
But the indicators suggest a leveling off, referred to on Wall Street as a bumping along rock bottom. This will be followed by a gentle pickup, then a faster pickup, a slowdown of the pickup, and finally a leveling off again.
It is hard to tell, before the slowdown is completed, whether a particular pickup is going to be fast. At any rate, the climate is right for a pickup this season, especially if you are about twenty-five, unmarried, and driving a red convertible.
It’s April 1… don’t be fooled!