
Ryan ALM
White Papers
Browse
What’s It All About? Liabilities!
Most institutional assets are required to fund some type of liability objective (Pensions, OPEB, Lottery, Endowment & Foundation) yet liabilities tend to be missing in every function related to assets:...
Source: What’s It All About? Liabilities!
Most institutional assets are required to fund some type of liability objective (Pensions, OPEB, Lottery, Endowment & Foundation) yet liabilities tend to be missing in every function related to assets:
Asset Allocation – is focused on achieving an absolute rate of return (ROA) which has nothing to do with a liability objective. The proof: how could a 60% and a 90% funded pension plan have the same or similar ROA? Wouldn’t the 60% funded plan have to work harder? This common focus is really assets versus assets (as measured by some index benchmarks) and not assets versus liabilities.
Asset Management – most asset classes are given some generic index benchmark as their return focus. Obviously no generic index could ever represent the unique liability cash flows of each client.
Performance Measurement – once again we have assets versus assets (generic index benchmarks). If an asset class outperforms its generic index benchmark does that mean assets have outgrown liability growth? Of course not! This is again a complete disconnect which plaques most institutional comparisons.
Solutions:
Ryan ALM has developed a turnkey system of products that are a best fit to achieving the true liability objective of institutions:
Custom Liability Index (CLI) – In 1991, the Ryan team developed the CLI as the proper benchmark for any liability objective. The CLI is a monthly report that calculates what liability cash flows assets must fund. For pensions, this is usually the net monthly liability cash flows (after contributions). The CLI is in harmony with clients’ actuarial projections since that is the data used to construct the CLI.
Liability Beta Portfolio™ (LBP) – The LBP is our proprietary cash flow matching (CFM) model which will fully fund monthly net liability cash flows at a low cost to our clients. Usually, the LBP will reduce funding costs by roughly 2% per year (20% for 1-10 years). Our LBP is a good fit as the liquidity assets so there is no need for a cash sweep that takes income from all asset classes to fund benefits + expenses (B+E). Since the LBP is focused on liability cash flows (future values or FV) it mitigates interest rate risk as well because FVs are not interest rate sensitive.
Performance Attribution Report (PAR) – Our proprietary PAR product provides 14 risk/reward calculations of the LBP versus the CLI, providing even more evidence of value added (in addition to cost savings + mitigation of interest rate risk) since our LBP should outyield and outgrow the CLI.
Asset Exhaustion Test (AET) – Our AET will calculate the true ROA needed to fully fund net liability cash flows. Quite often this calculated ROA is much lower than the current ROA used for asset allocation. Developing an AET should be a first step in the asset allocation process in determining the allocation to the liquidity bucket (LBP assets).
Observations:
The intrinsic value in bonds is the certainty of their cash flows. Bonds are the only asset class with certainty of their cash flows. That is why bonds have been the logical choice for Dedication and Defeasance using Cash Flow Matching (CFM) strategies since the 1970s. Only CFM is a best fit for any liability driven objective. The primary objective of a pension is to secure benefitsin a cost-efficient manner. Our CFM product (LBP) will secure and fully fund benefits by matching asset cash flows monthly versus liability cash flows. This matching process is done chronologically for as far out as the plan sponsor deems necessary.
Furthermore, it would be wise to separate liquidity assets (liability Beta assets) from growth assets (liability Alpha assets). The Beta assets should be the bond allocation to cash flow match the net liability cash flows (after contributions) chronologically for a target horizon. This will buy time for the risky assets (Alpha) to grow unencumbered since you have certainty of the Beta assets’ cash flows for as long a period as you want. A study of S&P data by Guinness Global highlights that dividends and dividends reinvested account for about 47% of the S&P 500 total return on rolling 10-year periods dating back to 1940 and 57% for 20-year horizons. So why would you want to dilute equity returns with a cash sweep? Since we are dealing with net liabilities (after contributions) a 15% LBP allocation may fund liabilities out to 10-years or more, especially given the higher U.S. interest rate environment.
Observations and Benefits of LBP:
No change in Cash and Bond allocation
No dilution of Alpha assets to fund B + E
Reduces funding costs by about 2% per year
Mitigates interest rate risk (funding future values)
Secures + fully funds monthly B+E chronologically
Eliminates the need for a cash sweep which dilutes equity returns
LBP will out yield current bond managers and enhance the ROA
Cash flow matching buys time for Alpha assets to grow unencumbered
Generic bond indexes cash flows look nothing like the projected benefit payment schedule
This leads to a mismatch of cash flows and risk/reward behaviors… serious issues over time
Alpha assets need time to perform without any dilution of their cash flows to pay benefits so they shouldn’t be a source of liquidity. Use CFM as the liquidity assets.
Logic:
Let the performance assets (Alpha assets) perform by growing unencumbered as the liquidity assets (Beta assets) provide cash flows sufficient to fully fund benefits plus expenses chronologically.
The Pension Crisis of 2000-02
In my 2013 book “The U.S. Pension Crisis” I detailed the causes of the 2000-02 pension crisis where funded ratios deteriorated significantly from a surplus position in the 1990s. This...
Source: The Pension Crisis of 2000-02
In my 2013 book “The U.S. Pension Crisis” I detailed the causes of the 2000-02 pension crisis where funded ratios deteriorated significantly from a surplus position in the 1990s. This created a spike in contribution costs for many years which I labeled as the U.S. pension crisis… it was actually a contribution cost crisis. Contribution costs for many pensions rose quickly by 5x to 10x or even more in a short period of time. This led many cities and states into a budget shock and some even filed for bankruptcy (i.e. Detroit, Harrisburg, Jefferson County, Stockton).
The major cause of this dilemma, I reasoned, was the asset allocation objective of achieving a ROA (about 8.00% then). This was in sharp contrast and conflict with the true pension objective… to fund benefits (liabilities) in a cost-effective manner with prudent risk.
With funded ratios in a surplus position in the late 1990s. most pension plans could have defeased their liabilities with a bond allocation that used a cash flow matching (CFM) strategy. This CFM strategy would have secured benefit payments and kept contribution costs very low. This used to be called Dedication in the 1970s and 1980s and was a widespread strategy then. CFM gives certainty that the asset cash flows will fully fund the liability cash flows at the lowest cost to the plan sponsor. But because interest rates were well below the ROA of 8.0% in the late 1990s, asset allocation models heavily skewed their weights to equities and other non-bond risky assets to try to earn this 8.0% ROA hurdle rate.
When the equity correction hit in 2000 it was quite severe for pensions. Not only did the equity assets have negative growth but due to a secular decline in interest rates from 1982 this translated into high pension liability growth since they behave like bonds. According to Federal Reserve calculations, the average asset growth for public pensions underperformed the average liability growth by about 73% in the period 2000-02 as follows:
| Assets | Liabilities | Difference | Cumulative | |
|---|---|---|---|---|
| 2000 | -2.50% | 25.96% | -28.46% | -28.46% |
| 2001 | -5.40% | 3.08% | -8.48% | -37.60 |
| 2002 | -11.41% | 19.47% | -30.88% | -73.40% |
2000AssetsLiabilitiesDifferenceCumulative2000-2.50%25.96%-28.46%-28.46%2001-5.40%3.08%- 8.48%-37.602002-11.41%19.47%-30.88%-73.40%
This underperformance caused pension funded ratios to go from a nice surplus to a deep deficit creating the spike in contribution costs. According to the Federal Reserve System data the average funded ratio for state pension funds was 58.9% as of 2002 from a surplus position in 1999.
for their asset allocation models. According to the 2024 Milliman study the average asset allocation for public pensions is skewed to equities at 76% with bonds at 21% down from 24% 10 years ago.
Given the performance of equities in recent years, we may be nearing a correction similar to 2000-02 based on some key criteria:
Reversion to the Mean
This is a common and logical concept. The S&P 500 has a mean return of 9.75% for 20 years and 9.90% for 30 years with dividends. The last 5 years has a mean return of 11.33% and 10 years = 12.39%. This suggests a possible negative growth for the near future to revert to the mean.
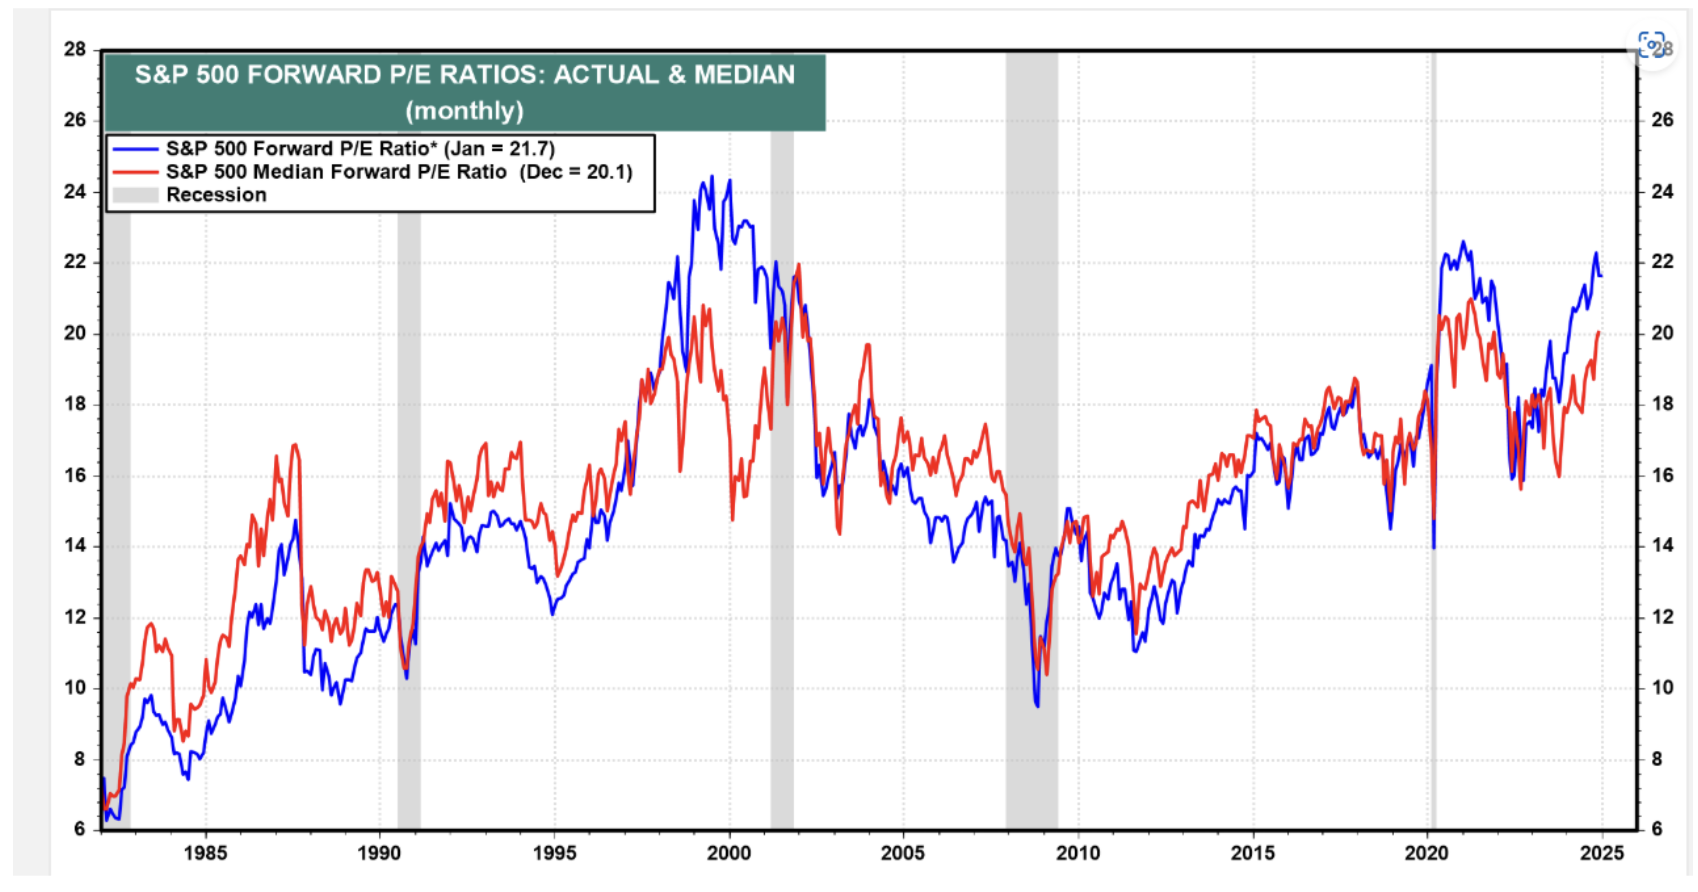
P/E Multiple
Valuation is another key determinant. Based on forward earnings, the current forward P/E for the S&P 500 is around 24.26x today. The graph below by Yardeni shows it at 21.7x on Jan. 23. The point here is that the forward P/E today is above the median P/E of 20.1x and is near a 25 year high which happened in 2000.
Déjà Vu
Pensions need to protect and enhance their funded status. They cannot afford volatility in the funded ratio and contribution costs. Now is the time to address asset allocation by shifting assets to a cash flow matching strategy. We recommend a minimum of defeasing the 1-10 year liability cash flows. This would buy time for the risky assets to grow unencumbered and recover from any correction. It also eliminates the need for a cash sweep that reduces the ROA of stocks significantly.
What’s Better For a Pension?
Asset returns are uncertain and very volatile. The S&P 500 is a good example. Since 1990 this index has enjoyed 13 years of 20% + growth. Unfortunately, it was accompanied...
Source: What’s Better For a Pension?
Asset returns are uncertain and very volatile. The S&P 500 is a good example. Since 1990 this index has enjoyed 13 years of 20% + growth. Unfortunately, it was accompanied with several negative return years which brought the average 20 year return down to 9.75%:
The decades of the 2000s began with three negative return years for the S&P 500 as follows:
2000 = (9.03%) 2001 = (11.85%) 2002 = (21.97%)
This combined with a secular decline in interest rates made liability growth spike by 55.12% in those three years (according to the Ryan ALM Liability Index) causing funded ratios to drop significantly by as much as 47%. This brings up the commonsense math… if funded ratios go down about 50%, they need to have assets outgrow liabilities by about 100% to get back to full funding. Since the return on assets (ROA) forecast is not based on the funded status but on the expected return of the plan’s asset allocation, the actuarial projections must make up the funded status deficit by increasing contributions. Most pension plans have experienced spiking contributions costs since 2000 which I proclaimed as the primary impetus for the US pension crisis in my 2013 book (The U.S. Pension Crisis). The uncertainty and volatility of the actual ROA has plagued pensions forever and will continue if this remains the focus of asset allocation.
Since the true objective of a pension is to secure benefits in a cost-efficient manner with prudent risk then asset allocation should be focused on this objective and not an ROA objective, which doesn’t guarantee success. This is best accomplished by bifurcating assets into liquidity (Beta) and growth (Alpha) assets. The liquidity or Beta assets should fully fund the liability cash flows (benefits + expenses) chronologically with certainty for as long as the allocation will cover. We define risk as the uncertainty of achieving the objective. So, the least risky asset strategy is to cash flow match (defease) the liability cash flows with certainty. Depending on the plan’s funded status will dictate the asset allocation between the liquidity and growth assets. The funded status is best measured by the
Asset Exhaustion Test (AET) which compares the annual asset cash flows (including contribution) versus the annual liability cash flows (including benefits + expenses).
Ryan ALM recommends starting with an allocation to liquidity or Beta assets that fully funds the liability cash flows for the next 10 years. Then we run the AET to see what ROA is needed for the residual growth assets to fully fund the residual liability cash flows. If the calculated ROA is lower than the current ROA assumption, you can allocate more to the liquidity assets and vice versa.
The benefits of the Ryan ALM cash flow matching strategy (Liability Beta Portfolio™) are numerous and significant:
Reduces risk (de-risks) by cash flow matching liability cash flows with certainty
No interest rate risk since it is funding future values (B+E liability payments)
Provides timely and proper liquidity to fully fund benefits + expenses (B+E)
AET will calculate proper allocation between liquidity and growth assets
AET will calculate ROA needed to fully fund liability cash flows
Reduces funding costs by about 2% per year (1-10 years = 20%)
Reduces asset management costs (Ryan ALM fee = 15 bps)
Reduces volatility of the funded ratio and contributions
Buys time for the Alpha assets to grow unencumbered
No need for a cash sweep to meetliquidity needs
In summary, a LBP cash flow matching strategy for liquidity assets will reduce funding costs by about 2% per year (1-10 years = 20%) while fully funding the liability cash flows with certainty. This will reduce the volatility of the funded status and allow plan sponsors and their consultants to better plan asset allocation for the growth assets. By eliminating a cash sweep, the growth assets can now reinvest their income and enhance their ROA. So, I ask once again: What is better for a pension plan? A 20% asset gain or a 20% liability cost reduction? It is clearly the cost reduction given the certainty of the outcome!
Pension Strategy to Reduce Funding Costs by 20%+
The true objective of a pension is to secure and fully fund benefits in a cost-efficient manner with prudent risk . It is a liability and cost objective… it is...
Source: Pension Strategy to Reduce Funding Costs by 20%+
The true objective of a pension is to secure and fully fund benefits in a cost-efficient manner with prudent risk. It is a liability and cost objective… it is NOT a return objective! This objective is best accomplished through a cash flow matching strategy where an optimal bond portfolio will fully fund monthly benefits + administrative expenses net of contributions. Bonds are the only asset class with certainty of its cash flows. That is why bonds have been the asset choice to defease liabilities for over 50 years.
Cash flow matching (CFM) used to be called Dedication in the 1970s and 1980s. As the head of Fixed Income Research at Lehman in the 1970s and early 1980s, I was in charge of our Dedication model. When I created my initial firm in 1984 (Ryan Financial Strategy Group), I hired the two professors in charge of Dedication at I.P. Sharpe to build our model. At Ryan ALM, we have rebuilt a CFM model that best fits any liability objective. The Ryan ALM CFM strategy utilizes our proprietary cost optimization model that will fully fund monthly net liabilities and reduce funding costs by about 2% per year. If we CFM 1-10 years of net liabilities, we should be able to reduce funding costs by about 20%, 1-15 years = 30%, etc. In addition to reducing funding costs, CFM has several benefits that should be utilized and recognized. We strongly urge pensions to consider CFM as the core portfolio that best fits the true pension objective and provides many additional benefits as listed below:
Cash Flow Matching – Provides Liquidity
The intrinsic value of bonds is the certainty of their cash flows! If bonds were used to cash flow match and fund net liabilities (benefits - contributions) chronologically they would produce the liquidity needed to fully fund such net liabilities. Cash flow matching works best with longer coupon bonds where you use semi-annual interest income cash flows to partially fund liabilities. A 10-year bond has 20 interest cash flows + one principal cash flow all priced at a 10-year yield. This would eliminate the need to do a cash sweep of other asset classes which is a common liquidity procedure. According to S&P data, the S&P 500 has 48% of its historical returns from dividends and reinvestment since 1940 on a 10-year rolling period basis. Wouldn’t you want to reinvest dividends back into growth assets rather than spend it on funding benefits + expenses? Wouldn’t you want the ROA of growth assets enhanced?
Cash Flow Matching - Provides TIME
Ryan ALM, Inc. released a 2022 research report titled “Most Important Asset of a Pension… Time!”. By using bonds as the liquidity assets, the growth assets are left unencumbered to grow. The longer the cash flow matching period, the more time the growth assets have to compound their growth. This could significantly enhance the ROA. By cash flow matching net liabilities chronologically, Ryan ALM can buy the time a plan sponsor and their consultant feel is necessary for the growth assets to grow unencumbered… and recover from negative return years. When markets correct and go down (i.e. 2022) it may take several years to recover and achieve the average annual target ROA that was assigned to that asset class.
Cash Flow Matching – Provides Inflation Hedge
Ryan ALM released a 2020 research report and pension alert titled “Pension Inflation =/= CPI”. Pension inflation has three parts: a cost of living adjustment (COLA) lives; a salary increase factor for active lives and a forecast of administrative expenses. The COLA may be based on the CPI but with a floor and a cap or even a % of the CPI while the salary and administrative expense increases tend to be quite static @ 3% annual increase. As a result, pension inflation tends to be less volatile and more static than the CPI. The plan sponsor actuary includes pension inflation in their projected benefit + expenses payment schedule for both retired and active lives. This fact suggests clearly that the best way (and only way) to hedge pension inflation is to cash flow match the actuarial projected benefits + expenses. If you cash flow match the actuarial projections, you have defeased liabilities and hedged pension inflation.
Cash Flow Matching – Outyields Benchmark and Bond ROA
The Ryan ALM cash flow matching product (Liability Beta Portfolio or LBP) is heavily skewed to A/BBB corporate bonds while the BB Aggregate is heavily skewed to Government bonds. As a result, the LBP will outyield the BB Aggregate by a significant yield spread… usually 50 – 75 bps, which will enhance the ROA of bonds.
Higher Yields are Good for Cash Flow Matching… and Pensions
Ryan ALM released a topical 2022 research report titled “Why Higher Interest Rates are Good for Pensions”. Pension funds are highly interest rate sensitive! Certainly, fixed income assets are such that the longer their maturity and effective duration, the greater their interest rate sensitivity. But it is pension liabilities that are more interest rate sensitive. Liabilities behave like a 100% zero-coupon bond portfolio because the discount rate(s) chosen price liabilities as zero-coupon bonds. This causes liabilities to be longer in duration then the same maturity(s) coupon bonds. Many discount rates are a yield curve of rates (ASC 715, PPA, PBGC, IASB). As interest rates trend higher, bonds can cash flow match liabilities at lower and lower costs. Note that cash flow matching is focused on funding B + E which are future values. Future values are not interest rate sensitive. Bonds are the only asset class with the certainty of cash flows (future values). That is why bonds have always been used as the methodology for defeasance (cash flow matching) of liabilities. Moreover, if interest rates trend upward any reinvestment of cash flow can buy future value at a lower cost. As a result, cash flow matching sees higher interest rates as an opportunity to reduce funding costs. The Ryan ALM cash flow matching product can reduce funding costs by @ 20% for most pension liabilities out to 10 years. In contrast, bonds used as performance or growth assets could see negative returns… like 2022. Total return performance is not the value in bonds… the certainty of cash flow is the intrinsic value. We urge pensions to transfer their bond allocation from focusing on outperforming some generic bond index to focusing on cash flow matching liabilities chronologically, especially at today’s higher rates.
Reminder: The ROA is Plural… ROAs
Ryan ALM, Inc. released a topical 2022 research report titled “The Pension ROA is plural… ROAs” that details how the ROA is calculated. Each asset class is askby using their index benchmark as the target return proxy. However, for fixed income it is the YIELD of the index benchmark… not the total return like other asset classes. The Bloomberg Barclay Aggregate is most favored as the bond index benchmark. This index and almost all popular bond index benchmarks were designed at Lehman Bros. by me (Ron Ryan) when I was the head of Fixed Income Research & Strategy from 1977 to 1983. Please note… each asset class is NOT required to earn the pension fund ROA assumption (@ 6.50% today). This is an important fact to remember in asset allocation. We at Ryan ALM often hear the criticism and question… how can we invest in 4% bonds to earn our ROA? The answer is bonds do NOT need to earn the pension ROA… just their assigned ROA (yield of index benchmark) in the asset allocation model.
The Smartest Beta
The term “beta” is credited to William F. Sharpe, Ph.D. in his 1964 work in development of the “Capital Asset Pricing Model (CAPM)”. It means (1) the covariance of the...
Source: The Smartest Beta
The term “beta” is credited to William F. Sharpe, Ph.D. in his 1964 work in development of the “Capital Asset Pricing Model (CAPM)”. It means (1) the covariance of the return on a security or portfolio with that of the market portfolio divided by (2) the variance of the return on the market portfolio. Professor Sharpe originally called this “market sensitivity” since you are comparing an investment to the market as defined by a market index. A beta of 1.0 suggests you have no residual risk in that you match the risk/reward behavior of the market index you are being compared against. Ideally, a market index fund should consistently have a market beta of 1.0.
Beta is a measurement based on a market or objective index. Without the index benchmark there is no applicable beta calculation. Traditionally, this has been the popular index benchmarks (i.e. S&P 500, Lehman Aggregate, etc.) but in truth it can be any index that best represents the objective of such funds (i.e. ETFs, index funds). Back in 1964 there was the absence of market indexes so beta was limited mainly to a measurement versus the S&P 500. The first bond index was introduced by Kuhn Loeb in 1973 (merged into Lehman in 1977). Since the advent of ETFs in 1993 there has been numerous new indexes created to feed the explosive growth of ETFs. Such new indexes are the stated objective of these many new ETFs.
Smart Beta
Smart beta is the optimization of the risk/reward behavior of a market index usually by changing the weights. Popular smart beta weighting schemes have been: fundamental weighting, equal-weighting, risk-clusters, and diversity weighting (combines equal and cap weighting). By changing the weights methodology the goal is to enhance returns or reduce volatility or both. Smart beta products have grown well in a short period of time but for the most part are still equity index derivatives. Rob Arnott and Research Affiliates, LLC have been a leader here introducing fundamental weighting for both bond and stock indexes as risk/reward value-added.
There is debate as to whether changing the weight methodology of a market index is really active management or an alpha strategy rather than a beta strategy or discipline. My recommendation is that the objective decides what is beta and alpha. What is important is to have the objective defined by a rules based index. If this reweighted index is the stated objective of an ETF, mutual fund or client then beta is the portfolio that matches the risk/reward of this objective index version. It also follows that alpha is the excess return versus this modified index objective. All comparisons to the traditional generic market index are just good information to know but do not determine the alpha and beta calculations.
Liability Beta Portfolio (The Smartest Beta)
The “smartest beta” portfolio is the portfolio that best matches and achieves the true client objective with the least amount of risk and cost. Risk is best measured as the uncertainty of achieving the objective. Cost is the amount required to fund the objective. The true objective of most institutions and even individuals is some type of liability (annuities, banks, insurance, lotteries, NDT, OPEB, pensions, etc.). The absolute level of volatility of returns is not risk given a liability objective. Indeed a 10-year liability payment is best matched and funded (defeased) by a 10-year Treasury STRIPS which has a certain future value. A three month T-bill would be very risky given this liability objective as it has 39 reinvestment moments of uncertainty. Although the 10-year Treasury STRIPS would be much more volatile in returns, such a return pattern would match the present value behavior of the 10-year liability and thus be low risk or even risk-free (defeasance).
Given a liability objective it is critical to create a custom liability index (CLI) as the proper benchmark. It must be a custom index since liabilities are like snowflakes… you will never find two alike. The CLI is a portfolio of liability payments weighted by the schedule of payments (term structure). Most institutional liabilities are calculated by actuaries who produce an actuarial projection of the liability payment schedule for each client. As such, the CLI is weighted by the actuarial projection in present value dollars. To calculate the present value of each liability payment you need to price liabilities based on a yield curve of discount rates. Depending on the type of liability there are accounting rules (ASC, FASB, GASB, IASB, PPA, etc.) that dictate the discount rate methodology.
Most, if not all, liabilities are priced as zero-coupon bonds since they produce a certain future value. Using U.S. corporate pensions, as an example, they are regulated by ASC 715 (formerly FAS 158) for GAAP accounting purposes. These rules suggest pricing liabilities as if they were AA corporate zero-coupon bonds. Since such bonds are not available in the bond market, they have to be manufactured as hypothetical zero-coupon bonds. As a result, liabilities behave like a yield curve of zero-coupon bonds weighted by the actuarial projections. This means that pension liabilities are extremely interest rate sensitive.
The CLI should calculate all of the necessary statistics to maintain and monitor a liability beta portfolio: term structure weights, total present value, YTM, duration, growth rate, interest rate sensitivity. The CLI is also the proper benchmark to measure liability alpha. If equity assets outperform the S&P 500 but underperform the CLI growth rate… did you earn alpha? In the eyes of the client you lost to liability growth which will damage the funded ratio (assets/liabilities), credit rating and increase contribution cost. Liability alpha is the excess return versus the CLI return (growth rate) and not versus a market index return. Based on Ryan ALM indexes, liability YTD returns through November 30 should be between 12.7% (10-year duration) and 22.2% (15-year duration). Hard to believe that any pension has earned liability alpha so far in 2014.
The key point here is that the client objective is truly the focus and determinant of relative risk and reward (beta and alpha). The client objective is to fund liabilities in such a way that risk and cost are reduced and stable over a long horizon. Given a long average life (duration) based on the liability payment schedule then the liability beta portfolio needs to match these term structure weights. An S&P 500 index fund or any generic market index fund could never represent the beta portfolio for a liability driven objective. Cash or a money market fund is a very risky investment for most liability objectives that have long average lives (duration).
The most appropriate and smartest beta portfolio is the one that matches the liabilities cash flow as measured by the CLI. In essence, the smartest beta portfolio is a custom liability index fund. Such a portfolio should be the core portfolio for any liability objective. By matching the liability term structure the uncertainty risk of matching liabilities is eliminated and interest rate sensitivity is neutralized. By matching the liability term structure with bonds that have higher yields and lower present values (price) than the discount rates used… you have reduced costs. Since the accounting rules (ASC 715, IASB, and PPA) use AA zero-coupon discount rates then a liability beta portfolio of A and BBB will produce higher yields and lower costs. This should provide significant cost savings of 10% to 15%. This matching process is called cash flow matching. Beware of duration matching strategies (i.e. immunization) which do not match the liability cash flows but just the average duration. This is not an accurate or cost effective way to match liabilities. The smartest beta portfolio is a liability cash flow matched portfolio!
Optimizing Asset Allocation
The asset allocation decision is the single most important asset decision since it affects all assets and the funded status of a pension plan. Strategic asset allocation (AA) takes a...
Source: Optimizing Asset Allocation
The asset allocation decision is the single most important asset decision since it affects all assets and the funded status of a pension plan. Strategic asset allocation (AA) takes a long-term view and establishes weights for each asset class in order to achieve the highest probability of earning the target return on assets (ROA). These weights tend to be static and not responsive to the funded status. Tactical AA is a short-term view that changes the strategic weights due to a market opportunity it is trying to capture. Responsive AA is when AA responds to the ever-changing funded ratio and funded status. Since the true objective of a pension is to secure benefits (liabilities) in a cost-efficient manner with reduced risk over time… responsive AA is the more appropriate methodology.
It should be obvious that a 60% and a 90% funded plan should have two very different asset allocations. But if they have the same or similar ROA they will have the same or similar strategic or tactical asset allocations. Focusing on the ROA has misled most plan sponsors down a return objective path instead of a liability objective direction. This ROA focused road has been a roller coaster of volatile funded ratios and spiking contribution costs.
Responsive AA requires accurate and current knowledge of the true economic funded status (assets MV / liabilities MV and assets MV – liabilities MV). This is difficult due to annual accounting and actuarial reports that are usually months delinquent and don’t calculate the economic market value of liabilities (i.e., GASB accounting). Assets need to know what they are funding (benefits + expenses). Assets need to outgrow liabilities to enhance the funded status, so assets need to know the market value and growth rate of liabilities. Assets need a scoreboard of asset growth vs. liability growth that is updated frequently to help them play the pension game.
Custom Liability Index (CLI)
The solution to the accounting and actuarial delinquent information is a Custom Liability Index (CLI). In 1991, Ron Ryan and his team invented the first CLI as the best representation of the true client objective. Although funding liabilities is the true objective, liabilities tend to be missing in action in asset allocation, asset management, and performance measurement. The reason for this disconnect is the absence of a Custom Liability Index (CLI) that monitors the present value, term structure, and risk/reward behavior of liabilities. Once a CLI is installed as the proper benchmark, then and only then can the asset side function effectively on asset allocation, asset management, and performance measurement.
Liabilities are like snowflakes… you will never find two alike. Pension liabilities are unique to each plan sponsor. As a result, only a Custom Liability Index could ever properly represent or measure these unique liabilities of any plan sponsor. A CLI should be calculated accurately and frequently so the plan sponsor and its consultant can be informed with timely data that can support the asset allocation decision. Assets need to know what they are funding. The economic truth is… assets fund the net liabilitiesafter contributions. Our CLI will provide both a gross and net liability valuation based on market rates (ASC 715 and Treasury STRIPS) as well as the discount rates that apply (ROA, ROA bifurcated with 20-year munis, PPA spot rates, and PPA 3-segment). The CLI will provide a monthly or quarterly calculation of the current present value of liabilities so the funded ratio and funded status can be updated… and a monthly or quarterly calculation of the liability growth rate so performance measurement of total assets vs. total liabilities can be assessed.
Since current assets fund net liabilities after contributions, current assets need to know the projected benefits, expenses, and contributions for every year as far-out as the actuary calculates such projections. Noticeably, contributions are a missing asset in the calculation of the funded ratio / funded status and usually play no role in the asset allocation strategy of most plan sponsors. Given the size of contributions today, it is critical that contributions should be a major consideration in the asset allocation strategy.
Asset Exhaustion Test (AET)
We commend GASB accounting for requiring a test of solvency whereby the plan’s actuary must calculate and present proof that projected benefits + expenses (B+E) will be fully funded from both a return on asset (ROA) assumption + projected contributions. If the assets fail this test, then the GASB ROA discount rate is bifurcated at the time that assets are exhausted, and liabilities are then discounted at a 20-year AA muni rate going forward. Ryan ALM modifies the AET to calculate the ROA needed to fully fund (B+E) – C. This calculated ROA should help AA understand the minimum ROA or target return needed to fully fund net liabilities. Asset allocation needs to know the hurdle rate that has to be achieved to fully fund B+E with help from contributions. Our experience has been that this calculated ROAis always much different than the normal ROA used today. Usually, it is a much lower ROA rate for plans that pass this solvency test since contributions are a major contributor while it could be much higher for plans that fail this test. We highly recommend that all pensions apply this modified AET test of solvency to provide AA with the proper ROA target return rate.
Asset Allocation (AA)
As stated previously, Asset allocation is the single most important asset decision as it controls the risk/reward behavior of 100% of the assets. Since it will greatly affect the funded ratio and funded status, the success or failure of the asset allocation strategy is the single most important asset decision. Pension consultants are very diligent in their AA recommendation for each client to achieve the ROA hurdle rate. It is our recommendation that the asset allocation strategy should be based on the funded ratio (present value of assets/liabilities), funded status (present value of assets – liabilities) and the modified AET with a calculated ROA. Logically, a large deficit status should have a more aggressive asset allocation strategy than one with a surplus or fully funded status. Unfortunately, the funded ratio tends to play little or no role in many asset allocation strategies today. Most often the asset allocation focus is on achieving the return on asset (ROA) assumption… an absolute return target.
Since the true plan objective is to secure benefits in a cost-efficient manner with reduced risk over time, asset allocation needs to be in harmony with this objective. We recommend that asset allocation separate assets into liability Beta and liability Alpha assets. The liability Beta assets are to secure benefits by cash flow matching liabilities through a structured bond portfolio (defeasance). This should be the core portfolio of the pension plan since it best represents the true objective. The liability Alpha assets job is to outgrow liabilities in $s to enhance the funded status such that contribution costs are reduced over the life of the plan. In order for contributions to be reduced, pension assets must outgrow pension liabilities in $s. A simple example might explain this better:
| Begin | Growth Rate % | Growth Rate $ | End | |
|---|---|---|---|---|
| Assets | $700m | 7.50% | $52.5m | $752.5m |
| Liabilities | $1 billion | 6.00% | $60.0m | $1.06b |
| Funded Ratio | 70.0% | 71.0% | ||
| Funded Status | -$300m | -$307.5m |
In this example assets outgrew liabilities in % return (7.50% vs. 6.00%). But because the funded ratio/status was a big deficit of 30%, the asset $ growth was less than the liability $ growth ($52.5m vs. $60.0m). This created a larger deficit that requires a larger contribution. In order to maintain the funded status at -$300m would require asset growth of $60.0m or an 8.57% return.
Only with a CLI can the plan know the true economic funded status on a routine basis. With the synergy of liability Beta and Alpha assets, AA now has the proper structure to achieve the true objective. Based on the economic funded status AA can now determine the allocation between these two asset groups. With a modified AET, AA now knows the calculated ROA needed to fully fund net
liabilities. The plan return objective should be for assets to outgrow liabilities in $s… it is the relative $ returns that count not an absolute % return (ROA). Asset allocation models need to focus on enhancing the funded status by creating liability Alpha in $s… not an absolute % return target (ROA).
Asset allocation needs to be responsive to this ever-changing net funded ratio/status. Strategic and Tactical asset allocation do not respond to the funded status. A responsive asset allocation responds to the funded status through a process called Portable Alpha. If the liability Alpha assets exceed liability growth in $s (as measured by the CLI), a prudent discipline is to transfer (port) this excess $ return over to the liability Beta assets. This will secure more benefits and reduce more volatility on the funded status. Just like the gambler in Las Vegas… take your winnings off the table to reduce your risk of losing! Asset allocation needs to recognize and respond to the funded status. A Portable Alpha strategy does this as a procedure or discipline thereby protecting the plan, so it doesn’t become too risky or chase the wrong ROA objective.
Performance Measurement
In harmony with the true pension objective, assets need to be measured vs. the risk/reward behavior of the CLI. This should be the acid test of asset allocation. Total asset growth must outperform total liability growth in $s for the funded ratio and funded status to be enhanced. Without a CLI, such a measurement would be difficult and certainly not timely. Total asset growth should be measured and monitored vs. total liability growth routinely (quarterly) for every investment review meeting. However, liability growth and the current funded status are usually MIA. The CLI will correct this error of omission. A simple warning is applicable here: If you outperform the S&P 500 and any generic market index benchmark but lose to liability growth… the plan sponsor loses!
Obviously, there is no victory or liability Alpha earned if asset growth underperforms liability growth although traditional performance measurements vs. generic market indexes could suggest otherwise. All liability Beta and liability Alpha assets need to be in sync with the true objective of enhancing the funded ratio, the funded status, and reducing contribution costs.
Conclusion
Traditional asset allocation models are focused on achieving the ROA assumption. This is not the true or proper pension objective. Until a Custom Liability Index (CLI) is installed as the proper benchmark and an AET is performed, asset allocation will be disconnected from the true liability objective. Contributions should be a major consideration in the asset allocation process since they are a large future asset that enhances the funded status. Contributions are the first source to pay the current liabilities due each year, thereby reducing the liabilities current assets need to fund. This net liability needs to be calculated and monitored by the CLI on a frequent basis. Since full funding is the goal, asset allocation needs to know the annual hurdle rate or calculated ROA needed to reach this funding status. The modified AET will provide the calculated ROA needed to fully fund net liabilities (B+E) – (C). A Portable Alpha strategy will then rebalance the asset allocation accordingly by taking the excess returns over net liability growth as measured by the CLI (liability Alpha) and porting them over to the liability Beta assets. Performance measurement will then monitor total asset vs. total liability growth to verify that the pension plan is on the proper road to full funding.
Pension Solutions Series Part 3 - Asset Exhaustion Test (AET)
Pension Solution: Asset Exhaustion Test (AET) The primary pension objective is to secure promised benefits (Retired Lives) in a cost- effective manner (stable to lower contribution costs) with prudent risk...
Source: Pension Solutions Series Part 3 - Asset Exhaustion Test (AET)
Pension Solution: Asset Exhaustion Test (AET)
The primary pension objective is to secure promised benefits (Retired Lives) in a cost-effective manner (stable to lower contribution costs) with prudent risk. In our last Pension Solution blog, we explained that this is best accomplished through cash flow matching with fixed income… hopefully through our Liability Beta Portfolio™ (LBP). We recommend that our LBP should fund the first 10-years of NET Retired Lives (after Contributions). This buys time for the Alpha assets (performance assets) to grow without being diluted to fund any benefits. This leaves the residual liabilities to be monitored and funded through Alpha assets. As a result, the Alpha assets need to know their target ROA that will fully fund residual liabilities. This requires an Asset Exhaustion Test (AET).
Asset Exhaustion Test (AET)
GASB 67/68 requires an AET. We recommend this test for all pension plans. The AET requires projected contributions be subtracted from projected benefits to get a net liability schedule. The assets are then grown at an actuarial driven ROA to see if they fully fund these annual net liabilities. If the assets are exhausted, GASB requires the discount rate to be bifurcated and the area of future deficits to be discounted at the AA muni 20-year index rate. We have always recommended a market rate to discount all liabilities to calculate the true economic present value of liabilities so the economic funded status can be known. We also recommend that contributions be included as an asset or liability offset in the funded status calculation.
Ryan ALM modifies the GASB AET into a matrix that calculates the ROA needed to fully fund the net liabilities to be fully funded by the Alpha assets. Asset allocation needs to know its target ROA in order to function efficiently. A 5.27% ROA should have a different asset allocation than an 8.23% ROA. Since contributions are included in the ROA as an asset or liability offset, the calculated ROA is way lower than without contributions included. The point here is that assets need to know what their required hurdle rate is… or target ROA. Without this calculation, asset allocation is misaligned and may invite more risk into the equation than needed. A calculated ROA should be a requirement for asset allocation.
Ryan ALM, Inc. is an asset/liability manager specializing in cash flow matching thru a proprietary cost optimization model called the Liability Beta Portfolio™.
The Smartest Beta
The term “beta” is credited to William F. Sharpe, Ph.D. in his 1964 work in development of the “Capital Asset Pricing Model (CAPM)”. It means (1) the covariance of the...
Source: The Smartest Beta
The term “beta” is credited to William F. Sharpe, Ph.D. in his 1964 work in development of the “Capital Asset Pricing Model (CAPM)”. It means (1) the covariance of the return on a security or portfolio with that of the market portfolio divided by (2) the variance of the return on the market portfolio. Professor Sharpe originally called this “market sensitivity” since you are comparing an investment to the market as defined by a market index. A beta of 1.0 suggests you have no residual risk in that you match the risk/reward behavior of the market index you are being compared against. Ideally, a market index fund should consistently have a market beta of 1.0.
Beta is a measurement based on a market or objective index. Without the index benchmark there is no applicable beta calculation. Traditionally, this has been the popular index benchmarks (i.e. S&P 500, Lehman Aggregate, etc.) but in truth it can be any index that best represents the objective of such funds (i.e. ETFs, index funds). Back in 1964 there was the absence of market indexes so beta was limited mainly to a measurement versus the S&P 500. The first bond index was introduced by Kuhn Loeb in 1973 (merged into Lehman in 1977). Since the advent of ETFs in 1993 there has been numerous new indexes created to feed the explosive growth of ETFs. Such new indexes are the stated objective of these many new ETFs.
Smart Beta
Smart beta is the optimization of the risk/reward behavior of a market index usually by changing the weights. Popular smart beta weighting schemes have been: fundamental weighting, equal-weighting, risk-clusters, and diversity weighting (combines equal and cap weighting). By changing the weights methodology the goal is to enhance returns or reduce volatility or both. Smart beta products have grown well in a short period of time but for the most part are still equity index derivatives. Rob Arnott and Research Affiliates, LLC have been a leader here introducing fundamental weighting for both bond and stock indexes as risk/reward value-added.
There is debate as to whether changing the weight methodology of a market index is really active management or an alpha strategy rather than a beta strategy or discipline. My recommendation is that the objective decides what is beta and alpha. What is important is to have the objective defined by a rules based index. If this reweighted index is the stated objective of an ETF, mutual fund or client then beta is the portfolio that matches the risk/reward of this objective index version. It also follows that alpha is the excess return versus this modified index objective. All comparisons to the traditional generic market index are just good information to know but do not determine the alpha and beta calculations.
Liability Beta Portfolio (The Smartest Beta)
The “smartest beta” portfolio is the portfolio that best matches and achieves the true client objective with the least amount of risk and cost. Risk is best measured as the uncertainty of achieving the objective. Cost is the amount required to fund the objective. The true objective of most institutions and even individuals is some type of liability (annuities, banks, insurance, lotteries, NDT, OPEB, pensions, etc.). The absolute level of volatility of returns is not risk given a liability objective. Indeed a 10-year liability payment is best matched and funded (defeased) by a 10-year Treasury STRIPS which has a certain future value. A three month T-bill would be very risky given this liability objective as it has 39 reinvestment moments of uncertainty. Although the 10-year Treasury STRIPS would be much more volatile in returns, such a return pattern would match the present value behavior of the 10-year liability and thus be low risk or even risk-free (defeasance).
Given a liability objective it is critical to create a custom liability index (CLI) as the proper benchmark. It must be a custom index since liabilities are like snowflakes… you will never find two alike. The CLI is a portfolio of liability payments weighted by the schedule of payments (term structure). Most institutional liabilities are calculated by actuaries who produce an actuarial projection of the liability payment schedule for each client. As such, the CLI is weighted by the actuarial projection in present value dollars. To calculate the present value of each liability payment you need to price liabilities based on a yield curve of discount rates. Depending on the type of liability there are accounting rules (ASC, FASB, GASB, IASB, PPA, etc.) that dictate the discount rate methodology.
Most, if not all, liabilities are priced as zero-coupon bonds since they produce a certain future value. Using U.S. corporate pensions, as an example, they are regulated by ASC 715 (formerly FAS 158) for GAAP accounting purposes. These rules suggest pricing liabilities as if they were AA corporate zero-coupon bonds. Since such bonds are not available in the bond market, they have to be manufactured as hypothetical zero-coupon bonds. As a result, liabilities behave like a yield curve of zero-coupon bonds weighted by the actuarial projections. This means that pension liabilities are extremely interest rate sensitive.
The CLI should calculate all of the necessary statistics to maintain and monitor a liability beta portfolio: term structure weights, total present value, YTM, duration, growth rate, interest rate sensitivity. The CLI is also the proper benchmark to measure liability alpha. If equity assets outperform the S&P 500 but underperform the CLI growth rate… did you earn alpha? In the eyes of the client you lost to liability growth which will damage the funded ratio
(assets/liabilities), credit rating and increase contribution cost. Liability alpha is the excess return versus the CLI return (growth rate) and not versus a market index return. Based on Ryan ALM indexes, liability YTD returns through November 30 should be between 12.7% (10-year duration) and 22.2% (15-year duration). Hard to believe that any pension has earned liability alpha so far in 2014.
The key point here is that the client objective is truly the focus and determinant of relative risk and reward (beta and alpha). The client objective is to fund liabilities in such a way that risk and cost are reduced and stable over a long horizon. Given a long average life (duration) based on the liability payment schedule then the liability beta portfolio needs to match these term structure weights. An S&P 500 index fund or any generic market index fund could never represent the beta portfolio for a liability driven objective. Cash or a money market fund is a very risky investment for most liability objectives that have long average lives (duration).
The most appropriate and smartest beta portfolio is the one that matches the liabilities cash flow as measured by the CLI. In essence, the smartest beta portfolio is a custom liability index fund. Such a portfolio should be the core portfolio for any liability objective. By matching the liability term structure the uncertainty risk of matching liabilities is eliminated and interest rate sensitivity is neutralized. By matching the liability term structure with bonds that have higher yields and lower present values (price) than the discount rates used… you have reduced costs. Since the accounting rules (ASC 715, IASB, and PPA) use AA zero-coupon discount rates then a liability beta portfolio of A and BBB will produce higher yields and lower costs. This should provide significant cost savings of 10% to 15%. This matching process is called cash flow matching. Beware of duration matching strategies (i.e. immunization) which do not match the liability cash flows but just the average duration. This is not an accurate or cost effective way to match liabilities. The smartest beta portfolio is a liability cash flow matched portfolio!