
Ryan ALM
White Papers
Browse
When is a Pension Fully Funded?
The Funded Ratio tends to be the acid test and benchmark for funded status… but is it? We have written several research white papers (www. RyanALM/Research/White Papers) about the glaring...
Source: When is a Pension Fully Funded?
The Funded Ratio tends to be the acid test and benchmark for funded status… but is it? We have written several research white papers (www. RyanALM/Research/White Papers) about the glaring issues with the Funded Ratio. Here are just a few of the inconsistencies with the Funded Ratio:
Actuarial Value versus Market Value
The Funded Ratio (FR) of a pension is usually based on the actuarial value of assets / actuarial value of liabilities. The Funded Status (FS) is the actuarial value of assets – actuarial value of liabilities. Actuarial values are different than market values… sometimes quite different. Market values are the better measurement of economic reality since you can’t spend actuarial dollars. As a result, this valuation difference can seriously distort the FR and FS calculation.
Present Value versus Future Value
Notably, the FR and FS are present value calculations. But pension liability cash flows (benefits + expenses (B+E)) are future value (FV) projections. Since the FV of most assets is not known this becomes a true pension conundrum. Bonds are the only asset class with a known and certain future value. That is why bonds have been the chosen asset class for defeasance, immunization and cash flow matching for several decades. The disconnect between PVs and FVs haunts pensions. The true objective of a pension is to secure and fully fund liability cash flows in a cost-efficient manner with prudent risk. As a result, the objective should be for asset cash flows to match and fully fund liability cash flows.So, when is a pension fully funded... when asset cash flows (future values) fully fund liability cash flows (future values). This is best accomplished thru cash flow matching and is best measured by the Asset Exhaustion Test.
Contributions = MIA
The FR and FS both ignore contributions as an asset. The truth is that contributions are future assets and should be a high consideration in any asset liability management (ALM). We recommend using the Ryan ALM modified Asset Exhaustion Test (AET) as the best way to measure the solvency and funding status of a pension. We take asset cash flows (based on a ROA) and compare them to NET liability cash flows (benefits + expenses – contributions) to understand if assets can fully fund the liability cash flows. We use a matrix of ROAs to determine what ROA is the best fit. This calculated ROA is in sharp contrast to the current ROA that is based on an asset allocation model that ignores the FR and FS. It is common that a pension plan with a 60% funded ratio and another funded at 90% have the same or similar ROA. How is this possible? Shouldn’t the 60% funded plan need assets to work harder? Yes, but that does not have anything to do with the current ROA calculation. Whatever shortfall there is in asset cash flows to fund liability cash flows (B+E) must be paid by higher contributions… this is not in the best interests of a pension plan and the sponsor’s budget. Clearly, the current ROA is not a calculated return based on the FR and FS that will guarantee a fully funded
status if achieved long-term… nor will it guarantee that contributions will go down. This has been a sad and costly trend for the last 25+ years.
Discount Rates
A most troubling issue is what discount rate to use. FASB and GASB tend to disagree on this.
FASB = high quality AA corporate zero-coupon yield curve
GASB = ROA
Since the ROA is a much higher rate (usually 100 to 200 bps) then liabilities would be priced at a much lower PV (12% to 24%). This would enhance the FR by 8% to 22%. Market rates are best in determining the market or economic value of liabilities. FASB 144 says it well:
“The objective of selecting assumed discount rates is to measure the single amount that, if invested at the measurement date in a portfolio of high-quality debt instruments, would provide the necessary future cash flows to pay the pension benefits when due. Notionally, that single amount, the projected benefit obligation, would equal the current market value of a portfolio of high-quality zero coupon bonds whose maturity dates and amounts would be the same as the timing and amount of the expected future benefit payments. The determination of the assumed discount rate is separate from the determination of the expected rate of return on plan assets”
Ryan ALM Solutions:
Custom Liability Index (CLI): The first step in prudent pension management is to calculate the liability cash flows that assets must fund. This should be a net liability cash flow (benefits + expenses – contributions). Until liabilities are monitored and priced as a Custom Liability Index (CLI) the asset side is in jeopardy of managing to the wrong objectives (i.e. ROA and generic market indexes). Only a CLI best represents the unique liability cash flows of a plan sponsor. Just like snowflakes, no two pension liability schedules are alike due to different labor forces, salaries, mortality and plan amendments. How could a static ROA or genericmarket indexes ever properly represent the risk/reward behavior of such a diverse array of pension liabilities? Once the CLI is installed, the pension can now know the true economic Funded Ratio and Funded Status which should dictate the appropriate Asset Allocation, Asset Management and Performance Measurement.
Asset Exhaustion Test (AET): GASB requires a test of solvency (AET) to document that the asset cash flows (at the ROA) will fully fund the net liability cash flows (benefits + expenses – contributions). GASB correctly understands that assets are funding net liabilities after contributions… and that contributions are future assets. This net liability is rarely focused on by the asset side in asset allocation. Ryan ALM enhances the asset exhaustion test by calculating the ROA that will fully fund net liability cash flows. Usually, we find that a lower ROA can accomplish this goal and is a better fit than the current ROA. This would suggest a more conservative asset allocation and a heavier allocation to fixed income to defease liability cash flows chronologically. This is a common and serious issue. This calculated ROA should be the asset allocation model focus. We urge all pensions to incorporate this modified AET before acting on asset allocation.
Liability Beta Portfolio™ (LBP):The intrinsic value in bonds is the certainty of its cash flows. That is why bonds have been used for decades to defease liability cash flows. The core or Beta portfolio for a pension should be in investment grade bonds that cash flow match and fully fund liabilities chronologically thereby buying time for the growth (Alpha) assets to outgrow liabilities and erase the deficit. The proper Beta portfolio for any liability objective should be… a Liability Beta Portfolio™. Ryan ALM has developed a LBP which will cash flow match liabilities chronologically and reduce funding costs by about 2% per year (1-10 years = 20%) as well as reduce the volatility of the Funded Status and contribution costs. The LBP should be the core portfolio of any pension and replace active fixed income management. By matching and funding liabilities chronologically, the LBP buys time for the growth or Alpha assets (non-bonds) to perform. By working in harmony with the Alpha assets the plan can gradually enhance its funded status and reduce contribution costs.
Liability Alpha Assets: The non-bond assets should be managed vs. the CLI to exceed liability growth (earn liability Alpha) and enhance the economic Funded Status. The goal here is outgrow liabilities in $s (relative returns) by enough to erase the deficit over a time horizon equal to the average life (duration) of liabilities (calculated by the CLI). As the Alpha assets achieve the required annual Alpha, any excess returns vs. liability growth should be ported over to the Liability Beta Portfolio™ to secure the victory. Had this been in place during the decade of the 1990s when pensions had surpluses… there would be no pension deficits today.
Liability Beta vs. Market Beta
Beta is a term first pioneered by PhD. William Sharpe in his 1970 book “Portfolio Theory and Capital Markets”. Here he introduced his famous capital asset pricing model (CAPM) which...
Source: Liability Beta vs. Market Beta
Beta is a term first pioneered by PhD. William Sharpe in his 1970 book “Portfolio Theory and Capital Markets”. Here he introduced his famous capital asset pricing model (CAPM) which presented the idea that individual investments contain two types of risk: Systematic and Unsystematic risk.
Systematic risk was deemed to be market risk that cannot be diversified away while unsystematic risk was deemed to be the specific risk of that investment (i.e. credit, features, etc.) that can be diversified away through adding other investments to the portfolio. Modern portfolio theory (MPT) shows that unsystematic risks can be removed or reduced through portfolio diversification. The problem that remains is that of market risk.
The Notre Dame fixed income indexes study of 1986 proved that the market risk for bonds is interest rate risk which is quite dominate. Their calculations showed that interest rate risk explained or accounted for 96% plus of the total return for the major bond index aggregates. This study further proved that interest rate is best measured by a yield curve that is well diversified by maturity or duration (term structure). Any bond index that does not have a distinct term structure is not a good measurement of bond market risk.
Through time, it became obvious how difficult it was for active management to consistently outperform a market index as a benchmark (especially after fees). This led to Index Funds as a major asset management style. The growth in this form of asset management has been dramatic especially when including the explosive growth of exchange traded funds (ETFs).
With the advent of Portable Alpha as a strategy, assets are divided into two groups: Alpha and Beta. A Portable Alpha strategy transfers (ports) the excess return (Alpha) over to the Beta portfolio to secure the victory. The Beta portfolio is considered the portfolio that matches the objective as an index benchmark (i.e. Index Fund) and Alpha is considered the portfolio that outgrows (excess return) the index objective.
Given the currentasset liability management(ALM)or liability driven investment (LDI) trends, it has become obvious that the true objective of a pension is to fund a liability schedule unique to each plan sponsor. Since the objective of a pension (and most institutional objectives) is liability driven shouldn’t the terms Beta and Alpha be redefined for any LDI objective. After communication with PhD. William Sharpe years ago, he suggested I qualify my research as Liability Beta and Liability Alpha to distinguish it from market beta and market alpha. I agree, that makes good sense.
Market Beta and Alpha
Most asset managers are given an index bogey or objective that best represents the asset class risk/reward behavior that the client has chosen as the objective of such asset allocation. Asset consultants are quite diligent in selecting and monitoring the asset managers to perform under these index objectives. The goal could be to either match the risk/reward behavior (Beta portfolio or index fund) or outperform the return behavior (earn Alpha). A few good questions here are: if your asset managers earn market Alpha, does that mean they earned liability Alpha? If all asset managers outperformed their index bogey but total assets underperformed liability growth, did the client win or lose? Did asset allocation create value added (Alpha)?
Liability Beta and Alpha
Several strategies exist to match pension liabilities (cash flow matching, duration matching, derivatives, interest rate swaps, etc.). These liability Beta portfolios are to match the liability cash flow schedule (cash flow matching) or interest rate sensitivity of liabilities (duration matching) or both. Liability Alpha is rarely a consideration yet this is how a pension improves its funding status and reduces pension costs (i.e. contributions). In the end, total assets must outgrow total liabilities over time to earn liability Alpha thereby enhancing the funded status and reduce pension costs.
Custom Liability Index
Given any liability driven objective, the proper index benchmark should be a Custom Liability Index (CLI) that best measures the size, shape and risk/reward behavior of these client specific benefit payment schedules. The Ryan ALM CLI is a monthly report that calculates the present value, growth rate and interest rate sensitivity of liabilities. Client liabilities are like snowflakes… you will never find two alike. Only a CLI could accurately represent the true pension objective. It should be obvious thatthe true objective of a pension is to fund their liabilities in a cost-efficient manner with prudent risk. It is difficult, if not impossible, for asset liability management (ALM) to function effectively without proper knowledge of the liability cash flows. In sports, the scoreboard dictates the strategy. The CLI is the pension scoreboard for liabilities. When compared to assets, the plan sponsor knows every month if they are winning or losing the pension game.
Current accounting rules and actuarial practices price liabilities as a zero-coupon bond portfolio at a single discount rate on an annual basis, months delinquent where the liability cash flow schedule (annual projections of benefits) is rarely seen. Moreover, this single discount rate may not be a market rate (GASB for public plans uses the ROA). Could any asset manager perform versus a generic market index if it came out annually, months delinquent where the index portfolio was not transparent and all issues were priced at the same yield? Sounds ridiculous … well, welcome to the current pension liability world we live in.
The Society of Actuaries (SoA) in their 2004 research paper addressed this situation citing that current accounting rules distort economic reality and urged pensions to create a set of economic books that price liabilities at the market on a frequent and accurate basis. Such economic books are best created and maintained as a Custom Liability Index. Indeed, until a Custom Liability Index is installed, the asset side cannot function effectively towards a liability objective. How could an asset allocation model function without correct input as to the true economic Funded Ratio (assets/liabilities) and the size of the economic deficit or surplus (funded status)? How could performance measurement be calculated quarterly without knowledge of the true economic liability growth rate (total return)? How could you match and fund assets to liabilities without a Custom Liability Index?
I designed the CLI over 32 years ago as the best representation and benchmark for any liability objective. The CLI is a monthly report that prices liabilities at the market (using either the Ryan ALM ASC 715 (AA corporates) discount rates or US Treasury STRIPS). The CLI calculates the true economic present value of liabilities and their growth rate so the funded status and performance measurement of assets versus liabilities can both be ascertained.
Lehman Aggregate and Generic Bond Indexes
As the designer of many of the popular Lehman bond indexes (now Bloomberg Barclay’s), I am honored by the acceptance of these bond indexes. However, it should be obvious that they do not behave like liabilities. All of the popular generic bond indexes are rules based. Such rules only use coupon bonds and do not have zero-coupon bonds. Mathematically, the longest duration of any coupon bond is around 17 years today. As a result, such bond indexes could not be a proxy for long duration liabilities or match these liabilities as an index fund. Furthermore, most pensions are weighted to long durations with an average pension fund in the 10 to 15-year average duration area. The Bloomberg Barclay’s Aggregate’s average duration is usually between four to five years … a definite mismatch to pension liabilities cash flow. Even the long Corporate or Credit index cannot match liabilities. It has two distinct rules based problems. First, it has no issues shorter than 10 years in maturity which leaves out a large and most important segment of liability cash flows. Second, it has no issues with durations longer than 17 years. This is an inappropriate proxy for any pension’s liabilities. It is not the average duration you are trying to match and monitor but the entire liability term structure (liability cash flows). Once again only a Custom Liability Index is the proper fit as a liability benchmark.
Liability Beta Portfolio™ (LBP)
If the Beta portfolio is the portfolio that matches the index objective (Index Fund) then given a liability objective, the proper liability Beta portfolio is … the portfolio that matches the liability objective (Liability Index Fund). To be accurate, you must fund each monthly liability payment.
The Ryan ALM LBP is a cash flow matching portfolio that matches and funds monthly liability cash flows chronologically. Our LBP is a cost optimization model that will produce the optimal lowest cost portfolio to fund the target liability cash flows. Our LBP should reduce funding costs by about 2% per year (1-10 year liability schedule = 20% funding cost savings)! Moreover, the LBP will outyield the CLI thereby providing liability Alpha similar to the yield difference which enhances the funded status. The Ryan ALM LBP should also mitigate interest rate risk (similar duration and term structure matching) and reduce pension expense, the volatility of the funded status and contributions.
The intrinsic value in bonds is the certainty of their cash flows. We urge pensions to use bonds for their value… to match bond cash flows that fund liability cash flows. We do not view bonds as performance vehicles or Alpha assets. They are best as liquidity assets to fund liabilities as they come due. By bifurcating liquidity assets from growth assets (Beta vs. Alpha assets) you BUY TIME for the Alpha assets to grow unencumbered. Many pensions use a “Cash Sweep” where they take away income from all asset classes to fund benefits + expenses (B+E). According to S&P 500 data, dividends reinvested accounted for: 47% of rolling 10 years returns since 1940. So let the bond allocation (liquidity assets) fund B+E which will buy time for the Alpha assets to grow significantly more.
“An error is not a mistake until you refuse to correct it” John F. Kennedy
Immunizing Pension Expense Volatility
Pension management is an Assets vs. Liabilities objective. Corporations tend to focus on pension expense since it is a direct hit to earnings and stockholder value. Corporations do not want...
Source: Immunizing Pension Expense Volatility
Pension management is an Assets vs. Liabilities objective. Corporations tend to focus on pension expense since it is a direct hit to earnings and stockholder value. Corporations do not want volatility on earnings coming from pension expense. The major factors affecting pension expense are the dollar growth of assets minus the dollar growth in liabilities. This is in sharp contrast to a % growth difference (ROA of assets – discount rate of liabilities). Pension expense is all about dollars not %. There are two primary liability driven investment (LDI) bond strategies in use today: Duration Matching and Cash Flow Matching.
Duration Matching
The purpose of duration matching is for assets to match the interest rate sensitivity of liabilities (immunization). The objective is to have the market value change (% growth rate) in the immunization bond portfolio match the % growth rate (discount rate) in liabilities for a given change in interest rates. Many LDI fixed income managers attempt to match the average duration of their bond portfolio to the average duration of a bond market index with a similar duration to liabilities (i.e., Bloomberg Barclays long corporate index). They use the bond index as a proxy for liabilities. There are several problems and flaws with this strategy.
A generic bond index cannot replicate any clients’ unique liabilities cash flows. Client’s liabilities are like snowflakes: different labor force, salaries, mortality, etc..
Average durations give erroneous information because there are a numerous number of combinations of maturities for a bond portfolio that can all have the same average duration, but they will not have the same risk/reward profile or interest rate sensitivity.
Duration matching is only accurate for small parallel shifts in the yield curve. But the yield curve rarely moves an equal number of basis points at every point along the curve.
FASB requires a single discount rate for financial statements which does not calculate a proper target duration. You need to use the ASC 715 discount rate yield curve.
LDI bond management evolved to remedy these flaws by using Key Rate durations which attempt to match the duration of multiple points along the liability yield curve. Key Rate duration is an improvement over a single average duration, but still has several deficiencies:
Actuaries usually do not provide the average duration of liabilities and the projected benefits in their annual actuarial report… reason why generic bond indexes are used.
Matching key rate durations of a generic market index = wrong Key Rate durations.
Duration is a present value calculation requiring pricing each projected benefit with a different discount rate (i.e., ASC 715 discount rates yield curve). As a result, 30 annual benefit payments require 30 separate discount rates and 30 key rate durations.
Duration must be modified (duration/1+YTM) to use as a price return or interest rate sensitivity measurement.
Solution: Dollar Duration Matching (DDM)
DDM matches the dollar value change per basis point change in yield for assets with the dollar value change per basis point change in yield for liabilities. When the dollar duration of assets is matched to the dollar duration of liabilities for every year in the term structure of liabilities, then DDM is in its most precise form. That would be the equivalent of 30 Key Rate durations… one at every point along the liabilities yield cure or benefit payment schedule (30 years = 30 key rate durations). Ryan ALM recommends DDM for Active Lives liabilities. The Ryan ALM DDM approach offers several value-added differences:
Actuarial Projections - We use the actuarial projected benefits of our clients and not a generic bond index benchmark.
Modified durations - to be an effective price sensitivity measurement, duration must be modified. Modified Duration measures the percent change in market value or present value for future value cash flows given a 100-basis point movement in yield.
Dollar duration - our objective here is to match the dollar value change per basis point in assets and liabilities in every annual liability maturity or duration.
The Ryan ALM DDM approach greatly improves the accuracy of Key Rate duration matching by matching the dollar value changes in liabilities with the dollar value changes in assets across the liabilities term structure. DDM is in harmony with the corporate objective of immunizing pension expense. The liabilities are measured and monitored by using a Custom Liability Index (CLI) to more precisely calculate the dollar value (PV) movement in assets versus liabilities given any movement in interest rates. The CLI is the most appropriate benchmark for any asset liability management (ALM) and should be the first step in any LDI strategy.
ASC 715 Discount Rates – Ryan ALM is one of few vendors providing ASC 715 discount rates (AA corporate zero-coupon bonds as a yield curve). We will price each actuarial projected benefit payment on a monthly basis.
Custom Liability Index (CLI) - The CLI provides all of the calculations needed for either dollar duration matching or cash flow matching. The CLI will calculate YTM, modified duration, actual growth rate and interest rate sensitivity for each projected benefit as a term structure as well as total liabilities showing both the % and $ change in present values.
Liability Beta Portfolio™ (LBP) – our LBP will dollar duration match or cash flow match projected benefits chronologically using our proprietary LBP cost optimization model that will secure benefits, reduce funding costs significantly as well as immunize interest rate sensitivity.
Solution: Cash Flow Matching (CDI)
Ryan ALM believes that the true objective for a defined benefit pension is to fund and secure benefits when due in a cost-efficient manner. The value in bonds is in the certainty of their known and scheduled cash flows which is why cash flow matching has been used as a major strategy for hedging liabilities for many decades (i.e., dedication, defeasance). It is the matching and funding of benefits (future values) that is the primary focus of cash flow driven investments (CDI). As such, future values are not interest rate sensitive… a major benefit of cash flow matching. Cash flow driven investing (CDI) dominates the way European pensions are managed under IASB accounting standards. Key Rate duration and especially dollar duration matching (DDM) are good for matching present value movements between assets and liabilities but do not focus on funding liability payments (future values). Pensions require liquidity that is sufficient and timely to fund benefits + expenses (B+E). CDI will cash flow match both B+E based on the actuarial projections. CDI is a best fit to fund Retired Lives given their higher degree of certainty. Active Lives might be best served with dollar duration matching (DDM) given the actuarial noise and uncertainty of such actuarial projections.
Since the primary value in bonds is in the certainty of their cash flows, Ryan ALM will cash flow match projected benefit payments chronologically. This provides numerous benefits:
Secures the benefits
Significantly de-risks the plan
Reduces funding costs significantly
Higher yielding bond portfolio than CLI + DDM
Provide adequate and timely liquidity to fund B+E
Reduces volatility of funded ratio and contributions
Buys time for performance assets (Alpha) to grow unencumbered
No interest rate risk since LBP is funding future values (benefit payments)
A major benefit of the Ryan ALM cash flow matching model is the reduction in funding costs by usually 1% per year. If we cash flow match 1-30 years of benefits = 30% cost reduction between the cost of benefits (future value) and the cost to cash flow match (present value). The CDI is skewed to A/BBB+ bonds and longer maturities to reduce funding costs. This will cause the CDI to outyield liabilities by 50-100 bps and DDM. Moreover, the CDI provides adequate and timely liquidity to fund B+E. Many, if not most, pensions do a cash sweep of all asset classes to fund current benefits + expenses. CDI will fund B+E when due which will buy time for the performance assets (Alpha) to grow unencumbered. S&P data shows that dividends reinvested > 50% of the S&P 500 growth in the last 70 years. If interest rates rise, cash flow matching can reinvest any excess cash flows at the then higher yields which will lower funding costs while bonds managed with a purely total return focus would get hurt with lower price returns.
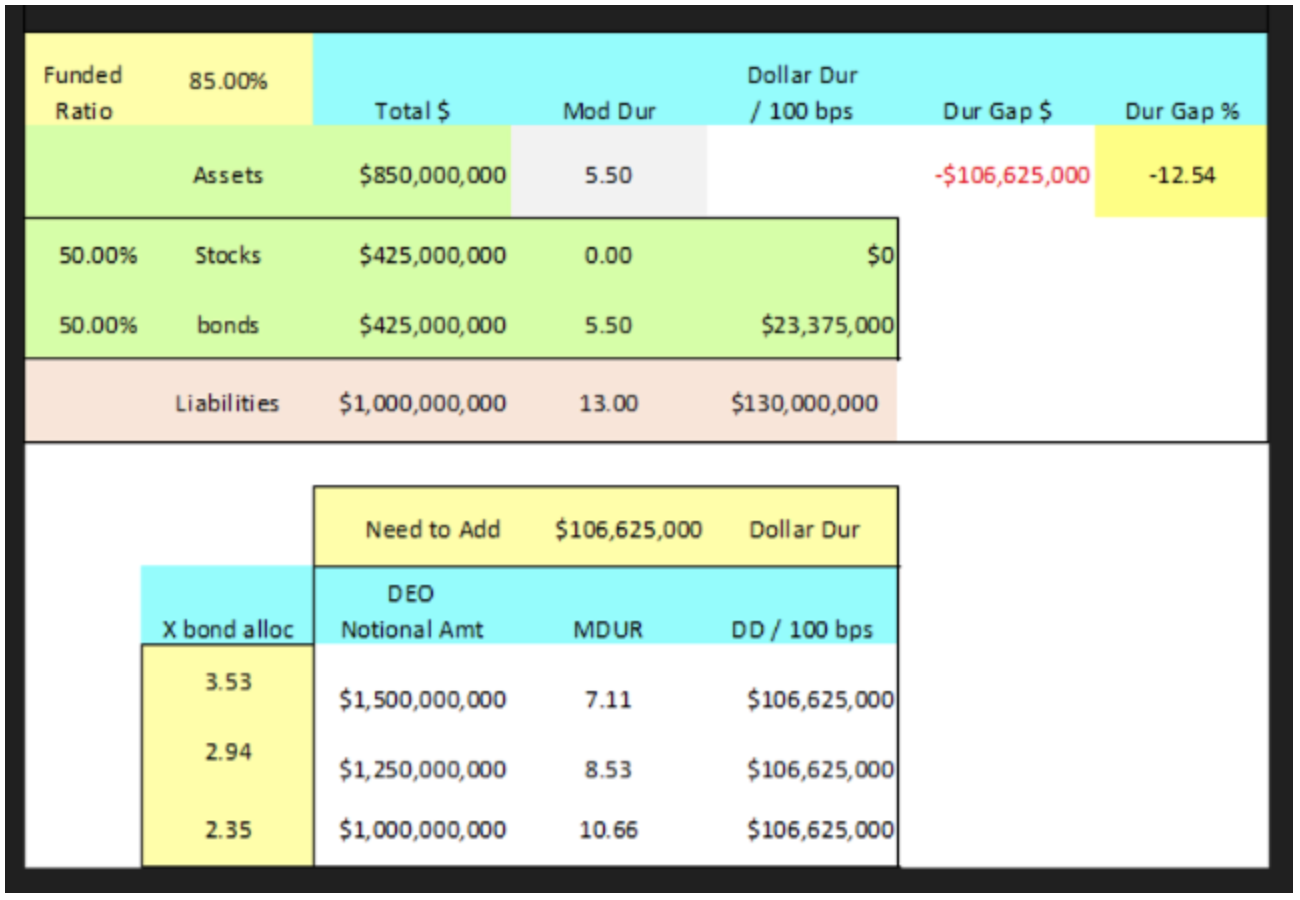
Solution: Duration Enhancing Overlay (DEO)
DDM and CDI cannot hedge 30+ year liabilities well due to the lack of bonds to buy. In a Duration Enhancing Overlay (DEO) strategy, derivatives are used to add duration. The assets in the DDM and CDI portfolios can be used as margin capital for targeted positions in interest rate swaps, swaptions or buy/sell Treasury Futures.
A Duration Enhanced Overlay (DEO) is a zero-investment strategy that can be constructed by taking long only derivatives positions like futures positions in long-dated Treasury bonds, or by taking positions in futures on long-dated treasury bonds while also taking the opposite positions in shorter term Treasury securities.
A DEO should be in addition to a CDI or DDM strategy not instead of. The issue becomes the size of the derivative contracts needed to close the duration gap. In the example below, it would take 2.2x to 3.5x the bond position to close the $ duration gap. Ryan ALM cautions against such a strategy as undue leverage but we admit the existence of a dollar duration gap.
Response to: Presidential Memo on Pensions
Response to: Presidential Memo on Pensions Mr. President, I applaud your memo of October 22 to the Secretaries of Treasury, Commerce and Labor. You gave them an order to review...
Source: Response to: Presidential Memo on Pensions
Response to: Presidential Memo on Pensions
Mr. President,
I applaud your memo of October 22 to the Secretaries of Treasury, Commerce and Labor. You gave them an order to review the Delphi pension matter and inform you “within 90 days of this memorandum of any appropriate action that may be taken, consistent with applicable law to (i) address affected Delphi retirees’ lost pension benefits and (ii) bring transparency to the decision to terminate the plan. This review shall include an evaluation of the feasibility of enacting legislation.”
The solution you are looking for can be found in the Butch Lewis Act (BLA) passed by the House through a bipartisan vote (all Democrats + 29 Republicans) on July 26, 2019 as H.R. 397. It has been awaiting approval by the Senate since then. The BLA would create a new agency under the Treasury Department called the Pension Rehabilitation Administration (PRA). The PRA would provide low-interest-rate loans to critical and declining multi-employer pensions at the 30-year Treasury rate plus a profit margin (@ 0.25%). The BLA would provide 100% payment of all retirees benefits in sharp contrast to the PBGC limit of $12,870 for a 30-years of services retiree ($35.75 x 12 months x years of service). The Council of Budget Office estimates the cost of the BLA at $34 billion (if no loans are repaid), which can be minimized by the fact that all PRA loans come with a profit margin. Even at $34 billion it is a small burden compared to the potential cost to cover 1.4 million workers’ pensions affected by the current pension crisis. The PBGC is not the answer… but the BLA is. I urge you to have the Senate approve the BLA legislation that is awaiting their approval for over 15 months now. Time is of the essence!
God Bless Pension America!
Pension Solutions Series Part 4 - Performance Measurement
Pension Solution: Performance Measurement Most pension assets are managed versus a market index as the objective or benchmark. However, the true objective of a pension is to fund the pension...
Source: Pension Solutions Series Part 4 - Performance Measurement
Pension Solution: Performance Measurement
Most pension assets are managed versus a market index as the objective or benchmark. However, the true objective of a pension is to fund the pension liabilities (benefit payments) at the lowest cost to the plan with prudent risk. No market index could ever represent the liability objective of any pension. Just like snowflakes, no two pension liabilities are alike due to each plan having a different labor force, salaries, mortality and plan amendments. As pensions have experienced too often, given the wrong index objective … you will get the wrong risk/reward profile!
This has been the pattern for most pension plans as their Funded Ratios have been on a roller coaster for several decades. Until the true liability objective of a pension plan (and any liability driven objective) is measured and monitored frequently and accurately, pension assets are in jeopardy of being managed to the wrong index objective(s). Until a Custom Liability Index is built and put in place as the proper benchmark, all asset decisions are in danger of being mismanaged. Given the wrong index objective(s), performance measurement will then provide inappropriate risk/reward measurements. It is rare that pension assets are ever compared to pension liabilities in performance measurement reports. It follows that if you outperform the S&P 500 or any market index but lose to liability growth …the pension plan loses!
Traditional generic bond indexes do a good job of measuring the risk/reward behavior of a market sector but have nothing to do with pension liabilities. Only a Custom Liability Index (CLI) could ever measure and monitor the risk/reward behavior of any pension liability cash flow schedule. Since contributions are the initial source to fund benefits, current assets fund net liabilities (benefits – contributions). Assets need to know what they are funding… net liabilities!
Solution: Performance Measurement
Once the Liability Beta Portfolio™ is installed to cash flow match net Retired Lives chronologically, you now need the Alpha assets to outgrow net residual liability growth (benefits – contributions of 10-year + Retired Lives and Active Lives)) to enhance the funded status. The CLI will provide the growth rate of net residual liabilities just like any index benchmark so performance measurement of Alpha assets versus net residual liabilities (as measured by the CLI) can be easily assessed. If Alpha assets can outgrow net residual liabilities, then the funded status will be enhanced and contribution costs should be reduced. The Ryan ALM Performance Attribution Report (PAR) will calculate:
eight measurements of risk
four measurements of reward
two measurements of risk-adjusted returns
Pension Solutions Series Part 3 - Asset Exhaustion Test (AET)
Pension Solution: Asset Exhaustion Test (AET) The primary pension objective is to secure promised benefits (Retired Lives) in a cost- effective manner (stable to lower contribution costs) with prudent risk...
Source: Pension Solutions Series Part 3 - Asset Exhaustion Test (AET)
Pension Solution: Asset Exhaustion Test (AET)
The primary pension objective is to secure promised benefits (Retired Lives) in a cost-effective manner (stable to lower contribution costs) with prudent risk. In our last Pension Solution blog, we explained that this is best accomplished through cash flow matching with fixed income… hopefully through our Liability Beta Portfolio™ (LBP). We recommend that our LBP should fund the first 10-years of NET Retired Lives (after Contributions). This buys time for the Alpha assets (performance assets) to grow without being diluted to fund any benefits. This leaves the residual liabilities to be monitored and funded through Alpha assets. As a result, the Alpha assets need to know their target ROA that will fully fund residual liabilities. This requires an Asset Exhaustion Test (AET).
Asset Exhaustion Test (AET)
GASB 67/68 requires an AET. We recommend this test for all pension plans. The AET requires projected contributions be subtracted from projected benefits to get a net liability schedule. The assets are then grown at an actuarial driven ROA to see if they fully fund these annual net liabilities. If the assets are exhausted, GASB requires the discount rate to be bifurcated and the area of future deficits to be discounted at the AA muni 20-year index rate. We have always recommended a market rate to discount all liabilities to calculate the true economic present value of liabilities so the economic funded status can be known. We also recommend that contributions be included as an asset or liability offset in the funded status calculation.
Ryan ALM modifies the GASB AET into a matrix that calculates the ROA needed to fully fund the net liabilities to be fully funded by the Alpha assets. Asset allocation needs to know its target ROA in order to function efficiently. A 5.27% ROA should have a different asset allocation than an 8.23% ROA. Since contributions are included in the ROA as an asset or liability offset, the calculated ROA is way lower than without contributions included. The point here is that assets need to know what their required hurdle rate is… or target ROA. Without this calculation, asset allocation is misaligned and may invite more risk into the equation than needed. A calculated ROA should be a requirement for asset allocation.
Ryan ALM, Inc. is an asset/liability manager specializing in cash flow matching thru a proprietary cost optimization model called the Liability Beta Portfolio™.
Pension Solutions Series Part 2 - Liability Beta Portfolio™ (LBP)
Pension Solution: Liability Beta Portfolio™ (LBP) The primary pension objective is to secure promised benefits (Retired Lives) in a cost- effective manner (stable to lower contribution costs) with prudent risk...
Source: Pension Solutions Series Part 2 - Liability Beta Portfolio™ (LBP)
Pension Solution: Liability Beta Portfolio™ (LBP)
The primary pension objective is to secure promised benefits (Retired Lives) in a cost-effective manner (stable to lower contribution costs) with prudent risk. This is best accomplished through cash flow matching.
Cash Flow Matching
Since benefits (liabilities) are future value numbers, it is consistent and necessary to match the future value of assets to the future value of liabilities. This is better said as cash flow matching asset cash flows to liability cash flows… cash flow driven investments (CDI). Since bonds are the only asset class with a known future value, it has been the obvious choice to cash flow match liabilities. Indeed, this is the true value of fixed income assets. In truth,cash flow matching the liability benefit payment schedule (liability cash flow) isthe ideal way to de-risk a pension plan. Since projected benefits (future values) are not interest rate sensitive, cash flow matching projected benefits eliminates the biggest risk in bonds… interest rate sensitivity.
Since contributions are the initial source to fund liabilities, current assets fund net liabilities (benefits – contributions). It is critical that current assets know what they are funding… net liabilities! Fixed income assets are best cash flow managed versus Retired Lives, which are the most certain and imminent liabilities. Active Lives tend to be the most uncertain cash flows (actuarial noise). Matching Retired Lives net liabilities chronologically is wise and recommended as it not only secures benefits over a certain time horizon, it buys time for the non-bond assets (Alpha assets) to perform and outgrow Active Lives liabilities. It would not be prudent to use volatile, risky assets to fund the shorter Retired Lives liabilities… too uncertain.
Ryan ALM has developed a cash flow matching model called the Liability Beta Portfolio™ (LBP). Our LBP is a cost optimization model that matches and funds Retired Lives monthly benefit payments chronologically at the lowest cost to the plan sponsor. Our LBP should reduce funding costs by 8% to 10% vs. 1-10 years Retired Lives. The true value in bonds is the certainty of their cash flows. We urge plan sponsors to transfer current active fixed income management from generic index benchmarks to our LBP to de-risk the plan gradually and reduce costs.
Asset Allocation
Asset allocation would be wise to separate Retired Lives from Active Lives and liability Beta assets from liability Alpha assets. We recommend using bonds cash flow matched to Retired Lives chronologically as the liability Beta assets and use Alpha assets (risky assets) for the Active Lives. The funded ratio should dictate the allocation to bonds. The higher the funded ratio: the higher the allocation to liability Beta assets. The pension plan’s current allocation to bonds should determine how much of the net liabilities bonds can cash flow match (i.e. 15% bond allocation might fund the next seven to 10-years of Net Retired Lives). By switching from traditional bond management and generic bond indexes to a Custom Liability Index coupled with a Liability Beta Portfolio will produce many benefits to the pension plan:
1. Reduce Funding Costs
The Liability Beta Portfolio should be the core portfolio since it best represents the true pension objective… securing benefits in a cost-effective manner. Our LBP will reduce funding costs by 8% to 10% in funding 1-10 years of Retired Lives. The true quest of any pension or liability driven objective is to reach and maintain a fully funded liability cash flow matched asset position. This can only be achieved with a cash flow matching bond portfolio. Any other asset class does not match the behavior of liabilities and creates the roller coaster effect of victories (surplus) and losses (deficits).
2. Reduces Volatility in Funded Ratio
If you match liabilities then you match the risk/reward behavior of the present value of liabilities. This eliminates the roller coaster effect that most plans have in their Funded Ratio due to a mismatching of assets vs. liabilities. This erratic growth difference between assets vs. liabilities plays havoc with budgets (i.e. Contributions), benefit decisions and financial statements.
3. Reduces Contribution Volatility and Cost
If you match liabilities then the funded ratio is less volatile which in turns means that contribution costs become less volatile. Our LBP will also outyield liabilities thereby creating some Alpha which will reduce Contribution costs.
4. Reduces Interest Rate Risk
Benefit payments are future value amounts which are not interest rate sensitive. By cash flow matching future values, we have neutralized interest rate risk.
5. Reduces Bond Asset Management Fees
The Ryan ALM Liability Beta Portfolio (LBP) has a low fee which should save clients about 50% on bond asset management fees.
6. Buys Time for Alpha assets
The LBP will match and fund Retired Lives chronologically. If the LBP funds 1-10 years of Retired Lives it buys 10-years of time for the Alpha assets to grow and perform. History tells us that risky assets do better the more time you give them to perform.
Pension Solutions Series Part 1 - Custom Liability Index (CLI)
Pension Solution: Custom Liability Index (CLI) Most pension assets are managed versus a market index as the objective or benchmark. However, the true objective of a pension is to fund...
Source: Pension Solutions Series Part 1 - Custom Liability Index (CLI)
Pension Solution: Custom Liability Index (CLI)
Most pension assets are managed versus a market index as the objective or benchmark. However, the true objective of a pension is to fund the pension liabilities (benefit payments) at the lowest cost to the plan with prudent risk. No market index could ever represent the liability objective of any pension. Just like snowflakes, no two pension liabilities are alike due to each plan having a different labor force, salaries, mortality and plan amendments. As pensions have experienced too often, given the wrong index objective … you will get the wrong risk/reward profile!
This has been the pattern for most pension plans as their Funded Ratios have been on a roller coaster for several decades. Until the true liability objective of a pension plan (and any liability driven objective) is measured and monitored frequently and accurately, pension assets are in jeopardy of being managed to the wrong index objective(s). Until a Custom Liability Index is built and put in place as the proper benchmark, all asset decisions are in danger of being mismanaged. Asset Allocation, Asset Management and Performance Measurement are all index driven. Given the wrong Funded Ratio, asset allocation will most probably function inappropriately. It follows that a pension plan with a surplus should have a different asset allocation than a plan with a large deficit. Such Funded Ratios need to be based on market or economic valuations not accounting or actuarial valuations. Given the wrong index objective(s), asset management will behave accordingly and produce an inappropriate risk/reward profile (same as index benchmark). Given the wrong index objective(s), performance measurement will then provide inappropriate risk/reward measurements. It is rare that pension assets are ever compared to pension liabilities in performance measurement reports. It follows that if you outperform the S&P 500 or any market index but lose to liability growth …the pension plan loses!
Traditional generic bond indexes do a good job of measuring the risk/reward behavior of a market sector but have nothing to do with pension liabilities. It is mission impossible for any generic index to measure the unique cash flows of any pension. Only a Custom Liability Index could ever measure and monitor the risk/reward behavior of any pension liability cash flow schedule.
Accounting and Actuarial Reports
Most accounting and actuarial reports are based on an annual fiscal year basis. These tedious and complicated reports usually take months to compile. Such reports usually include a thorough analysis of pension liabilities based on current accounting rules (i.e. ASC 715, ASC 960, PPA, GASB) and actuarial practices (i.e. ASOP 27).
Although these annual accounting and actuarial reports are quite thorough they do not provide the calculations, transparency and frequency needed for proper asset/liability management (ALM). What asset manager could manage assets to an index that comes out annually, months delinquent and you are not provided with the index portfolio. It is rare that the liability cash flow schedule of benefit payments is provided in an actuarial report or CAFR.
Solution: Custom Liability Index (CLI)
Given a liability objective, the first step in a solution is a Custom Liability Index that accurately and frequently measures the size, term structure shape and risk/reward behavior of this unique cash flow. A Custom Liability Index is the proper benchmark for liability driven objectives. The CLI creates a true economic ormarket value measurement of liabilities instead of a single discount rate approach (that is not a market rate) used by most clients today. Since Contributions are the first source to fund benefit payments, the Ryan ALM Custom Liability Index creates a gross and net CLI (after Contributions). Assets need to know what they are funding… net liabilities (after Contributions). Unlike actuarial reports that come out annually and even tri-annually (delinquent), the Ryan ALM Custom Liability Indexes are monthly reports. Our CLI will calculate:
YTM
Duration
Future Value
Present Value
Growth Rate %
Term Structure
Interest Rate Sensitivity
Gross and Net Liabilities
Benefit: Asset Allocation (AA)
Plan sponsors can now know their economic funded status monthly on both a gross and net liability basis. Asset allocation should be based on the economic net liability funded status. A surplus should have a much different AA than a deficit. A deep deficit should have a different AA than a small deficit.
Benefit: Proper Benchmark for Assets
Assets need to know what they are funding… net liabilities (after Contributions). Bonds are best as the core portfolio to cash flow match Retired Lives chronologically. Out Liability Beta Portfolio (LBP) is the proper cash flow matching tool and is explained in our future research topic. This buys time for the Alpha assets to grow and perform vs. the CLI.
Benefit: Performance Measurement
Once the Liability Beta Portfolio is installed to cash flow match Retired Lives chronologically, you now need the Alpha assets to outgrow liability growth to enhance the funded status. The CLI will provide the growth rate of net liabilities just like any index benchmark so performance measurement can be easily assessed.
An error is not a mistake until you refuse to correct it. John F. Kennedy