
Ryan ALM
White Papers
Browse
Operation Home Run
Pension Solution: Operation Home Run The true objective of a pension is to secure and fully fund benefits in a cost-efficient manner with prudent risk . This is best accomplished...
Source: Operation Home Run
Pension Solution:Operation Home Run
The true objective of a pension is to secure and fully fund benefits in a cost-efficient manner with prudent risk. This is best accomplished through a cash flow matching (CFM) strategy using investment grade bonds to fully fund and match monthly benefit payments at low cost. CFM has several advantages of which we label four as “Operation Home Run”:
1.Liquidity
Liquidity is a critical and necessary priority of a pension since it must fund monthly benefits + expenses (B + E) on time. Many plan sponsors use a “cash sweep” or a cash allocation strategy to provide such cash flow. Both strategies are not optimal for a pension plan. A cash sweep usually takes income or cash flow from all asset classes to fund the current monthly B+E. This can severely damage the ROA of such asset classes. According to a research report by Guinness Global since 1940, dividends and dividends reinvested have accounted for 47% of the S&P 500 total return on a 10-year rolling period and 57% on a 20-year rolling period. So, this data questions the logic of a cash sweep that uses dividends to fund benefits + expenses (B+E). A cash allocation is usually low yielding + is close to a 1:1 relationship between present value and future value which is high cost. CFM will fully fund monthly B+E in a cost-efficient manner with yields of the average duration of the CFM.
2.Security
Pensions need to secure the benefit payments as a high priority. This is best accomplished through CFM which has the certainty of asset cash flows that fully fund liability cash flows on time with the correct amount. To our knowledge only bonds and annuities have certain cash flows. This is why bonds have been chosen as the appropriate securities to defease liability cash flows for decades.
3.Time
The greatest asset of a pension is time. Most pensions have long average lives. The best way to buy time is with a CFM strategy that will defease liabilities for as long a period of time as the plan sponsor wants. S&P data proves that the longer the time horizon the higher the total return of stocks… and most risky investments. Ryan ALM recommends a CFM strategy to fund at least 1-7 years.
4.Cost
The pension objective is a liability objective and cost objective. Since liabilities are future value costs, only a CFM or annuity strategy could fund liability cash flows with certainty. The Ryan ALM CFM model will reduce funding costs by about 2% per year (20% for 1-10 years of liabilities).
Conclusion
As a best-fit to achieve the true pension objective, Ryan ALM recommends our cash flow matching (CFM) strategy to fully fund B+E in a cost-efficient manner. Our CFM model will provide timely cash flows that will fully fund B+E at the lowest cost to our clients. The benefits of our CFM model are quite substantial:
CFM will provide certainty of cash flows which eliminates liquidity risk.
CFM secures the benefit payments through the certainty of its cash flows.
CFM buys time. The longer the time, the greater the ROA for the growth assets.
CFM is a cost optimization model that reduces funding costs by about 2% per year.
CFM is an investment grade portfolio skewed to the longest maturities within the area it is funding (i.e. 1-5 years or 1-10 years) that should enhance the CFM yield versus the yield on cash reserves and active bond management.
CFM reduces reinvestment risk if interest rates trend downward (as many expect).
As a solution, Ryan ALM recommends separating liquidity assets from growth assets in asset allocation. Let bonds in a CFM strategy be your liquidity assets for the advantages mentioned above. A CFM strategy will have a longer average duration and higher yield than cash thereby reducing the cost to fund B+E. In this way the liquidity assets and the growth assets are a team that will produce the optimal solutions.
Problem/Solution: Generic Indexes
Problem: Find Pension Liabilities in any Generic Bond Index Solution: Custom Liability Index (CLI) Pension liabilities are unique to each plan sponsor… different salaries, benefits, expenses, contributions, mortality, inflation assumptions,...
Source: Problem/Solution: Generic Indexes
Problem: Find Pension Liabilities in any Generic Bond Index
Solution: Custom Liability Index (CLI)
Pension liabilities are unique to each plan sponsor… different salaries, benefits, expenses, contributions, mortality, inflation assumptions, plan amendments, etc. In an effort to capture and calculate the true liability objective, the Ryan team created the first Custom Liability Index (CLI) in 1991 as the proper pension benchmark for asset liability management (ALM). We take the actuarial projections of benefits and administrative expenses (B+E) for each client and then subtract Contributions to calculate the true liability cash flows that assets have to fund since contributions are the initial source to fund B+E. We then calculate the monthly liability cash flows as (B+E) – C. The CLI is a monthly report that includes the calculations of:
Net future values broken out by term structure
Net present values broken out by term structure
Total returns broken out by term structure
Summary statistics (yield, duration, etc.)
Interest rate sensitivity
The Ryan ALM CLI should be installed as the index benchmark for any bond manager as well as total assets. This should be the first step in asset management and asset allocation. The CLI can be broken out into any time segment that bond assets are directed to fund (i.e. 1-3 years, 1-10 years, etc.). Moreover, total assets should be compared versus total liabilities to know if the funded ratio and funded status have improved over time. If all asset managers outperform their generic index benchmarks but lose to liability growth rate (total return)… the pension plan loses and must pay a higher contribution.
Since the CLI is a monthly report, plan sponsors can compare assets versus liabilities monthly. There should never be an investment update of just assets versus assets (generic index benchmarks) which is common. It is hard to understand in today’s sophisticated finance world, that liabilities are missing as an index. The reason must be that it is extra work for each client. But it should be clear that no generic bond index could ever properly represent the liability cash flows that assets are required to fund. It is apples versus oranges.
“Given the wrong index benchmark… you will get the wrong risk/reward”
The Pension Crisis of 2000-02
In my 2013 book “The U.S. Pension Crisis” I detailed the causes of the 2000-02 pension crisis where funded ratios deteriorated significantly from a surplus position in the 1990s. This...
Source: The Pension Crisis of 2000-02
In my 2013 book “The U.S. Pension Crisis” I detailed the causes of the 2000-02 pension crisis where funded ratios deteriorated significantly from a surplus position in the 1990s. This created a spike in contribution costs for many years which I labeled as the U.S. pension crisis… it was actually a contribution cost crisis. Contribution costs for many pensions rose quickly by 5x to 10x or even more in a short period of time. This led many cities and states into a budget shock and some even filed for bankruptcy (i.e. Detroit, Harrisburg, Jefferson County, Stockton).
The major cause of this dilemma, I reasoned, was the asset allocation objective of achieving a ROA (about 8.00% then). This was in sharp contrast and conflict with the true pension objective… to fund benefits (liabilities) in a cost-effective manner with prudent risk.
With funded ratios in a surplus position in the late 1990s. most pension plans could have defeased their liabilities with a bond allocation that used a cash flow matching (CFM) strategy. This CFM strategy would have secured benefit payments and kept contribution costs very low. This used to be called Dedication in the 1970s and 1980s and was a widespread strategy then. CFM gives certainty that the asset cash flows will fully fund the liability cash flows at the lowest cost to the plan sponsor. But because interest rates were well below the ROA of 8.0% in the late 1990s, asset allocation models heavily skewed their weights to equities and other non-bond risky assets to try to earn this 8.0% ROA hurdle rate.
When the equity correction hit in 2000 it was quite severe for pensions. Not only did the equity assets have negative growth but due to a secular decline in interest rates from 1982 this translated into high pension liability growth since they behave like bonds. According to Federal Reserve calculations, the average asset growth for public pensions underperformed the average liability growth by about 73% in the period 2000-02 as follows:
| Assets | Liabilities | Difference | Cumulative | |
|---|---|---|---|---|
| 2000 | -2.50% | 25.96% | -28.46% | -28.46% |
| 2001 | -5.40% | 3.08% | -8.48% | -37.60 |
| 2002 | -11.41% | 19.47% | -30.88% | -73.40% |
2000AssetsLiabilitiesDifferenceCumulative2000-2.50%25.96%-28.46%-28.46%2001-5.40%3.08%- 8.48%-37.602002-11.41%19.47%-30.88%-73.40%
This underperformance caused pension funded ratios to go from a nice surplus to a deep deficit creating the spike in contribution costs. According to the Federal Reserve System data the average funded ratio for state pension funds was 58.9% as of 2002 from a surplus position in 1999.
for their asset allocation models. According to the 2024 Milliman study the average asset allocation for public pensions is skewed to equities at 76% with bonds at 21% down from 24% 10 years ago.
Given the performance of equities in recent years, we may be nearing a correction similar to 2000-02 based on some key criteria:
Reversion to the Mean
This is a common and logical concept. The S&P 500 has a mean return of 9.75% for 20 years and 9.90% for 30 years with dividends. The last 5 years has a mean return of 11.33% and 10 years = 12.39%. This suggests a possible negative growth for the near future to revert to the mean.
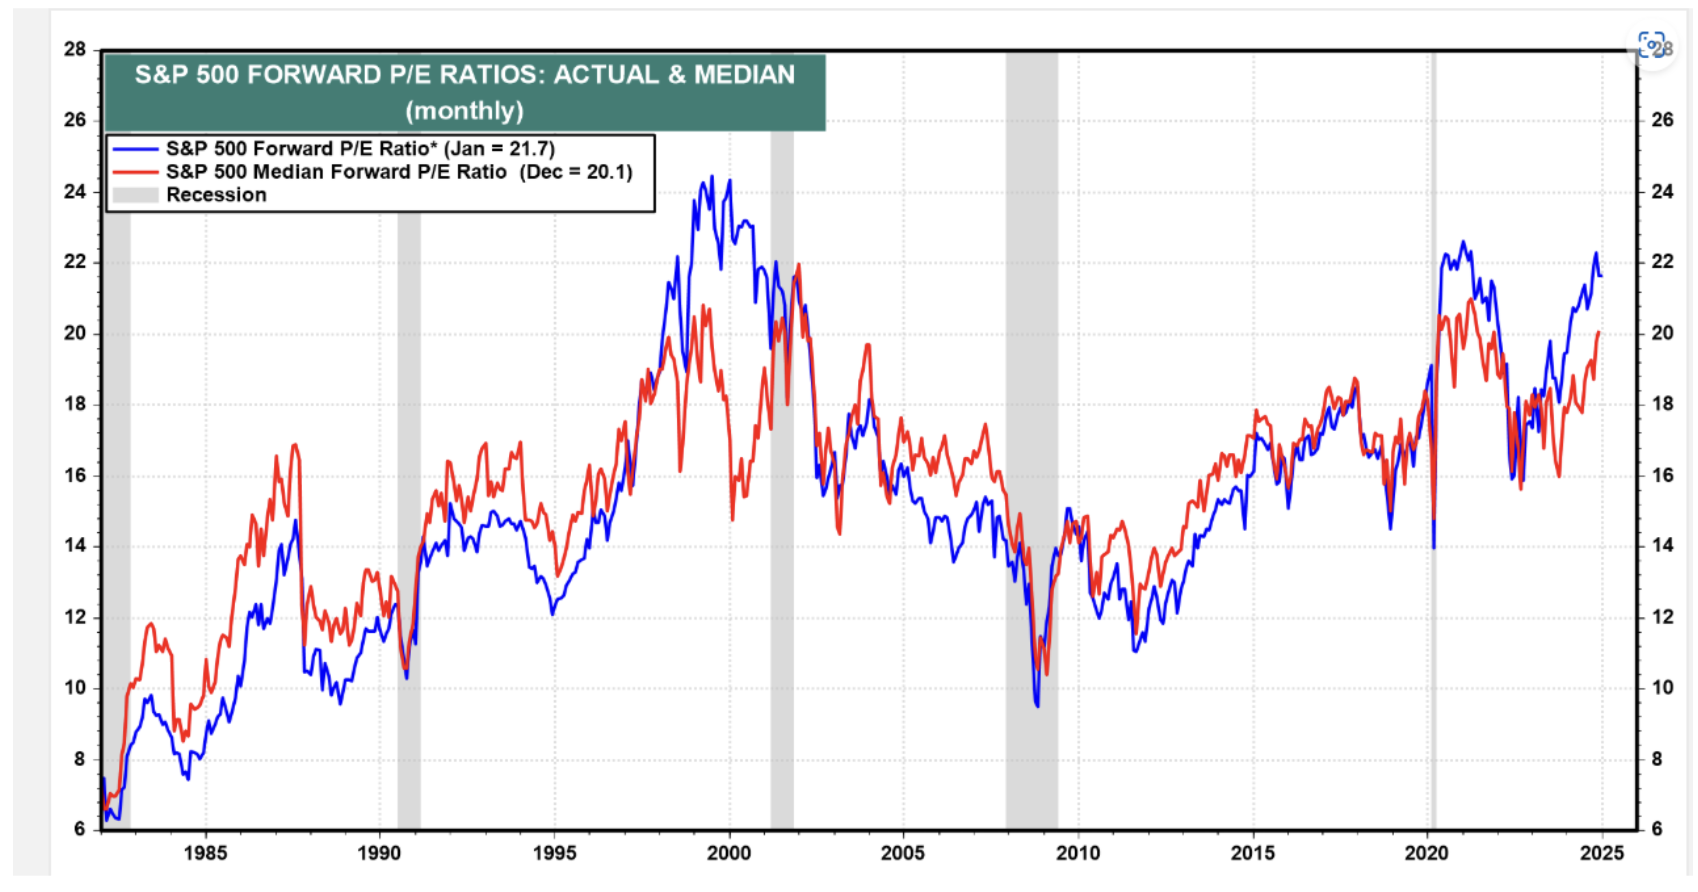
P/E Multiple
Valuation is another key determinant. Based on forward earnings, the current forward P/E for the S&P 500 is around 24.26x today. The graph below by Yardeni shows it at 21.7x on Jan. 23. The point here is that the forward P/E today is above the median P/E of 20.1x and is near a 25 year high which happened in 2000.
Déjà Vu
Pensions need to protect and enhance their funded status. They cannot afford volatility in the funded ratio and contribution costs. Now is the time to address asset allocation by shifting assets to a cash flow matching strategy. We recommend a minimum of defeasing the 1-10 year liability cash flows. This would buy time for the risky assets to grow unencumbered and recover from any correction. It also eliminates the need for a cash sweep that reduces the ROA of stocks significantly.
The Smartest Beta
The term “beta” is credited to William F. Sharpe, Ph.D. in his 1964 work in development of the “Capital Asset Pricing Model (CAPM)”. It means (1) the covariance of the...
Source: The Smartest Beta
The term “beta” is credited to William F. Sharpe, Ph.D. in his 1964 work in development of the “Capital Asset Pricing Model (CAPM)”. It means (1) the covariance of the return on a security or portfolio with that of the market portfolio divided by (2) the variance of the return on the market portfolio. Professor Sharpe originally called this “market sensitivity” since you are comparing an investment to the market as defined by a market index. A beta of 1.0 suggests you have no residual risk in that you match the risk/reward behavior of the market index you are being compared against. Ideally, a market index fund should consistently have a market beta of 1.0.
Beta is a measurement based on a market or objective index. Without the index benchmark there is no applicable beta calculation. Traditionally, this has been the popular index benchmarks (i.e. S&P 500, Lehman Aggregate, etc.) but in truth it can be any index that best represents the objective of such funds (i.e. ETFs, index funds). Back in 1964 there was the absence of market indexes so beta was limited mainly to a measurement versus the S&P 500. The first bond index was introduced by Kuhn Loeb in 1973 (merged into Lehman in 1977). Since the advent of ETFs in 1993 there has been numerous new indexes created to feed the explosive growth of ETFs. Such new indexes are the stated objective of these many new ETFs.
Smart Beta
Smart beta is the optimization of the risk/reward behavior of a market index usually by changing the weights. Popular smart beta weighting schemes have been: fundamental weighting, equal-weighting, risk-clusters, and diversity weighting (combines equal and cap weighting). By changing the weights methodology the goal is to enhance returns or reduce volatility or both. Smart beta products have grown well in a short period of time but for the most part are still equity index derivatives. Rob Arnott and Research Affiliates, LLC have been a leader here introducing fundamental weighting for both bond and stock indexes as risk/reward value-added.
There is debate as to whether changing the weight methodology of a market index is really active management or an alpha strategy rather than a beta strategy or discipline. My recommendation is that the objective decides what is beta and alpha. What is important is to have the objective defined by a rules based index. If this reweighted index is the stated objective of an ETF, mutual fund or client then beta is the portfolio that matches the risk/reward of this objective index version. It also follows that alpha is the excess return versus this modified index objective. All comparisons to the traditional generic market index are just good information to know but do not determine the alpha and beta calculations.
Liability Beta Portfolio (The Smartest Beta)
The “smartest beta” portfolio is the portfolio that best matches and achieves the true client objective with the least amount of risk and cost. Risk is best measured as the uncertainty of achieving the objective. Cost is the amount required to fund the objective. The true objective of most institutions and even individuals is some type of liability (annuities, banks, insurance, lotteries, NDT, OPEB, pensions, etc.). The absolute level of volatility of returns is not risk given a liability objective. Indeed a 10-year liability payment is best matched and funded (defeased) by a 10-year Treasury STRIPS which has a certain future value. A three month T-bill would be very risky given this liability objective as it has 39 reinvestment moments of uncertainty. Although the 10-year Treasury STRIPS would be much more volatile in returns, such a return pattern would match the present value behavior of the 10-year liability and thus be low risk or even risk-free (defeasance).
Given a liability objective it is critical to create a custom liability index (CLI) as the proper benchmark. It must be a custom index since liabilities are like snowflakes… you will never find two alike. The CLI is a portfolio of liability payments weighted by the schedule of payments (term structure). Most institutional liabilities are calculated by actuaries who produce an actuarial projection of the liability payment schedule for each client. As such, the CLI is weighted by the actuarial projection in present value dollars. To calculate the present value of each liability payment you need to price liabilities based on a yield curve of discount rates. Depending on the type of liability there are accounting rules (ASC, FASB, GASB, IASB, PPA, etc.) that dictate the discount rate methodology.
Most, if not all, liabilities are priced as zero-coupon bonds since they produce a certain future value. Using U.S. corporate pensions, as an example, they are regulated by ASC 715 (formerly FAS 158) for GAAP accounting purposes. These rules suggest pricing liabilities as if they were AA corporate zero-coupon bonds. Since such bonds are not available in the bond market, they have to be manufactured as hypothetical zero-coupon bonds. As a result, liabilities behave like a yield curve of zero-coupon bonds weighted by the actuarial projections. This means that pension liabilities are extremely interest rate sensitive.
The CLI should calculate all of the necessary statistics to maintain and monitor a liability beta portfolio: term structure weights, total present value, YTM, duration, growth rate, interest rate sensitivity. The CLI is also the proper benchmark to measure liability alpha. If equity assets outperform the S&P 500 but underperform the CLI growth rate… did you earn alpha? In the eyes of the client you lost to liability growth which will damage the funded ratio (assets/liabilities), credit rating and increase contribution cost. Liability alpha is the excess return versus the CLI return (growth rate) and not versus a market index return. Based on Ryan ALM indexes, liability YTD returns through November 30 should be between 12.7% (10-year duration) and 22.2% (15-year duration). Hard to believe that any pension has earned liability alpha so far in 2014.
The key point here is that the client objective is truly the focus and determinant of relative risk and reward (beta and alpha). The client objective is to fund liabilities in such a way that risk and cost are reduced and stable over a long horizon. Given a long average life (duration) based on the liability payment schedule then the liability beta portfolio needs to match these term structure weights. An S&P 500 index fund or any generic market index fund could never represent the beta portfolio for a liability driven objective. Cash or a money market fund is a very risky investment for most liability objectives that have long average lives (duration).
The most appropriate and smartest beta portfolio is the one that matches the liabilities cash flow as measured by the CLI. In essence, the smartest beta portfolio is a custom liability index fund. Such a portfolio should be the core portfolio for any liability objective. By matching the liability term structure the uncertainty risk of matching liabilities is eliminated and interest rate sensitivity is neutralized. By matching the liability term structure with bonds that have higher yields and lower present values (price) than the discount rates used… you have reduced costs. Since the accounting rules (ASC 715, IASB, and PPA) use AA zero-coupon discount rates then a liability beta portfolio of A and BBB will produce higher yields and lower costs. This should provide significant cost savings of 10% to 15%. This matching process is called cash flow matching. Beware of duration matching strategies (i.e. immunization) which do not match the liability cash flows but just the average duration. This is not an accurate or cost effective way to match liabilities. The smartest beta portfolio is a liability cash flow matched portfolio!
Ryan ALM, Inc. Celebrates 20th Anniversary
Ryan ALM, Inc. Celebrates 20 th Anniversary Mission: Protecting and Preserving Pensions Ryan ALM, Inc. was incorporated in Delaware on June 15, 2004. Ronald J, Ryan, founder, says that “we...
Source: Ryan ALM, Inc. Celebrates 20th Anniversary
Ryan ALM, Inc. Celebrates 20th Anniversary Mission: Protecting and Preserving Pensions
Ryan ALM, Inc. was incorporated in Delaware on June 15, 2004. Ronald J, Ryan, founder, says that “we created our company to be dedicated to asset liability management (ALM) as our name suggests. We are quite proud of our progress and achievements in ALM. We have built a turnkey system of products that are quite unique in the ALM industry that we treat as assets shown on our balance sheet, to include:
Custom Liability Index (CLI) – assets need to know what they are funding. Usually, it is monthly net liabilities (benefits + expenses – contributions). Such net liabilities are based on actuarial projections even though actuaries do not calculate net liabilities. The CLI is the proper benchmark for all LDI and ALM objectives. The CLI performs numerous calculations including present values, duration, growth rates, interest rate sensitivity, YTM, etc.
ASC 715 Discount Rates – Ryan ALM is one of few vendors providing ASC 715 discount rates in conformity to FASB. We produce four unique yield curves of AA zero-coupon corporate bonds. Usually, our discount rates are higher than our competitors providing for lower liability valuations and enhanced balance sheets.
Liability Beta Portfolio™ (LBP) – our asset management division, Ryan ALM Advisers, LLC, is entirely focused on cash flow matching as our only ALM product we call LBP. We feel strongly that our LBP provides the most benefits in harmony with the true pension objective of funding liabilities in a cost-efficient manner with prudent risk. Our LBP matches and funds monthly liability cash flows with certainty while reducing funding costs by 2% per year (20% on 1-10 year liabilities). Our LBP will outyield the CLI and enhance the ROA for bonds.
Performance Attribution Report (PAR) – given our CLI, we can calculate the relative risk/reward behavior of assets (as measured by our LBP) versus liabilities (as measured by the CLI). PAR calculates 14 risk/reward measurements including two graphs to clearly show the value added (or lost) of assets versus liabilities. This should be critical information for consultants and plan sponsors to understand how well the plan is being funded.
Asset Exhaustion Test (AET) – assets need to know the hurdle rate or ROA needed to fully fund net liabilities. The current ROA most pensions use is not an accurate calculation of a hurdle rate. Our AET clearly shows the annual difference of asset cash flows versus liability cash flows. We calculate a matrix of ROAs to arrive at the most applicable target ROA. Usually our calculated ROA (AET) is much different and lower than the current ROA since we focus on net liabilities not gross liabilities which reduces the liability cash flows assets need to fund (perhaps significantly).
We are very proud of our synergistic system and thankful for our team of experts with over 168 years of experience. Ryan ALM remains dedicated to achieving the true pension objective of funding liabilities with low cost and low risk.”
Liability Beta vs. Market Beta
Beta is a term first pioneered by PhD. William Sharpe in his 1970 book “Portfolio Theory and Capital Markets”. Here he introduced his famous capital asset pricing model (CAPM) which...
Source: Liability Beta vs. Market Beta
Beta is a term first pioneered by PhD. William Sharpe in his 1970 book “Portfolio Theory and Capital Markets”. Here he introduced his famous capital asset pricing model (CAPM) which presented the idea that individual investments contain two types of risk: Systematic and Unsystematic risk.
Systematic risk was deemed to be market risk that cannot be diversified away while unsystematic risk was deemed to be the specific risk of that investment (i.e. credit, features, etc.) that can be diversified away through adding other investments to the portfolio. Modern portfolio theory (MPT) shows that unsystematic risks can be removed or reduced through portfolio diversification. The problem that remains is that of market risk.
The Notre Dame fixed income indexes study of 1986 proved that the market risk for bonds is interest rate risk which is quite dominate. Their calculations showed that interest rate risk explained or accounted for 96% plus of the total return for the major bond index aggregates. This study further proved that interest rate is best measured by a yield curve that is well diversified by maturity or duration (term structure). Any bond index that does not have a distinct term structure is not a good measurement of bond market risk.
Through time, it became obvious how difficult it was for active management to consistently outperform a market index as a benchmark (especially after fees). This led to Index Funds as a major asset management style. The growth in this form of asset management has been dramatic especially when including the explosive growth of exchange traded funds (ETFs).
With the advent of Portable Alpha as a strategy, assets are divided into two groups: Alpha and Beta. A Portable Alpha strategy transfers (ports) the excess return (Alpha) over to the Beta portfolio to secure the victory. The Beta portfolio is considered the portfolio that matches the objective as an index benchmark (i.e. Index Fund) and Alpha is considered the portfolio that outgrows (excess return) the index objective.
Given the currentasset liability management(ALM)or liability driven investment (LDI) trends, it has become obvious that the true objective of a pension is to fund a liability schedule unique to each plan sponsor. Since the objective of a pension (and most institutional objectives) is liability driven shouldn’t the terms Beta and Alpha be redefined for any LDI objective. After communication with PhD. William Sharpe years ago, he suggested I qualify my research as Liability Beta and Liability Alpha to distinguish it from market beta and market alpha. I agree, that makes good sense.
Market Beta and Alpha
Most asset managers are given an index bogey or objective that best represents the asset class risk/reward behavior that the client has chosen as the objective of such asset allocation. Asset consultants are quite diligent in selecting and monitoring the asset managers to perform under these index objectives. The goal could be to either match the risk/reward behavior (Beta portfolio or index fund) or outperform the return behavior (earn Alpha). A few good questions here are: if your asset managers earn market Alpha, does that mean they earned liability Alpha? If all asset managers outperformed their index bogey but total assets underperformed liability growth, did the client win or lose? Did asset allocation create value added (Alpha)?
Liability Beta and Alpha
Several strategies exist to match pension liabilities (cash flow matching, duration matching, derivatives, interest rate swaps, etc.). These liability Beta portfolios are to match the liability cash flow schedule (cash flow matching) or interest rate sensitivity of liabilities (duration matching) or both. Liability Alpha is rarely a consideration yet this is how a pension improves its funding status and reduces pension costs (i.e. contributions). In the end, total assets must outgrow total liabilities over time to earn liability Alpha thereby enhancing the funded status and reduce pension costs.
Custom Liability Index
Given any liability driven objective, the proper index benchmark should be a Custom Liability Index (CLI) that best measures the size, shape and risk/reward behavior of these client specific benefit payment schedules. The Ryan ALM CLI is a monthly report that calculates the present value, growth rate and interest rate sensitivity of liabilities. Client liabilities are like snowflakes… you will never find two alike. Only a CLI could accurately represent the true pension objective. It should be obvious thatthe true objective of a pension is to fund their liabilities in a cost-efficient manner with prudent risk. It is difficult, if not impossible, for asset liability management (ALM) to function effectively without proper knowledge of the liability cash flows. In sports, the scoreboard dictates the strategy. The CLI is the pension scoreboard for liabilities. When compared to assets, the plan sponsor knows every month if they are winning or losing the pension game.
Current accounting rules and actuarial practices price liabilities as a zero-coupon bond portfolio at a single discount rate on an annual basis, months delinquent where the liability cash flow schedule (annual projections of benefits) is rarely seen. Moreover, this single discount rate may not be a market rate (GASB for public plans uses the ROA). Could any asset manager perform versus a generic market index if it came out annually, months delinquent where the index portfolio was not transparent and all issues were priced at the same yield? Sounds ridiculous … well, welcome to the current pension liability world we live in.
The Society of Actuaries (SoA) in their 2004 research paper addressed this situation citing that current accounting rules distort economic reality and urged pensions to create a set of economic books that price liabilities at the market on a frequent and accurate basis. Such economic books are best created and maintained as a Custom Liability Index. Indeed, until a Custom Liability Index is installed, the asset side cannot function effectively towards a liability objective. How could an asset allocation model function without correct input as to the true economic Funded Ratio (assets/liabilities) and the size of the economic deficit or surplus (funded status)? How could performance measurement be calculated quarterly without knowledge of the true economic liability growth rate (total return)? How could you match and fund assets to liabilities without a Custom Liability Index?
I designed the CLI over 32 years ago as the best representation and benchmark for any liability objective. The CLI is a monthly report that prices liabilities at the market (using either the Ryan ALM ASC 715 (AA corporates) discount rates or US Treasury STRIPS). The CLI calculates the true economic present value of liabilities and their growth rate so the funded status and performance measurement of assets versus liabilities can both be ascertained.
Lehman Aggregate and Generic Bond Indexes
As the designer of many of the popular Lehman bond indexes (now Bloomberg Barclay’s), I am honored by the acceptance of these bond indexes. However, it should be obvious that they do not behave like liabilities. All of the popular generic bond indexes are rules based. Such rules only use coupon bonds and do not have zero-coupon bonds. Mathematically, the longest duration of any coupon bond is around 17 years today. As a result, such bond indexes could not be a proxy for long duration liabilities or match these liabilities as an index fund. Furthermore, most pensions are weighted to long durations with an average pension fund in the 10 to 15-year average duration area. The Bloomberg Barclay’s Aggregate’s average duration is usually between four to five years … a definite mismatch to pension liabilities cash flow. Even the long Corporate or Credit index cannot match liabilities. It has two distinct rules based problems. First, it has no issues shorter than 10 years in maturity which leaves out a large and most important segment of liability cash flows. Second, it has no issues with durations longer than 17 years. This is an inappropriate proxy for any pension’s liabilities. It is not the average duration you are trying to match and monitor but the entire liability term structure (liability cash flows). Once again only a Custom Liability Index is the proper fit as a liability benchmark.
Liability Beta Portfolio™ (LBP)
If the Beta portfolio is the portfolio that matches the index objective (Index Fund) then given a liability objective, the proper liability Beta portfolio is … the portfolio that matches the liability objective (Liability Index Fund). To be accurate, you must fund each monthly liability payment.
The Ryan ALM LBP is a cash flow matching portfolio that matches and funds monthly liability cash flows chronologically. Our LBP is a cost optimization model that will produce the optimal lowest cost portfolio to fund the target liability cash flows. Our LBP should reduce funding costs by about 2% per year (1-10 year liability schedule = 20% funding cost savings)! Moreover, the LBP will outyield the CLI thereby providing liability Alpha similar to the yield difference which enhances the funded status. The Ryan ALM LBP should also mitigate interest rate risk (similar duration and term structure matching) and reduce pension expense, the volatility of the funded status and contributions.
The intrinsic value in bonds is the certainty of their cash flows. We urge pensions to use bonds for their value… to match bond cash flows that fund liability cash flows. We do not view bonds as performance vehicles or Alpha assets. They are best as liquidity assets to fund liabilities as they come due. By bifurcating liquidity assets from growth assets (Beta vs. Alpha assets) you BUY TIME for the Alpha assets to grow unencumbered. Many pensions use a “Cash Sweep” where they take away income from all asset classes to fund benefits + expenses (B+E). According to S&P 500 data, dividends reinvested accounted for: 47% of rolling 10 years returns since 1940. So let the bond allocation (liquidity assets) fund B+E which will buy time for the Alpha assets to grow significantly more.
“An error is not a mistake until you refuse to correct it” John F. Kennedy
Cash Flow Matching Overview
Cash Flow Matching Pension Objective Fund benefits in a cost-efficient manner with prudent risk Pension Needs Liquidity to fund benefits Reduce Contribution costs Reduce Volatility of Funded Status Strategy Value...
Source: Cash Flow Matching Overview
| Pension Objective | Fund benefits in a cost-efficient manner with prudent risk | ||||||||||||||||
| Pension Needs |
Liquidity to fund benefits Reduce Contribution costs Reduce Volatility of Funded Status |
||||||||||||||||
| Strategy | Cash flow match liability cash flows (benefits + expenses) | ||||||||||||||||
| Value in Bonds |
Certainty of cash flows (only asset class with such value) Maturity selection = yield curve (term structure) Cash flows every month as portfolio |
||||||||||||||||
| Methodology |
Ryan ALM creates a Custom Liability Index (CLI)
Ryan ALM creates Liability Beta Portfolio (LBP)
|
||||||||||||||||
| LBP Benefits |
Fully funds B+E and secures benefits with certainty
Reduces funding costs by 2% per year (1-10 years = 20%)Eliminates cash sweep of growth assets (Alpha assets) Buys time for Alpha assets to grow unencumbered Reduces volatility of funded ratio/status Outyields liabilities creating alpha Enhances funded status and ROA Reduces Contribution costs Mitigates interest rate risk Hedges pension inflation Low fee |
||||||||||||||||
| Note: |
LBP does not change any accounting, actuarial and asset allocation (AA) actions. LBP is a less risky & less costly alternative to active bond management. LBP is a best fit to the true pension objective. |
||||||||||||||||
| Interest Rate Risk (IRR) |
Biggest and dominant risk on bonds present values (PV) Benefits + expenses = future values (FV) B+E are not interest rate sensitive LBP funds Benefits + Expenses LBP mitigates IRR |
||||||||||||||||
| Pension Inflation |
Actuarial projections unique to each pension plan Inflation assumptions =/= CPI |
||||||||||||||||
| Generic Bond Indexes |
Not a proper benchmark Do not represent pension liabilities Liabilities are like snowflakes, unique to each plan sponsor Only a Custom Liability Index could measure/monitor liabilities |
||||||||||||||||
| Value Added |
Ryan ALM offers clients a series of synergistic values:
|
||||||||||||||||
| Awards |
Gold Medal Winner – The U.S. Pension Crisis book of the year Bernstein, Fabozzi, Jacob Levy – Research Paper of the year William F. Sharpe Index Lifetime Achievement Money Management Letter Lifetime Achievement Capital Link – Most Innovative ETF IMN - ETF of the year |
Duration vs. Cash Flow Matching
Pension Solutions: Dollar Duration Matching and Cash Flow Matching Ryan ALM believes that the objective for a defined benefit pension is to fund and secure benefits in a cost-effective manner...
Source: Duration vs. Cash Flow Matching
Pension Solutions:
Dollar Duration Matching and Cash Flow Matching
Ryan ALM believes that the objective for a defined benefit pension is to fund and secure benefits in a cost-effective manner. Pension management is an assets vs. liabilities objective rather than assets versus generic market indexes objective. Pension asset/liability management (ALM) starts with understanding the pricing and interest rate sensitivity of liabilities and continues with measuring and monitoring such liabilities. There are two primary asset/liability bond strategies in use today: Duration Matching and Cash Flow Matching.
Duration Matching
The purpose of duration matching is an attempt to match the interest rate risk sensitivity of assets to liabilities. The objective is to have the market value or PV changes (growth rate) in the bond portfolio match the market value or PV changes (growth rate) in liabilities for a given change in interest rates. Many fixed income managers attempt to match the average duration of the bond portfolio to the average duration of a bond market index with a similar duration to liabilities (i.e., Bloomberg Barclays long Corporate index). They use the generic bond index as a proxy for liabilities. There are several problems with this strategy.
The fatal flaws in this approach are:
a generic bond index cannot replicate any client’s unique liability cash flows. Client’s liabilities are like snowflakes: different labor force, salaries, mortalities and plan amendments.
average durations give erroneous information because there are an infinite number of combinations of maturities for a bond portfolio that can all have the same average duration, but they will not have the same risk/reward profile.
duration matching is only accurate for small parallel shifts in the yield curve. But the yield curve rarely moves an equal number of basis points at every point along the curve. For more info, Ron Ryan wrote a research paper “The Seven Flaws of Duration” while head of Ryan Labs… see the Ryan ALM website/insights/white papers/classics.
Bond management evolved to remedy these flaws by using Key Rate Durations which attempts to match the duration of multiple points along the yield curve. Key Rate Duration is an improvement over using a single average duration, but it still has several deficiencies:
Actuaries usually do not provide the average duration of liabilities and the projected benefits in their annual actuarial report… reason why generic bond indexes are used.
Matching key rate durations of a generic market index = wrong Key Rate Durations.
Duration is a present value calculation requiring pricing each projected benefit with a discount rate yield curve (i.e., ASC 715 discount rates). As a result, 30 annual benefit payments require 30 separate discount rates.
Duration must be modified (duration/1+YTM) to use as a price return measurement.
Modified duration is a price return measurement and does not include income.
Dollar Duration Matching (DDM)
DDM matches the Dollar Value change per basis point change in yield for assets with the Dollar Value change per basis point change in yield for liabilities. When the Dollar Duration of assets is matched to the Dollar Duration of liabilities for every year in the term structure of liabilities, then DDM is the most precise form of Key Rate duration matching because it matches the Key Rate durations at every point along the liabilities yield cure or benefit payment schedule (30 years = 30 key rate durations). The Ryan ALM approach offers several value-added differences:
Actuarial Projections - We use the actuarial projected benefits of our clients and not a generic bond index.
Modified durations - to be an effective price sensitivity measurement, duration must be modified. Modified Duration measures the percent change in market value or
Dollar duration - our objective here is to match the dollar value change per basis point in assets and liabilities in every maturity on the projected benefit schedule.
The Ryan ALM DDM approach greatly improves the accuracy of Key Rate duration matching by matching the Dollar Value changes in liabilities with the Dollar Value changes in assets across the term structure and yield curve for both assets and liabilities. The liabilities are represented by using a Custom Liability Index to more precisely measure and monitor the dollar value movement in assets versus liabilities given any movement in interest rates.
Cash Flow Matching (CFM)
Ryan ALM believes that the objective for a defined benefit pension is to fund and secure benefits when due in a cost-efficient manner. Ryan ALM does not believe that bonds are performance assets. The value in bonds is in their known and scheduled cash flows which is why cash flow matching has been used as a major strategy for hedging liabilities for many decades (i.e., dedication, defeasance). It is the matching and funding of benefits (future values) that is of primary concern. As such, future values are not interest rate sensitive… a major benefit of cash flow matching. Cash flow driven investing (CDI) dominates the way European pensions are managed under IASB accounting standards. Key Rate Duration using Dollar Duration is great for matching market value (PV) movements between assets and liabilities but what about funding liability payments (future values)?
Since the primary value in bonds is in the certainty of their cash flows, Ryan ALM will cash flow match (fund) projected benefit payments chronologically which provide the plan sponsor with numerous benefits:
Secures the benefits,
Significantly de-risks the plan,
Reduces funding costs significantly,
Reduces volatility of funded ratio and contributions,
Buys time for performance assets (Alpha) to grow unencumbered,
Hedges pension inflation on Retired Lives, Active Lives and Expenses, and
No interest rate risk since LBP is funding future values (benefit payments).
A major cash flow matching benefit is that it buys time for the performance assets to grow unencumbered. History tells us that given time risky assets perform better (i.e., S&P 500). History also tells us if the Alpha assets can grow without any dilution, they perform much better (dividends reinvested > 50% of the S&P 500 growth in the last 50 years). If interest rates rise, cash flow matching can reinvest any excess cash flows at the then higher yields (lower costs) while bonds managed with a purely total return focus would get hurt with lower price returns.
Solutions
Ryan ALM uses a turnkey system approach to asset/liability management for defined benefit pensions:
ASC 715 Discount Rates – Ryan ALM is one of few vendors providing ASC 715 discount rates (AA corporate zero-coupon bonds). We will price each annual projected benefit payment on a monthly basis.
Custom Liability Index (CLI) - Ryan ALM creates a Custom Liability Index (CLI) for each client based on their actuarial projected benefits. We do not use generic market indexes because that would be assets vs. assets. We measure and monitor the performance of assets versus liabilities. The CLI provides all of the calculations needed for either duration matching or cash flow matching. The CLI will calculate YTM, duration, growth rate and interest rate sensitivity for each annual projected benefit as a term structure as well as total liabilities.
Liability Beta Portfolio™ (LBP) – our LBP will cash flow match projected benefits either chronologically or as a dollar duration match using our proprietary LBP cost optimization model that will reduce funding costs significantly.
Whether it is dollar duration matching or cash flow matching, Ryan ALM provides both products as part of our asset/liability management product line. Please contact us to learn how our turnkey system can enhance your pension fund.