
Ryan ALM
White Papers
Browse
Pension Doctor: Specialist or Generalist?
Pension Doctor: Generalist or Specialist When a person gets sick or has an injurythey go see a doctor. Usually, they prefer to see a Specialist who is the recognized expert...
Source: Pension Doctor: Specialist or Generalist?
When a person gets sick or has an injurythey go see a doctor. Usually, they prefer to see a Specialist who is the recognized expert on the ailment they have rather than a Generalist who has less expertise related to this particular medical condition. Well, the same should be true for pensions. If a pension plan needs a certain strategy to help enhance (cure) the funded status, they call in a specialist for that strategy.
Given that the true objective of a pension is to fully fund benefits and expenses (liabilities) in a cost-efficient manner with prudent risk plan sponsors and their advisors should be dialing up a risk mitigation specialist, such as Ryan ALM. For more than 50 years, our cash flow matching (CFM) strategy is the best fit and proven strategy for the pension objective. CFM provides an accurate and timely match of monthly asset cash flows to fully fund monthly liability cash flows. The CFM is a portfolio of investment grade bonds. The intrinsic value in bonds is the certainty of their cash flows (only asset class with such certainty).
Bond math teaches us that the longer the maturity and the higher the yield… the lower the cost. The Ryan ALM cash flow matching product is a cost optimization model that fully funds monthly liability cash flows at a cost savings of about 2% per year in this interest rate environment. We call our CFM model the Liability Beta Portfolio (LBP). The LBP should be the core portfolio of any DB pension and replace active fixed income management, which is highly susceptible to changes in rates. By matching and funding liabilities chronologically, the LBP buys time for the Alpha or performance assets (non-bonds) to grow unencumbered. By working in harmony with the Alpha assets the plan can gradually enhance its funded status and stabilize contribution costs. There are numerous benefits to a CFM strategy:
No need for cash sweep as LBP provides the liquidity to fully fund liabilities
Secures benefits for time horizon LBP is funding (1-10 years)
Buys time for performance assets to grow unencumbered
Outyields active bond management… enhances ROA
Reduces Volatility of Funded Ratio/Status
Reduces Volatility of Contribution costs
Low Investment Advisory Cost = 15 bps
Reduces Funding costs (2% per year)
Mitigates Interest Rate Risk
We urge pensions to use CFM as the core portfolio strategy to achieve their true objective. To our knowledge Ryan ALM is the only firm that specializes in CFM… our only product.
Pension Conundrum: Same or Similar ROA
The Funded Ratio (FR) of a pension is usually based on the actuarial value of assets / actuarial value of liabilities. The Funded Status (FS) is the actuarial value of...
Source: Pension Conundrum: Same or Similar ROA
The Funded Ratio (FR) of a pension is usually based on the actuarial value of assets / actuarial value of liabilities. The Funded Status (FS) is the actuarial value of assets – actuarial value of liabilities. Actuarial values are different than market values… sometimes quite different. Notably, the FR and FS are present value calculations. But pension liability cash flows (benefits + expenses (B+E)) are future value (FV) projections. The disconnect between PVs and FVs haunts pensions. We have written several research papers about this glaring issue.
The return on assets (ROA) assumption is not based on the funded ratio or funded status. Instead, it is based on the expected return from the pension plan’s asset allocation. The same or similar asset allocation will produce the same or similar ROA focus. This brings up the question from my title – how could 60% and 90% pension funded plans have the same ROA? Shouldn’t the 60% funded plan require assets to work harder? Yes, but that does not have anything to do with the ROA calculation. Whatever shortfall there is in asset cash flows to fund liability cash flows (B+E) must be paid through higher contributions. As a result, the ROA is not a calculated return that will guarantee a fully funded status if achieved long-term… nor will it guarantee that contributions will go down.
Ryan ALM Solutions:
Custom Liability Index (CLI): The first step in prudent pension management is to calculate the liability cash flows that assets must fund. This should be a net liability cash flow (benefits + expenses – contributions). Until liabilities are monitored and priced as a Custom Liability Index (CLI) the asset side is in jeopardy of managing to the wrong objectives (i.e. ROA and generic market indexes). Only a CLI best represents the unique liability cash flows of a pension plan. Just like snowflakes, no two pension liability schedules are alike due to different labor forces, salaries, mortality and plan amendments. How could a static ROA or genericmarket indexes ever properly represent the risk/reward behavior of such a diverse array of pension liabilities? Once the CLI is installed, the pension fund will now know the true economic Funded Ratio and Funded Status, which should dictate the appropriate Asset Allocation, Asset Management, and Performance Measurement.
Asset Exhaustion Test (AET): GASB requires a test of solvency (asset exhaustion test) to document that the asset cash flows (at the ROA) will fully fund the net liability cash flows (benefits + expenses – contributions). GASB correctly understands that assets are funding net liabilities after contributions… and that contributions are future assets. This net liability is rarely shown or focused on by the asset side in asset allocation. Ryan ALM enhances the asset exhaustion test by calculating the ROA that will fully fund net liability cash flows. Usually, we find that a lower ROA can accomplish this goal than the current ROA target. This would support a more conservative asset allocation and a heavier allocation to fixed income to defease liability cash flows chronologically. This is a common and serious issue. This calculated ROA should drive asset allocation decisions. We urge all pensions to incorporate the AET before acting on asset allocation.
Liability Beta Portfolio™ (LBP):The intrinsic value in bonds is the certainty of its cash flows. That is why bonds have been used for decades to defease liability cash flows. The core or Beta portfolio for a pension should be in investment grade bonds that cash flow match and fully fund liabilities chronologically thereby buying time for the growth assets to outgrow liabilities and erase the deficit. The proper Beta portfolio for any liability objective should be… a Liability Beta Portfolio™. Ryan ALM has developed an LBP which will cash flow match liabilities chronologically and reduce funding costs by about 2% per year (1-10 years = 20%), as well as reduce the volatility of the Funded Status and contribution costs. The LBP should be the core portfolio of any pension fund and replace active fixed income management, which is subject to great interest rate risk. By matching and funding liabilities chronologically, the LBP buys time for the growth or Alpha assets (non-bonds) to perform. By working in harmony with the Alpha assets the plan can gradually enhance its funded status and reduce contribution costs.
Liability Alpha Assets: The non-bond assets are managed vs. the CLI to exceed liability growth (earn liability Alpha) and enhance the economic Funded Status. The goal here is outgrow liabilities in $s (relative returns) by enough to erase the deficit over a time horizon equal to the average life (duration) of liabilities (calculated by the CLI). As the Alpha assets achieve the required annual Alpha, any excess returns versus liability growth should be ported over to the Liability Beta Portfolio™ to secure the victory. Had this been in place during the decade of the 1990s when pensions had surpluses… there would be no pension deficits today.
Bond Yields… Caveat Emptor
Most bonds are priced and traded on some yield calculation. These yield calculations are based on assumptions that are difficult, if not impossible, to achieve. For example: Yield to Maturity...
Source: Bond Yields… Caveat Emptor
Most bonds are priced and traded on some yield calculation. These yield calculations are based on assumptions that are difficult, if not impossible, to achieve. For example:
Yield to Maturity (YTM) assumes you will reinvest every six months at the purchase YTM until maturity of the bond. How could this happen? Yields are changing every day, and will you reinvest exactly every six months into the same maturity and same YTM? Sounds like Mission Impossible! In fact, the reinvestment rate on any bond is based on the total return of what you reinvested into. Yes, it is possible to have a negative reinvestment rate if you reinvested into a security with a negative total return. Moreover, the longer the bond maturity… the more the reinvestment rate of return determines the yield or return to maturity. In truth, the basic value of the YTM is to determine a price for the security.
All other yields (yield to call, yield to average life, yield to worst, etc.) are based on assumptions that are most difficult to occur, if not impossible. The intrinsic value of most bonds is the certainty of their cash flows. This is what the smart investor should focus on and utilize. Remove the uncertainty that is embedded in all bond yield calculations. Bonds are the only asset class with this certainty of their cash flows. That is why bonds have been the logical choice for Dedication and Defeasance using Cash Flow Matching (CFM) strategies since the 1970s. Only CFM is a best fit for any liability driven objective (Endowments & Foundations, Lotteries, Pensions, OPEB, etc.). The primary objective of a pension is to secure benefitsin a cost-efficient manner with prudent risk. CFM will secure and fully fund benefits by asset cash flows matching and fully funding monthly liability cash flows chronologically for as far out as the plan sponsor deems necessary.
We believe that a best practice is to separate liquidity assets (liability Beta assets) from growth assets (liability Alpha assets). The Beta assets should be the bond allocation to cash flow match the net liability cash flows (after contributions) chronologically for a target horizon (we recommend 10 years). This will provide the time for risky assets (Alpha) to grow unencumbered since you have the certainty of the Beta assets cash flows for as long a period as you want. It would also be wise to take the Cash and Fixed Income allocation and apply it to a CFM allocation. Several pension plans do a cash sweep of all assets’ income to fund the monthly benefits and expenses. A study of S&P 500 data by Guinness Global has determined that dividends and dividends reinvested account for about 47% of the S&P 500 total return on rolling 10-year periods and 57% for 20-year time horizons. So why would you want to dilute equity returns by spending the dividend income? Let the cash + bond allocation fund the current monthly liability cash flows through our CFM model (Liability Beta Portfolio™ or LBP). Our LBP would match and secure benefits chronologically for as far out as the allocation of funds allows. Since we are dealing with net liabilities (after contributions) a 15% LBP allocation may fund liabilities out to 10-years. The Ryan ALM cash flow matching model is well tested showing a funding cost savings of about 2% per year or more for longer maturity programs (20% for 1-10 years) depending on the liability term structure.
The Ryan ALM LBP model is funding benefits (future values) which are not interest rate sensitive. This eliminates the largest risk in bonds. Our LBP model will usually outyield active bond managers by over 50 bps, which will also reduce costs.
Observations and Benefits of LBP:
No change in Cash and Bond allocation
No dilution of Alpha assets to fund B + E
Reduces funding costs by about 2% per year
Mitigates interest rate risk (funding future values)
Secures + fully funds monthly B+E chronologically
Eliminates the need for a cash sweep which dilutes equity returns
LBP will out yield current bond managers and enhance the ROA
Cash flow matching buys time for Alpha assets to grow unencumbered
Logic
Let the performance assets (Alpha assets) perform by growing unencumbered as the liquidity assets (Beta assets) provide cash flow sufficient to fully fund benefits plus expenses chronologically.
How To De-risk a Pension
Risk is best defined as the “uncertainty” of meeting the client objective. The pension objective is to fund liabilities in a cost-effective manner such that contribution costs remain low and...
Source: How To De-risk a Pension
Risk is best defined as the “uncertainty” of meeting the client objective. The pension objective is to fund liabilities in a cost-effective manner such that contribution costs remain low and stable. Pension plans also want to de-risk their plans over time. The lowest risk assets for a pension are those that match the liability benefit payment schedule with certainty. By definition, Treasury zero-coupon bonds (STRIPS) and annuities would be the lowest risk assets for pension since they have a known future value… but they tend to come at a high cost since they are low yielding (STRIPS) or have high fees (annuities). Given that the pension objective is to secure benefit payments in a cost-efficient manner, then solving for cost while matching and fully funding the liability payment schedule would be the ideal way to de-risk a pension.
A pension liability benefit payment schedule is a term structure or yield curve often referred to as the liability cash flow. In order to match or de-risk each pension liability payment requires a matching cash flow from assets. Only bonds (and annuities) produce a certain cash flow. That is why bonds have been used for decades as the best way to defease, immunize, and de-risk a pension plan.
Problems with Hedges
Duration-matching strategies (Immunization), Interest Rate Swaps, futures, derivatives, risk overlays, etc. are all hedging tools to help assets match the liability growth rate. They are NOT de-risking strategies since they do not match the liability cash flows. Duration matching has several difficult, if not erroneous, data gathering choices it uses:
Average duration of liabilities
Where do you get the average duration of liabilities? Most, if not all, actuarial reports do not provide this calculation. Moreover, they usually do not provide the projected liability benefit payment schedule which you would need to calculate duration. In addition, actuarial reports are, at a minimum, annual reports usually three to six months delinquent so there would be serious delayed information. The duration calculation is at a precise moment in time… like a balance sheet. As time and interest rates change… so will duration. Only A Custom Liability Index (CLI) based on each pension’s unique liability benefit payment schedule could provide an accurate and monthly duration profile.Discount Rates
Since the duration of liabilities changes with interest rates (discount rates) this calculation needs to be refreshed and updated on a frequent and accurate basis. According to pension accounting rules (FAS 158, GASB 67) and federal funding standards (PPA – MAP 21 and spot rates) there is an assortment of discount rates required to price liabilities. Which one is best? The FASB accounting language says it best… you are use a discount rate that settles the liability payments. This means discount rates you can buy to settle or defease the liability payment schedule. ASC 715 comes the closest by using an AA corporate bond yield curve. Treasury STRIPS would be ideal, but no one seems to favor this approach since STRIPS are low yielding causing the present value of liabilities to be higher. The yield difference in these discount rates could be significant. Any difference in yield creates a difference in the calculation of duration and liability growth rates.Generic Bond Indexes
A common proxy for the average duration of liabilities is to use a generic bond market index… usually the Barclay’s long corporate index. Such a proxy creates several erroneous data issues. This index has no bonds shorter than 10 years and no durations longer than 16 years. This certainly does not represent any pension liability schedule even if the average durations were similar. Accounting standards and actuarial practices price liabilities as a portfolio of zero-coupon bonds with a single average discount rate based on the present value of this zero-coupon liability portfolio. There are no generic bond indexes that use zero-coupon bonds as their portfolio. There are no generic bond indexes that use pension discount rates in accordance with FASB, GASB and PPA guidelines. Each pension plan’s liabilities are different and unique to that plan due to a different labor force, salaries, mortality, and plan amendments. There is no way any generic bond market index could represent any pension plan liability term structure.Only a Custom Liability Index could properly represent and measure any pension plan’s liabilities providing all of the critical data calculations needed to de-risk the plan. In 1991, Ron Ryan designed the first Custom Liability Index (CLI). Based on each client’s unique projected liability benefit payment schedule, Ryan ALM produces monthly CLI reports on:
Structure (Present Value, Average Duration, YTM, Price, etc.)Growth Rate (Liability growth for month, year, and since inception)
Interest Rate Sensitivity (PV change in % and $ given rate changes)
Interest Rate Sensitivity
Every 1 year of duration difference between the liability proxy and the actual duration of each plan’s benefit payment schedule would represent a 1% mismatch in liability growth for every 100 bps of discount rate change. In truth, the duration mismatch is more likely to be three to five years rather than one year. Given that pension cost for the actuary, administration, asset managers, and consultant are usually less than 50 bps a year; such a duration mismatch could be very costly representing years of pension cost.
Funding Liabilities
Imagine a 12-year average duration liability benefit payment schedule. It could have many different term structure shapes to come up with an average 12-year average duration. Imagine 100% of the assets in a 12-year duration bond portfolio. If interest rates rose 50 basis points in one-year, total assets and liabilities supposedly would both have a -6% price return (interest rate movement x duration (as a negative number). If they had the same income return = 5% they would match again. However, if the duration matching assets are used to fund liabilities as they come due then a -1% loss (-6% + 5% = -1%) on assets could be funding a short liability which will have a small positive growth rate. So, the assets could be taking a loss each year to fund the next liability payment if interest rates continue to rise. This could get to be a serious costly mismatch if interest rates continue their secular trend to higher rates for the next few years. But the point is……there is no cash flow match here, only a duration match so there is both a funding and interest rate risk!
Derivatives
Interest rate swaps and futures are contracts not assets. There is no cash flow or funds available to make the liability cash flow payments. They are certainly NOT de-risking strategies but hedges vs. the liability growth rate. In fact, these strategies introduce more risk: counter party risk, interest rate risk, non-matching risk of assets purchased (usually equities) vs. liabilities, and leverage. In addition, interest rate swaps and futures have all of the problems associated with a liability proxy data gathering… as listed with duration matching.
Solution: Cash Flow Matching
As stated in the beginning, matching the liability benefit payment schedule (liability cash flow) at the lowest cost is the ideal way to de-risk a pension plan. Ryan ALM built a liability cash flow matching product, named the Liability Beta Portfolio™ (LBP), as a cost optimization model that matches the liability benefit payment schedule at the lowest cost given the investment policy restrictions of our clients.
The LBP provides about a 2% per year funding cost savings (1-15 years = 30%). This is a serious cost reduction and should be a major consideration of any de-risking strategy. Yes, the LBP model has some credit risk but very small since we are using investment grade corporate bonds with a credit filter (no bonds on negative watch list) plus the cost savings provides a large value-added cushion.
The funded ratio should dictate the allocation to bonds. A surplus should have a high allocation to bonds matched to liabilities and vice versa for a deficit funded status. Unfortunately, asset allocation did not respond to the surplus status in the 1990s which led to the US pension crisis. With funded ratios at 120% and above then, why didn’t pensions immunize and secure this victory? Amazingly, instead of increasing their bond allocation in response to a growing funded ratio they reduced it consistently because of low interest rates to the lowest bond allocations in modern history by 1999.
The allocation to bonds should determine how much of the liabilities we can cash flow match (i.e. a 25% bond allocation might fund the next seven years of gross liabilities). Ryan ALMrecommends: funding the next 10 years of Retired Lives on a net liability basis (after contributions). Indeed, current assets fund the net liabilities not the gross liabilities. Our LBP model will calculate with precision the cost to fund liabilities (gross or net) in a cost-effective manner either as a % of total liabilities or liabilities chronologically, as both methods will de-risk the plan gradually. There are advantages for each method.
Since liabilities are funded initially by contributions, using the LBP model to cash flow match net liabilities chronologically may be able to fund more liabilities than you think. Assume that a 20% bond allocation could match the next 10 years of net liability payments chronologically. Based on the Ryan ALM Liability Beta Portfolio™ (LBP) model we show a cost savings of about 20% on cash flow matching the first 10 years of liabilities, in this interest rate environment.
Matching liabilities chronologically should also buy time for the non-bond assets (Alpha assets) to perform and outgrow liabilities. Given time (7-10 years) most non-bond asset classes tend to outperform bonds. Since liabilities behave like bonds there is a high probability that non-bond asset classes could outperform vs. liability growth over an extended time horizon.
Since the pension objective is a cost focus, cash flow matching a % of total liabilities would produce the optimal cost savings since the longer the bond the less it costs given the same future value. Our LBP model is back tested since 2009. Every $1 billion in bonds used in our LBP model could save about $200 million in cost savings on a 1-10 year liability schedule and $400 million on a 1-20 year liability schedule.
Asset Allocation (AA)
Pension consultants and plan sponsors should consider installing an LBP as the core portfolio in asset allocation and as the liquidity assets to fund liability cash flows chronologically. The intrinsic value in bonds is the certainty of their cash flows. Bonds are usually not considered performance assets (Alpha assets) especially vs. pension liabilities which behave like bonds. Cash flow matching liabilities chronologically will buy time for the Alpha assets (non-bonds) to perform vs. liability growth, thereby enhancing the funded ratio. Such excess returns should be transferred over to the Liability Beta Portfolio™ (LBP) to de-risk more and more liabilities… Portable Alpha. Had this portable Alpha discipline been in place during the decade of the 1990s when funded ratios grew to their highest historical levels with true economic surpluses… there would be no U.S. pension crisis today!
Nota Bene (Note Well)
Please note that the definition of risk used in this article is in sharp contrast to the traditional approach produced by the Nobel Prize winner Ph.D. William F. Sharpe back in 1966. Professor Sharpe proposed that risk is the volatility of total returns and that the three-month T-Bill was the default risk-free rate. He developed the Sharpe Ratio as a means of calculating the risk-adjusted return by subtracting the return of the three-month T-Bill from the mean return of the asset(s) being analyzed and dividing the net return by the volatility of the return of the asset(s) in review. For many decades the Sharpe Ratio was the standard measurement of risk-adjusted returns. In 1994 Prof. Sharpe called me and invited me to Stanford to discuss our unique Custom Liability Index data and reports. I had the unique pleasure to meet and debate with one of the finest intellects I have ever met.
I proposed that risk is not a generic measurement but based on each client’s objective. I referenced pensions where every client’s liabilities are different (like snowflakes). As proof, I asked Professor Sharpe what is the risk-free asset for a 10-year liability payment? Professor Sharpe answered… a 10-year Treasury zero-coupon bond. Prof. Sharpe identified that the three-month T-Bill would have 39 reinvestment moments of uncertainty, so there is no way the three-month T-Bill could match a 10-year liability future value with any certainty and would become a risky asset. Our discussion led to Prof. Sharpe re-inventing the Sharpe Ratio in 1994 to include the benchmark objective instead of the three-month T-Bill in the numerator and denominator such that the average return of the asset portfolio is reduced by the average return of the objective (numerator). This net average return is then divided by the standard deviation of the asset portfolio excess return vs. the objective return. This is commonly called today… the Information Ratio.
Cash Flow Matching Overview
Cash Flow Matching Pension Objective Fund benefits in a cost-efficient manner with prudent risk Pension Needs Liquidity to fund benefits Reduce Contribution costs Reduce Volatility of Funded Status Strategy Value...
Source: Cash Flow Matching Overview
| Pension Objective | Fund benefits in a cost-efficient manner with prudent risk | ||||||||||||||||
| Pension Needs |
Liquidity to fund benefits Reduce Contribution costs Reduce Volatility of Funded Status |
||||||||||||||||
| Strategy | Cash flow match liability cash flows (benefits + expenses) | ||||||||||||||||
| Value in Bonds |
Certainty of cash flows (only asset class with such value) Maturity selection = yield curve (term structure) Cash flows every month as portfolio |
||||||||||||||||
| Methodology |
Ryan ALM creates a Custom Liability Index (CLI)
Ryan ALM creates Liability Beta Portfolio (LBP)
|
||||||||||||||||
| LBP Benefits |
Fully funds B+E and secures benefits with certainty
Reduces funding costs by 2% per year (1-10 years = 20%)Eliminates cash sweep of growth assets (Alpha assets) Buys time for Alpha assets to grow unencumbered Reduces volatility of funded ratio/status Outyields liabilities creating alpha Enhances funded status and ROA Reduces Contribution costs Mitigates interest rate risk Hedges pension inflation Low fee |
||||||||||||||||
| Note: |
LBP does not change any accounting, actuarial and asset allocation (AA) actions. LBP is a less risky & less costly alternative to active bond management. LBP is a best fit to the true pension objective. |
||||||||||||||||
| Interest Rate Risk (IRR) |
Biggest and dominant risk on bonds present values (PV) Benefits + expenses = future values (FV) B+E are not interest rate sensitive LBP funds Benefits + Expenses LBP mitigates IRR |
||||||||||||||||
| Pension Inflation |
Actuarial projections unique to each pension plan Inflation assumptions =/= CPI |
||||||||||||||||
| Generic Bond Indexes |
Not a proper benchmark Do not represent pension liabilities Liabilities are like snowflakes, unique to each plan sponsor Only a Custom Liability Index could measure/monitor liabilities |
||||||||||||||||
| Value Added |
Ryan ALM offers clients a series of synergistic values:
|
||||||||||||||||
| Awards |
Gold Medal Winner – The U.S. Pension Crisis book of the year Bernstein, Fabozzi, Jacob Levy – Research Paper of the year William F. Sharpe Index Lifetime Achievement Money Management Letter Lifetime Achievement Capital Link – Most Innovative ETF IMN - ETF of the year |
Immunizing Pension Expense Volatility
Pension management is an Assets vs. Liabilities objective. Corporations tend to focus on pension expense since it is a direct hit to earnings and stockholder value. Corporations do not want...
Source: Immunizing Pension Expense Volatility
Pension management is an Assets vs. Liabilities objective. Corporations tend to focus on pension expense since it is a direct hit to earnings and stockholder value. Corporations do not want volatility on earnings coming from pension expense. The major factors affecting pension expense are the dollar growth of assets minus the dollar growth in liabilities. This is in sharp contrast to a % growth difference (ROA of assets – discount rate of liabilities). Pension expense is all about dollars not %. There are two primary liability driven investment (LDI) bond strategies in use today: Duration Matching and Cash Flow Matching.
Duration Matching
The purpose of duration matching is for assets to match the interest rate sensitivity of liabilities (immunization). The objective is to have the market value change (% growth rate) in the immunization bond portfolio match the % growth rate (discount rate) in liabilities for a given change in interest rates. Many LDI fixed income managers attempt to match the average duration of their bond portfolio to the average duration of a bond market index with a similar duration to liabilities (i.e., Bloomberg Barclays long corporate index). They use the bond index as a proxy for liabilities. There are several problems and flaws with this strategy.
A generic bond index cannot replicate any clients’ unique liabilities cash flows. Client’s liabilities are like snowflakes: different labor force, salaries, mortality, etc..
Average durations give erroneous information because there are a numerous number of combinations of maturities for a bond portfolio that can all have the same average duration, but they will not have the same risk/reward profile or interest rate sensitivity.
Duration matching is only accurate for small parallel shifts in the yield curve. But the yield curve rarely moves an equal number of basis points at every point along the curve.
FASB requires a single discount rate for financial statements which does not calculate a proper target duration. You need to use the ASC 715 discount rate yield curve.
LDI bond management evolved to remedy these flaws by using Key Rate durations which attempt to match the duration of multiple points along the liability yield curve. Key Rate duration is an improvement over a single average duration, but still has several deficiencies:
Actuaries usually do not provide the average duration of liabilities and the projected benefits in their annual actuarial report… reason why generic bond indexes are used.
Matching key rate durations of a generic market index = wrong Key Rate durations.
Duration is a present value calculation requiring pricing each projected benefit with a different discount rate (i.e., ASC 715 discount rates yield curve). As a result, 30 annual benefit payments require 30 separate discount rates and 30 key rate durations.
Duration must be modified (duration/1+YTM) to use as a price return or interest rate sensitivity measurement.
Solution: Dollar Duration Matching (DDM)
DDM matches the dollar value change per basis point change in yield for assets with the dollar value change per basis point change in yield for liabilities. When the dollar duration of assets is matched to the dollar duration of liabilities for every year in the term structure of liabilities, then DDM is in its most precise form. That would be the equivalent of 30 Key Rate durations… one at every point along the liabilities yield cure or benefit payment schedule (30 years = 30 key rate durations). Ryan ALM recommends DDM for Active Lives liabilities. The Ryan ALM DDM approach offers several value-added differences:
Actuarial Projections - We use the actuarial projected benefits of our clients and not a generic bond index benchmark.
Modified durations - to be an effective price sensitivity measurement, duration must be modified. Modified Duration measures the percent change in market value or present value for future value cash flows given a 100-basis point movement in yield.
Dollar duration - our objective here is to match the dollar value change per basis point in assets and liabilities in every annual liability maturity or duration.
The Ryan ALM DDM approach greatly improves the accuracy of Key Rate duration matching by matching the dollar value changes in liabilities with the dollar value changes in assets across the liabilities term structure. DDM is in harmony with the corporate objective of immunizing pension expense. The liabilities are measured and monitored by using a Custom Liability Index (CLI) to more precisely calculate the dollar value (PV) movement in assets versus liabilities given any movement in interest rates. The CLI is the most appropriate benchmark for any asset liability management (ALM) and should be the first step in any LDI strategy.
ASC 715 Discount Rates – Ryan ALM is one of few vendors providing ASC 715 discount rates (AA corporate zero-coupon bonds as a yield curve). We will price each actuarial projected benefit payment on a monthly basis.
Custom Liability Index (CLI) - The CLI provides all of the calculations needed for either dollar duration matching or cash flow matching. The CLI will calculate YTM, modified duration, actual growth rate and interest rate sensitivity for each projected benefit as a term structure as well as total liabilities showing both the % and $ change in present values.
Liability Beta Portfolio™ (LBP) – our LBP will dollar duration match or cash flow match projected benefits chronologically using our proprietary LBP cost optimization model that will secure benefits, reduce funding costs significantly as well as immunize interest rate sensitivity.
Solution: Cash Flow Matching (CDI)
Ryan ALM believes that the true objective for a defined benefit pension is to fund and secure benefits when due in a cost-efficient manner. The value in bonds is in the certainty of their known and scheduled cash flows which is why cash flow matching has been used as a major strategy for hedging liabilities for many decades (i.e., dedication, defeasance). It is the matching and funding of benefits (future values) that is the primary focus of cash flow driven investments (CDI). As such, future values are not interest rate sensitive… a major benefit of cash flow matching. Cash flow driven investing (CDI) dominates the way European pensions are managed under IASB accounting standards. Key Rate duration and especially dollar duration matching (DDM) are good for matching present value movements between assets and liabilities but do not focus on funding liability payments (future values). Pensions require liquidity that is sufficient and timely to fund benefits + expenses (B+E). CDI will cash flow match both B+E based on the actuarial projections. CDI is a best fit to fund Retired Lives given their higher degree of certainty. Active Lives might be best served with dollar duration matching (DDM) given the actuarial noise and uncertainty of such actuarial projections.
Since the primary value in bonds is in the certainty of their cash flows, Ryan ALM will cash flow match projected benefit payments chronologically. This provides numerous benefits:
Secures the benefits
Significantly de-risks the plan
Reduces funding costs significantly
Higher yielding bond portfolio than CLI + DDM
Provide adequate and timely liquidity to fund B+E
Reduces volatility of funded ratio and contributions
Buys time for performance assets (Alpha) to grow unencumbered
No interest rate risk since LBP is funding future values (benefit payments)
A major benefit of the Ryan ALM cash flow matching model is the reduction in funding costs by usually 1% per year. If we cash flow match 1-30 years of benefits = 30% cost reduction between the cost of benefits (future value) and the cost to cash flow match (present value). The CDI is skewed to A/BBB+ bonds and longer maturities to reduce funding costs. This will cause the CDI to outyield liabilities by 50-100 bps and DDM. Moreover, the CDI provides adequate and timely liquidity to fund B+E. Many, if not most, pensions do a cash sweep of all asset classes to fund current benefits + expenses. CDI will fund B+E when due which will buy time for the performance assets (Alpha) to grow unencumbered. S&P data shows that dividends reinvested > 50% of the S&P 500 growth in the last 70 years. If interest rates rise, cash flow matching can reinvest any excess cash flows at the then higher yields which will lower funding costs while bonds managed with a purely total return focus would get hurt with lower price returns.
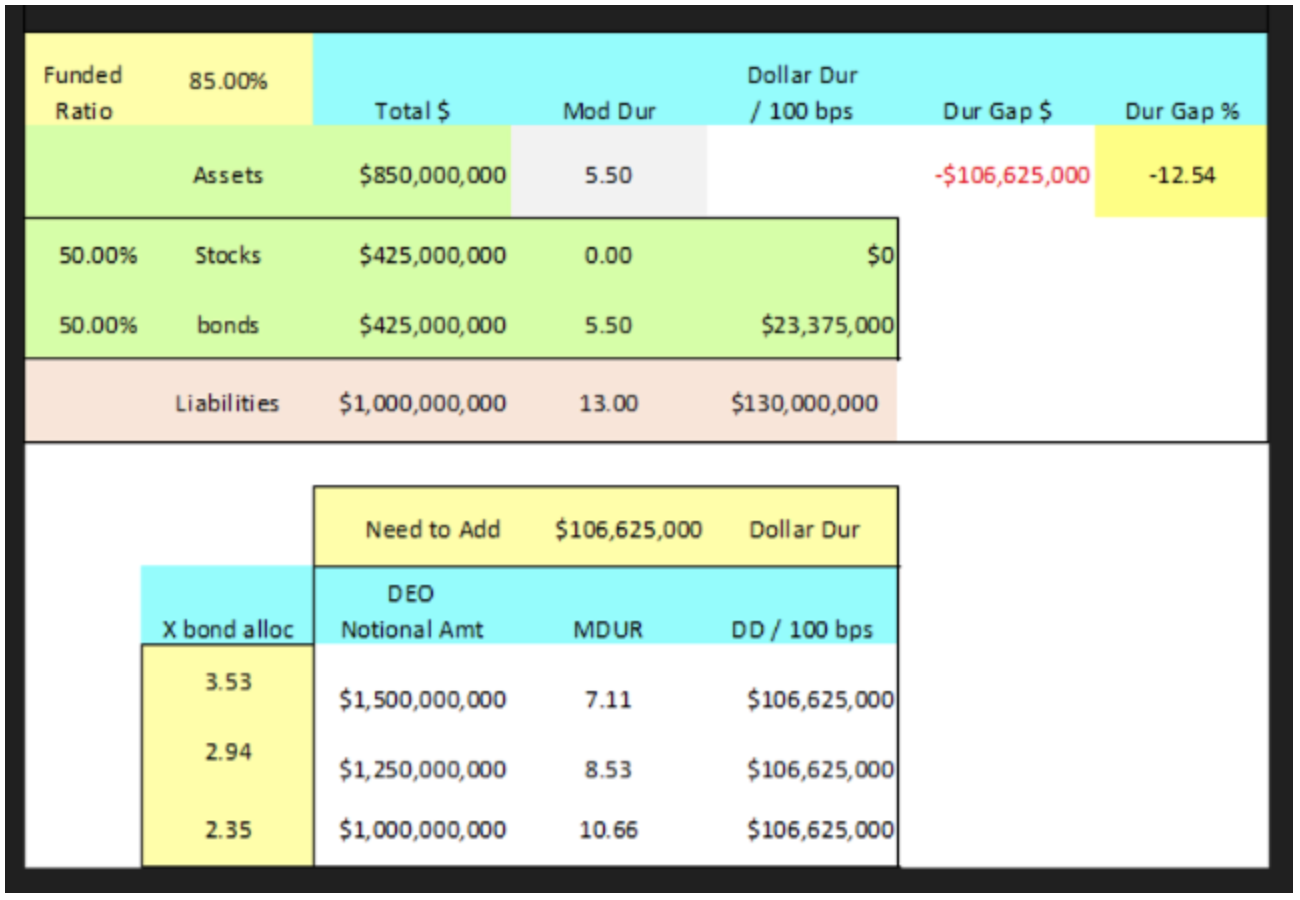
Solution: Duration Enhancing Overlay (DEO)
DDM and CDI cannot hedge 30+ year liabilities well due to the lack of bonds to buy. In a Duration Enhancing Overlay (DEO) strategy, derivatives are used to add duration. The assets in the DDM and CDI portfolios can be used as margin capital for targeted positions in interest rate swaps, swaptions or buy/sell Treasury Futures.
A Duration Enhanced Overlay (DEO) is a zero-investment strategy that can be constructed by taking long only derivatives positions like futures positions in long-dated Treasury bonds, or by taking positions in futures on long-dated treasury bonds while also taking the opposite positions in shorter term Treasury securities.
A DEO should be in addition to a CDI or DDM strategy not instead of. The issue becomes the size of the derivative contracts needed to close the duration gap. In the example below, it would take 2.2x to 3.5x the bond position to close the $ duration gap. Ryan ALM cautions against such a strategy as undue leverage but we admit the existence of a dollar duration gap.
The Pension ROA is Plural…ROAs
The pension return on assets (ROA) assumption is a critical calculation since it affects both assets (asset allocation) and liabilities (discount rate). Most plan sponsors and their consultants focus on...
Source: The Pension ROA is Plural…ROAs
The pension return on assets (ROA) assumption is a critical calculation since it affects both assets (asset allocation) and liabilities (discount rate). Most plan sponsors and their consultants focus on the ROA as the assets hurdle rate. Asset allocation models use the ROA as the target return. Public and multiemployer pension plans tend to also use the ROA as the liability discount rate.
Asset Allocation
The ROA is usually calculated by first looking at the average historical returns of the index benchmark for each allowable asset class except bonds and cash where the current yield is used. Each asset class is then weighted to come up with the ROA calculation for the total pension fund. The ROA has to be verified by auditors and/or actuaries that such return assumptions used for each asset class are realistic. The range of return assumptions usually stretch from a high of 10% to 12% for Private Equity and Alternatives to a low of 1% for cash and 3% for fixed income.
As a result, each asset class is asked to earn the ROA assigned to them by using their index benchmark as the target return proxy. They are NOT required to earn the pension fund ROA assumption (@ 7% today). This is an important fact to remember in asset allocation. We at Ryan ALM often hear the criticism and question… how can we invest in 3% bonds to earn our ROA (of 7%)? The answer is bonds do NOT need to earn the pension ROA… just their assigned ROA in the asset allocation model.
Better yet, the ROA is usually calculated annually. Interest rates have risen significantly in 2022 allowing current bonds to easily outyield the ROA (even the 1-year Treasury Bill outyields the bond ROA). Since the asset allocation model traditionally uses the Bloomberg Barclay (BB) Aggregate as the fixed income index benchmark (initially the Lehman Aggregate I designed as the head of Fixed Income Research in the late 1970s and early 1980s). This index is heavily skewed to low yielding Government securities (1.77% as of December 31, 2021 and 2.92% on March 31, 2022). If you buy a fixed income portfolio that outyields the BB Aggregate with similar or shorter duration, you are in a good position to earn the ROA assigned to fixed income. Remember… the asset allocation model uses yields not returns for the fixed income ROA. In fact, if you could buy a one-year bond at the yield of the BB Aggregate… you would achieve your annual ROA objective!
But bonds can do better… much better:
Cash Flow Matching – if bonds were used to cash flow match and fund net liabilities (after contributions) chronologically they would produce the liquidity needed to fully fund such net liabilities. Cash flow matching works best with longer coupon bonds where you use semi-annual interest income to partially fund shorter liabilities. A 10-year bond has 20 interest cash flows + one principal cash flow all priced at a 10-year yield. This would eliminate the need to do a cash sweep of other asset classes which is a common liquidity procedure. According to S&P data, the S&P 500 has 48% of its historical returns from dividends and reinvestment since 1940 on a 10-year rolling period basis. Wouldn’t you want to reinvest dividends back into growth assets rather than spend it on funding benefits + expenses? By using bonds as the liquidity assets, the growth assets are left unencumbered to grow. The longer the cash flow matching period, the more time the Alpha assets have to compound their growth. This could significantly enhance the ROA.
Yield on Bonds – As described previously, the ROA forecast for fixed income is based on the current yield of its index benchmark. The Bloomberg Barclay Aggregate is most favored as the bond index benchmark. The Aggregate is a very large, diversified and low yielding portfolio of bonds with the following summary statistics as of December 31, 2021:
| # of issues | 9,982 | Treasury | 39.76% | AAA | 68.92% |
| YTM | 1.77% | Agency | 4.04% | AA | 2.92% |
| Duration | 6.58 yrs. | Mtg. Backed | 29.91% | A | 11.16% |
| Avg. Maturity | 8.78 yrs. | Corporates | 26.29% | BBB | 15.38% |
As a result, most asset allocation models would have a ROA for bonds of about 2.00%. If you can build a bond portfolio that outyields the Aggregate index with similar or shorter duration, by definition, it should enhance the ROA for total assets. Ryan ALM Advisers, LLC has created a cash flow matching product we call the Liability Beta Portfolio™ (LBP). The LBP is a cost optimization model that cash flow matches liability cash flows chronologically at the lowest cost from a corporate bond portfolio skewed to A/BBB bonds.
Based on the actuarial projections of each client we initially build a Custom Liability Index (CLI) to calculate net liabilities ((benefits + expenses) – contributions) chronologically. The CLI provides all the data needed for the LBP to function efficiently. Based on the allocation to the LBP will determine how far out the LBP can fully fund net liabilities. Usually, a 15% allocation to the LBP can fund 1-7 or 1-10 years of net liabilities. Usually, the longer the term structure of the LBP, the higher the yield. The LBP will outyield the Aggregate index by over 50 bps (1-5 years) to over 100 bps (1-10 years) based on the LBP term structure. If the LBP outyields the AGG index by 50 to 100 bps, asset allocation can afford to overweight the bond allocation and still meet the target ROA for total assets. A 15% allocation to an LBP yield of 5.00% is 75 bps value added to the ROA while 15% at BB Aggregate yield of 3.00% is only 45 bps. Said differently, you would need a 25% allocation to a bond total return focus versus the Aggregate yielding 3% today to equal the same ROA value as a 15% allocation at a LBP yield of 5.00%.
3. Higher Interest Rates – bonds are interest rate sensitive as to their market value (present value). Rising US interest rates may or should cause negative returns. However, cash flow matching is focused on funding B + E (Benefits + Expenses) which are future values. Future values are not interest rate sensitive. Bonds are the only asset class with the certainty of cash flows (future values). That is why bonds have always been used as the methodology for defeasance (cash flow matching) of liabilities. Moreover, if interest rates trend upward any reinvestment of cash flow can buy future value at a lower cost. As a result, cash flow matching sees higher interest rates as an opportunity to reduce funding costs.
4.Cash – many pension plans have a cash allocation of around 1% to 3%. Cash is usually the lowest yielding asset. Since the LBP becomes the liquidity assets to fully fund benefits + expenses chronologically, there is little need for cash to fund B+E. Cash might only be needed for capital calls on Private Equity and other Alternative Investments. The LBP should significantly increase the yield margin versus cash since the LBP is using coupon income from all maturities of the LBP and is skewed to A/BBB corporate bonds. With the LBP fully funding B+E, the cash allocation can be reduced to around 1%. Replacing most of the cash allocation to fund B+E with the LBP allocation is another ROA enhancement… it all adds up.
The Flaws of Bond Indexes…Benchmark, Bogey or Bogus?
The first bond indexes were born June 1973 created by Art Lipson (my boss) at Kuhn, Loeb. As my mentor, I owe Art much for his educational leadership. When Lehman...
Source: The Flaws of Bond Indexes…Benchmark, Bogey or Bogus?
The first bond indexes were born June 1973 created by Art Lipson (my boss) at Kuhn, Loeb. As my mentor, I owe Art much for his educational leadership. When Lehman purchased Kuhn, Loeb at the end of 1977 such indexes became the Lehman bond indexes. Since there was no bond exchange (still true today) you needed a Wall Street broker/dealer to create bond indexes because they knew how to price all the securities that comprised a bond index as well as calculate some of the difficult yield and duration calculations. In 1979 Lehman became the accepted bond index benchmark(s) for most U.S. institutions although Salomon (now Citigroup) and Merrill Lynch (now Bank of America) provided numerous bond indexes. These old traditional indexes have dictated the risk/reward of most bond managers for over 40 years. Investment bankers embraced these bond indexes as a way to win clients suggesting that any issuance of bonds would result in inclusion in their indexes. Through time these traditional bond indexes became garbage cans of investment banking as the index portfolios swelled to many thousands of bonds. Such bond indexes have structural flaws that should prevent them from being accepted as benchmarks for most institutions especially those with a liability objective:
Flaw: Weights
Traditional bond indexes use market weighting as their preferred valuation. In order to market weight a bond index you need two data requirements: end of day pricing of all bonds in the index and the current amount outstanding. Since there is no bond exchange end of day pricing is difficult. Different market vendors will all have different prices for the same bonds. This leads to different risk/reward behaviors. But the more difficult data, believe it or not, is the amount outstanding. As simple as it sounds, we do not know the amount outstanding for many issues at month-end rebalancing and calculation. Treasuries and Agencies are stripped thereby reducing the float on these bonds. Such information is provided delinquently (Treasuries) or not at all (Agencies). As a result, traditional bond indexes leave the original amount issued as the amount outstanding. A $10 billion Treasury issue may have only $4 billion left in float. Since bond indexes do not include STRIPS they will overweight Treasuries and Agencies coupon issues by not changing the original amount outstanding. This will skew the returns of the index accordingly. Corporate bonds have tenders, sinking funds and puts which could affect the amount outstanding. Usually such information is only reported annually in the 10-k. As a result, corporate bonds are never correctly updated if they face any of the principal reduction features. Mortgage-backed securities have monthly payments of principal (as regular amortizations and prepayments). Such information is reported after the end of the month several weeks delinquent. As a result, bond indexes have to use previous month’s data. Since prepayments affect total returns not only is the amount outstanding incorrect but the prepayment used for the current month is not accurate. Both inaccuracies lead to erroneous return calculations however small or large they may be. In truth, it is Mission Impossible to update accurately the amount outstanding of most bonds which in turn affects the accuracy of the risk/reward calculations.
Solution: Equal Weighted. When I left Lehman, I began to create equal-weighted bond indexes as the solution to the market weighting problems. Not only does equal-weighting have no weighting skewness or bias but it also best represents how most investors do their work (every bond is analyzed without weights as individual securities with an equal opportunity to be purchased). Moreover, why should one bond be superior to another bond in its portfolio weight in an unbiased index? Treasuries with their huge and growing issuances could and do dominate a bond index portfolio such that other bonds hardly affect the risk/returns of the index. Can you imagine how a Treasury 2-year auction of $44 billion skews the weights when compared to a $400 million corporate bond. That’s a ratio of 110 to 1. Is that really what investors want? All Treasuries, Agencies, Corporate and Mortgage-backed securities should be equal weighted in an index construction. The only question should be …do you weight these sectors differently?
Tracking Error
Given the enormous size of most traditional bond indexes (in number of issues) it is most difficult, if not impossible, to purchase such a portfolio. Most bonds in an index are not liquid. So, what do Index Funds and especially ETFs do to duplicate these illiquid bond indexes? Wall Street provides replication strategies that supposedly get you close to the risk/reward behavior of such indexes. In most replication models they only buy the most liquid securities and try to match the average duration of the index benchmark. Investors will then be faced with some degree of tracking error since you cannot purchase the index portfolio. Tracking error tends to measure the monthly average return differences. However, a five basis point monthly tracking error could be a 30 basis points annual return difference. The question remains why not build the index the way replication models work with only the most liquid issues?
Solution: Investible Indexes. All Ryan ALM Indexes are investible indexes as a rule of our index methodology. We only take the largest and most liquid issues as the composition in any of our indexes to insure liquidity which also insures better pricing. Equity indexes have certainly worked this way for several decades as the Dow Jones Industrial Average (30 stocks) and the S&P 500 are a testament.
Transparency
Flaw: Portfolio Averages
Summary statistics are critical data for bond asset managers. Most investors will build their bond portfolios around the average yields and durations displayed by the index benchmarks. Index funds try to match these averages while active bond managers will try to tilt their portfolio longer or shorter than this average duration. Unfortunately, portfolio averages are misleading, if not erroneous, data. To prove this accusation please input any bond index’s posted average price, coupon and maturity into a bond calculator and see if you get the average YTM. NO …so what happened? A classic was the Lehman Aggregate reported averages as of July 1990:
Average Coupon = 9.13%
Average Price = 100.00
Average YTM = 8.57%
How could a bond at par have a YTM that is 0.56% less than the coupon? Because portfolio averages are not indicative of the true risk/reward of the index portfolio… Caveat Emptor!
About Ryan ALM, Inc.
Ryan ALM was founded by Ronald J. Ryan, CFA on July 12, 2004 as an Asset/Liability Management firm. The firm builds a turnkey system of proprietary synergistic products designed to measure liabilities as a Custom Liability Index (CLI) and manage assets to the CLI as Liability Beta Portfolios.
Ryan ALM is unique in having its own proprietary Index company named ALM Research Solutions, LLC. This company builds both custom and generic bond indexes. Such indexes range from Custom Liability Indexes to ETF Indexes.
Our Liability Beta Portfolio™ is our proprietary cost optimization model that "cash flow matches" clients projected liability benefit payment schedules at the least cost using investment grade bonds. It is back-tested since 2009 showing a consistent cost savings of 8% to 15%. Our LBP best represents the core portfolio of a pension plan.