
Ryan ALM
White Papers
Browse
Ryan ALM Pension Monitor Q1’23
1Q 2023 Ryan ALM Pension Monitor (Through March 31, 2023) Pension plan liabilities need to be measured and monitored regularly. Without knowledge of plan liabilities, the allocation of plan assets...
Source: Ryan ALM Pension Monitor Q1’23
(Through March 31, 2023)
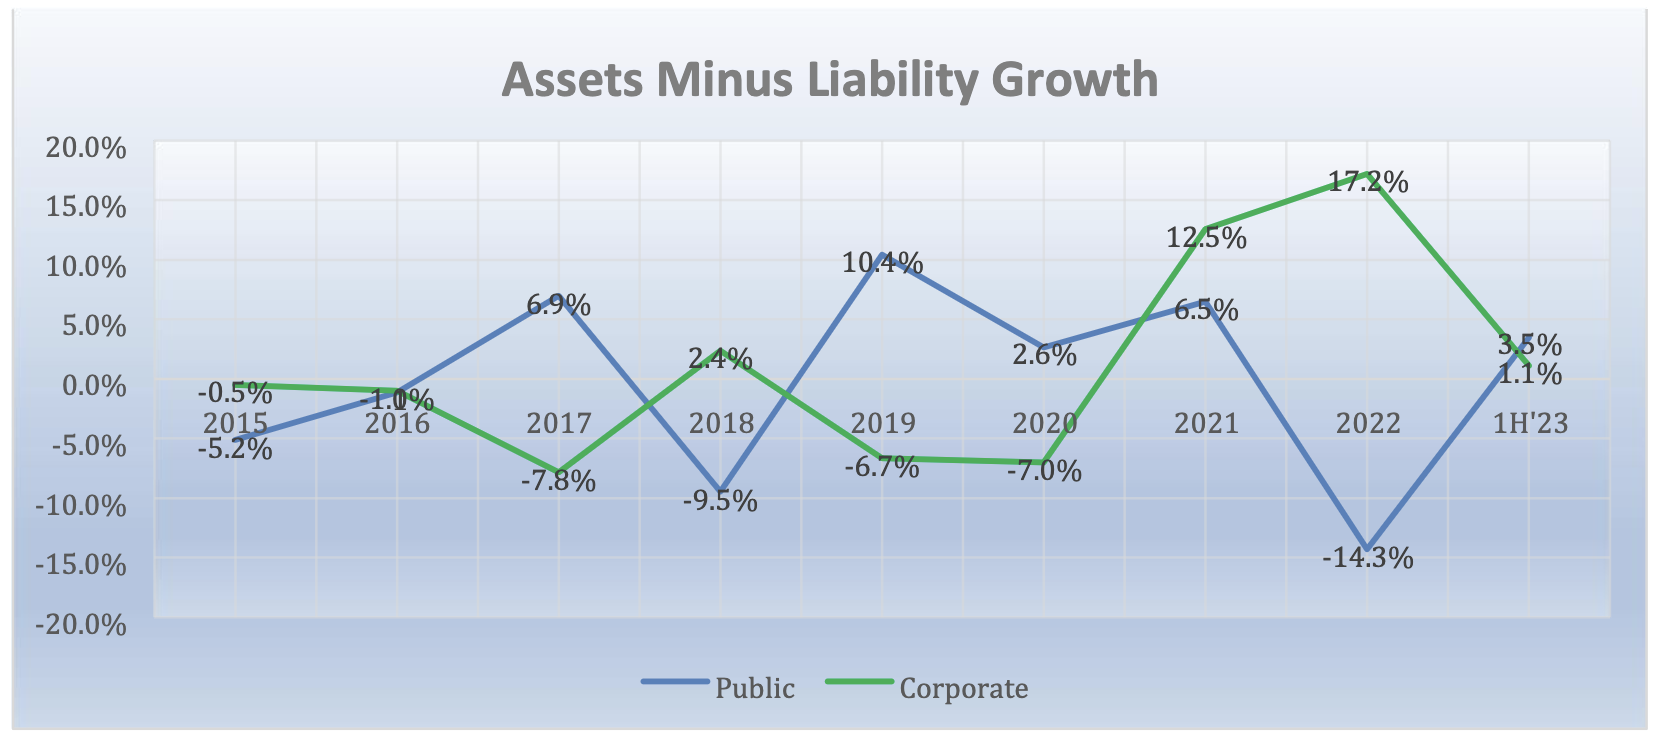
Pension plan liabilities need to be measured and monitored regularly. Without knowledge of plan liabilities, the allocation of plan assets cannot be done efficiently or appropriately. The funded ratio/status of pension plans are present value calculations. Each type of plan is governed by accounting rules and actuarial practices, which determine the discount rate used to calculate the present value of liabilities. Single employer corporate plans are under ASC 715 (FASB) discount rates (AA corporate zero-coupon yield curve); multiemployer plans and public plans use the ROA (return on asset assumption) as the liability discount rate. The difference in liability growth between these plans can be quite significant (see 2022), which will affect funded status and contribution levels.
The table below compares these different liability growth rates (based on a 12-year average duration) versus the asset growth rate based on the P&I asset allocation survey of the top 1,000 plans which is updated each year. The graph below shows the contrasting annual differences of asset versus liability growth for corporate and public plans since 2015. The impact of different accounting rules can create confusion, as reflected in the chart below. Corporations underperformed as declining interest rates increased the present value of a plan’s future benefits.
| ASSET ALLOCATION | Q1’23 Return | Corporate | Public | Union |
|---|---|---|---|---|
|
Domestic Stock International Stock Global Equity Domestic Fixed Income Global Fixed Income Cash Private Equity Real Estate Equity* Other |
7.5% 8.7% 6.8% 3.0% 3.5% 1.2% 3.0% -5.2% 1.8% |
11.1% 6.1% 6.3% 44.4% 0.9% 2.2% 12.4% 5.5% 11.1% |
22.1% 13.4% 4.5% 19.4% 1.6% 1.6% 15.1% 11.6% 10.7% |
18.7% 9.1% 13.6% 28.9% 0.0% 0.7% 10.7% 9.4% 8.9% |
| TOTAL ASSETS Growth Rate | 3.5% | 4.0% | 3.8% | |
| LIABILITIES Growth Rate | 7.2% | 1.8% | 1.8% | |
| Asset Growth – Liability Growth | -3.7% | 2.2% | 2.0% |
Index Benchmarks: Domestic Stock = S&P 500; Int’l Stock = EAFE, Global Equity = All Country World; Domestic Fixed Income = BB Aggregate; Global Fixed Income = FTSE World Gov’t (unhedged); Cash = Ryan ALM Cash Index; Private Equity =10-year return for the R2500 + 2%; *Real estate Equity =NFI-DP Index (one quarter lag); Alternative Investments and Other = CPI-U & 3%.
Footnote: The measurement of asset growth to liability growth is an annual calculation beginning on December 31, 2015. For periods shorter than 1-year, the observation is a YTD calculation.
Both Corporate and Public plans had average asset allocations that produced positive results during the first quarter. However, differences in the accounting rules between GASB and FASB led to Corporate plans showing a negative return when comparing assets versus liabilities.
The Pension ROA is Plural…ROAs
The pension return on assets (ROA) assumption is a critical calculation since it affects both assets (asset allocation) and liabilities (discount rate). Most plan sponsors and their consultants focus on...
Source: The Pension ROA is Plural…ROAs
The pension return on assets (ROA) assumption is a critical calculation since it affects both assets (asset allocation) and liabilities (discount rate). Most plan sponsors and their consultants focus on the ROA as the assets hurdle rate. Asset allocation models use the ROA as the target return. Public and multiemployer pension plans tend to also use the ROA as the liability discount rate.
Asset Allocation
The ROA is usually calculated by first looking at the average historical returns of the index benchmark for each allowable asset class except bonds and cash where the current yield is used. Each asset class is then weighted to come up with the ROA calculation for the total pension fund. The ROA has to be verified by auditors and/or actuaries that such return assumptions used for each asset class are realistic. The range of return assumptions usually stretch from a high of 10% to 12% for Private Equity and Alternatives to a low of 1% for cash and 3% for fixed income.
As a result, each asset class is asked to earn the ROA assigned to them by using their index benchmark as the target return proxy. They are NOT required to earn the pension fund ROA assumption (@ 7% today). This is an important fact to remember in asset allocation. We at Ryan ALM often hear the criticism and question… how can we invest in 3% bonds to earn our ROA (of 7%)? The answer is bonds do NOT need to earn the pension ROA… just their assigned ROA in the asset allocation model.
Better yet, the ROA is usually calculated annually. Interest rates have risen significantly in 2022 allowing current bonds to easily outyield the ROA (even the 1-year Treasury Bill outyields the bond ROA). Since the asset allocation model traditionally uses the Bloomberg Barclay (BB) Aggregate as the fixed income index benchmark (initially the Lehman Aggregate I designed as the head of Fixed Income Research in the late 1970s and early 1980s). This index is heavily skewed to low yielding Government securities (1.77% as of December 31, 2021 and 2.92% on March 31, 2022). If you buy a fixed income portfolio that outyields the BB Aggregate with similar or shorter duration, you are in a good position to earn the ROA assigned to fixed income. Remember… the asset allocation model uses yields not returns for the fixed income ROA. In fact, if you could buy a one-year bond at the yield of the BB Aggregate… you would achieve your annual ROA objective!
But bonds can do better… much better:
Cash Flow Matching – if bonds were used to cash flow match and fund net liabilities (after contributions) chronologically they would produce the liquidity needed to fully fund such net liabilities. Cash flow matching works best with longer coupon bonds where you use semi-annual interest income to partially fund shorter liabilities. A 10-year bond has 20 interest cash flows + one principal cash flow all priced at a 10-year yield. This would eliminate the need to do a cash sweep of other asset classes which is a common liquidity procedure. According to S&P data, the S&P 500 has 48% of its historical returns from dividends and reinvestment since 1940 on a 10-year rolling period basis. Wouldn’t you want to reinvest dividends back into growth assets rather than spend it on funding benefits + expenses? By using bonds as the liquidity assets, the growth assets are left unencumbered to grow. The longer the cash flow matching period, the more time the Alpha assets have to compound their growth. This could significantly enhance the ROA.
Yield on Bonds – As described previously, the ROA forecast for fixed income is based on the current yield of its index benchmark. The Bloomberg Barclay Aggregate is most favored as the bond index benchmark. The Aggregate is a very large, diversified and low yielding portfolio of bonds with the following summary statistics as of December 31, 2021:
| # of issues | 9,982 | Treasury | 39.76% | AAA | 68.92% |
| YTM | 1.77% | Agency | 4.04% | AA | 2.92% |
| Duration | 6.58 yrs. | Mtg. Backed | 29.91% | A | 11.16% |
| Avg. Maturity | 8.78 yrs. | Corporates | 26.29% | BBB | 15.38% |
As a result, most asset allocation models would have a ROA for bonds of about 2.00%. If you can build a bond portfolio that outyields the Aggregate index with similar or shorter duration, by definition, it should enhance the ROA for total assets. Ryan ALM Advisers, LLC has created a cash flow matching product we call the Liability Beta Portfolio™ (LBP). The LBP is a cost optimization model that cash flow matches liability cash flows chronologically at the lowest cost from a corporate bond portfolio skewed to A/BBB bonds.
Based on the actuarial projections of each client we initially build a Custom Liability Index (CLI) to calculate net liabilities ((benefits + expenses) – contributions) chronologically. The CLI provides all the data needed for the LBP to function efficiently. Based on the allocation to the LBP will determine how far out the LBP can fully fund net liabilities. Usually, a 15% allocation to the LBP can fund 1-7 or 1-10 years of net liabilities. Usually, the longer the term structure of the LBP, the higher the yield. The LBP will outyield the Aggregate index by over 50 bps (1-5 years) to over 100 bps (1-10 years) based on the LBP term structure. If the LBP outyields the AGG index by 50 to 100 bps, asset allocation can afford to overweight the bond allocation and still meet the target ROA for total assets. A 15% allocation to an LBP yield of 5.00% is 75 bps value added to the ROA while 15% at BB Aggregate yield of 3.00% is only 45 bps. Said differently, you would need a 25% allocation to a bond total return focus versus the Aggregate yielding 3% today to equal the same ROA value as a 15% allocation at a LBP yield of 5.00%.
3. Higher Interest Rates – bonds are interest rate sensitive as to their market value (present value). Rising US interest rates may or should cause negative returns. However, cash flow matching is focused on funding B + E (Benefits + Expenses) which are future values. Future values are not interest rate sensitive. Bonds are the only asset class with the certainty of cash flows (future values). That is why bonds have always been used as the methodology for defeasance (cash flow matching) of liabilities. Moreover, if interest rates trend upward any reinvestment of cash flow can buy future value at a lower cost. As a result, cash flow matching sees higher interest rates as an opportunity to reduce funding costs.
4.Cash – many pension plans have a cash allocation of around 1% to 3%. Cash is usually the lowest yielding asset. Since the LBP becomes the liquidity assets to fully fund benefits + expenses chronologically, there is little need for cash to fund B+E. Cash might only be needed for capital calls on Private Equity and other Alternative Investments. The LBP should significantly increase the yield margin versus cash since the LBP is using coupon income from all maturities of the LBP and is skewed to A/BBB corporate bonds. With the LBP fully funding B+E, the cash allocation can be reduced to around 1%. Replacing most of the cash allocation to fund B+E with the LBP allocation is another ROA enhancement… it all adds up.
How Bonds Can Enhance the ROA
Given the volatility and uncertainty of the financial markets, bonds can provide Pension Plan Sponsors a strategy to mitigate some of that volatility. Bonds, through the certainty of their cash...
Source: How Bonds Can Enhance the ROA
Given the volatility and uncertainty of the financial markets, bonds can provide Pension Plan Sponsors a strategy to mitigate some of that volatility. Bonds, through the certainty of their cash flows, prove to be a very effective tool. Most pensions focus on earning the return on asset (ROA) assumption as the goal of asset allocation. Because bonds yield less today than the ROA (7.00% average) the asset allocation to bonds tends to be lower than historic norms. But there exists a bond allocation that could enhance the probability of achieving the ROA. Here’s how:
Cash Flow Matching – if bonds were used to cash flow match and fund net liabilities (after contributions) chronologically they would produce the liquidity needed to fully fund such net liabilities. Cash flow matching works best with longer coupon bonds where you use semi-annual interest income to partially fund liabilities. A 10-year bond has 20 interest cash flows + one principal cash flowall priced at a 10-year yield. Having this liquidity would eliminate the need to do a cash sweep from other asset classes which is a common liquidity procedure. According to Guinness Global, the S&P 500 has 47% of its historical returns from dividends and reinvestment since 1940 on a 10-year rolling period basis. Wouldn’t you want to reinvest dividends back into growth assets rather than spend it on funding benefits + expenses? By using bonds as the liquidity assets, the growth assets are left unencumbered to grow. The longer the cash flow matching period, the more time the growth assets have to compound their growth. This strategy and practice could significantly enhance the ROA.
Yield on Bonds – the asset allocation models forecast the return of each asset class in the model, then weight each asset class to get the derived ROA for total assets. The ROA for most asset classes is based on the historical returns of each asset class index benchmark except for bonds. The currentyield on the bond index benchmark(s) is usually used as the forecast for bond returns. The Bloomberg Barclay Aggregate is most favored as the bond index benchmark. This index was designed at Lehman Bros. by Ron Ryan when he was the head of Fixed Income Research & Strategy from 1977 to 1983. The Aggregate is a very large and diversified portfolio of bonds with the following summary statistics as of March 31, 2025:
| # of issues | 13,770 | Treasury | 44.79% | AAA | 3.06% |
| YTM | 4.51% | Agency | 1.29% | AA | 47.86% |
| Duration | 6.08 yrs. | Mtg. Backed | 24.85% | A | 11.38% |
| Avg. Maturity | 8.38 yrs. | Corporates | 24.06% | BBB | 11.43% |
| NR | 25.60% |
As a result, most asset allocation models would have a ROA for bonds of about 4.50%. If you can build a bond portfolio that outyields the Aggregate index, by definition, it should enhance the ROA for total assets. Ryan ALM Advisers, LLC has created a cash flow matching product we call the Liability Beta Portfolio™ (LBP). The LBP is a cost optimization model that cash flow matches liability cash flows chronologically at the lowest cost from a corporate bond portfolio skewed to A/BBB bonds. Based on the actuarial projections of each client we initially build a Custom Liability Index (CLI) to calculate net liabilities ((benefits + expenses) – contributions) chronologically. The CLI provides all the data needed for the LBP to function efficiently. Based on the allocation to the LBP will determine how far out the LBP can fully fund net liabilities. Usually, a 15% allocation to the LBP can fund 1-7 or even 1-10 years of net liabilities. The longer the term structure of the LBP, the higher the yield. The LBP will roughly outyield the Aggregate index by 50 bps (1-5 years) to over 100 bps (1-10 years) based on the LBP term structure. If the LBP outyields the AGG index by 50 to 100 bps, asset allocation can afford to overweight the bond allocation and still meet the target ROA for total assets. A 15% allocation to LBP is 7.5 to 15 bps value added to the ROA.
3.Cash – many pension plans have a cash allocation of around 2%+. Cash is usually the lowest yielding asset. Since the LBP becomes the liquidity assets to fully fund benefits + expenses chronologically, there is little need for cash to fund B+E. Cash might only be needed for capital calls on Private Equity and Alternative Investments. The LBP should significantly increase the yield margin versus cash since the LBP is using A/BBB+ coupon income from all maturities of the LBP. With the LBP fully funding B+E, the cash allocation can be reduced to <1%. Replacing most of the cash allocation to fund B+E with the LBP allocation is another ROA enhancement… it all adds up.