
Ryan ALM
White Papers
Browse
Cash Flow Matching Overview
Cash Flow Matching Pension Objective Fund benefits in a cost-efficient manner with prudent risk Pension Needs Liquidity to fund benefits Reduce Contribution costs Reduce Volatility of Funded Status Strategy Value...
Source: Cash Flow Matching Overview
| Pension Objective | Fund benefits in a cost-efficient manner with prudent risk | ||||||||||||||||
| Pension Needs |
Liquidity to fund benefits Reduce Contribution costs Reduce Volatility of Funded Status |
||||||||||||||||
| Strategy | Cash flow match liability cash flows (benefits + expenses) | ||||||||||||||||
| Value in Bonds |
Certainty of cash flows (only asset class with such value) Maturity selection = yield curve (term structure) Cash flows every month as portfolio |
||||||||||||||||
| Methodology |
Ryan ALM creates a Custom Liability Index (CLI)
Ryan ALM creates Liability Beta Portfolio (LBP)
|
||||||||||||||||
| LBP Benefits |
Fully funds B+E and secures benefits with certainty
Reduces funding costs by 2% per year (1-10 years = 20%)Eliminates cash sweep of growth assets (Alpha assets) Buys time for Alpha assets to grow unencumbered Reduces volatility of funded ratio/status Outyields liabilities creating alpha Enhances funded status and ROA Reduces Contribution costs Mitigates interest rate risk Hedges pension inflation Low fee |
||||||||||||||||
| Note: |
LBP does not change any accounting, actuarial and asset allocation (AA) actions. LBP is a less risky & less costly alternative to active bond management. LBP is a best fit to the true pension objective. |
||||||||||||||||
| Interest Rate Risk (IRR) |
Biggest and dominant risk on bonds present values (PV) Benefits + expenses = future values (FV) B+E are not interest rate sensitive LBP funds Benefits + Expenses LBP mitigates IRR |
||||||||||||||||
| Pension Inflation |
Actuarial projections unique to each pension plan Inflation assumptions =/= CPI |
||||||||||||||||
| Generic Bond Indexes |
Not a proper benchmark Do not represent pension liabilities Liabilities are like snowflakes, unique to each plan sponsor Only a Custom Liability Index could measure/monitor liabilities |
||||||||||||||||
| Value Added |
Ryan ALM offers clients a series of synergistic values:
|
||||||||||||||||
| Awards |
Gold Medal Winner – The U.S. Pension Crisis book of the year Bernstein, Fabozzi, Jacob Levy – Research Paper of the year William F. Sharpe Index Lifetime Achievement Money Management Letter Lifetime Achievement Capital Link – Most Innovative ETF IMN - ETF of the year |
How To Hedge Interest Rate Risk
Pension funds are faced with numerous risk factors. Perhaps, the greatest risk factor is Interest rate risk. If affects assets but especially liabilities. How pensions cope with Interest rate risk...
Source: How To Hedge Interest Rate Risk
Pension funds are faced with numerous risk factors. Perhaps, the greatest risk factor is Interest rate risk. If affects assets but especially liabilities. How pensions cope with Interest rate risk could determine the funded status and solvency of the plan.
The funded ratio of a pension is assets / liabilities based on either market value or actuarial valuations. The funded status is assets - liabilities with the same valuations. This funded ratio/status determines the contribution costs of a plan, amortizations, actuarial gains/losses and perhaps, affects credit ratings. The funded ratio and status are both based on present value calculations and valuations. As a result, how the present value of pension assets are calculated plays a major role In the funded ratio/status situation.
Assets
There are numerous assets that are interest rate sensitive such as: ABS, bank loans, bonds, cash equivalents, CLOs, CMBS, CMOs, derivatives, futures, mortgage-backed securities, municipal bonds, Private Debt, REITs, etc. . Since Interest rates are never static, their volatility affects the funded ratio/status of the pension plan. This could be good or bad but most pensions do not want volatility on these critical calculations. As a result, many pensions, especially corporate plans, invest in hedging strategies to reduce or Immunize this volatility. These strategies can be quite sophisticated but all come at an extra cost and new risk factors.
Derivatives such as interest rate swaps and futures are contracts which have no cash flow certainty or exact funds available to make the liability cash flow payments. They are hedges vs. the liability growth rate. In fact, these strategies introduce more risk: counter party risk, interest rate risk, non-matching risk of assets purchased (usually equities) vs. liabilities and leverage. In addition, interest rate swaps and futures have all of the problems associated with a liability proxy data gathering… as with duration matching. For example, where do you get the average duration of liabilities? Most, if not all, actuarial reports do not provide this calculation. Moreover, they do not provide the projected liability benefit payment schedule which you would need to calculate duration. In addition, actuarial reports are annual reports usually months delinquent so there would be serious delayed information. The duration calculation is at a precise moment in time… like a balance sheet. As time and interest rates change… so will duration. Only A Custom Liability Index (CLI) priced at market rates and based on each pension’s unique liability benefit payment schedule could provide an accurate and current duration profile. Any difference in yield creates a difference in the calculation of duration and liability growth rates.
A common proxy for the average duration of liabilities is to use a generic bond market index… usually the Bloomberg Barclay’s long corporate index. Such a proxy creates several erroneous data issues. This index has no bonds shorter than 10 years and no durations longer than 17 years. This certainly does not represent any pension liability schedule even if the average durations were similar.
Accounting standards and actuarial practices price liabilities as a portfolio of zero-coupon bonds with a single average discount rate based on the present value of this zero-coupon liability portfolio. Note… there are no generic bond indexes that use zero-coupon bonds as their portfolio. Moreover, there are no generic bond indexes that use any of the required pension accounting discount rates… they use market rates! Every pension plan’s liabilities are different and unique to that plan due to different labor force, salaries, mortality, and plan amendments. There is no way any generic bond market index could represent any pension plan liability term structure.
Liabilities
Liabilities are bond like valuations since their present value is calculated the same way you calculate the present value of bonds. Indeed, FASB and GASB accounting rules require that you price liabilities as if they were zero-coupon bonds. This makes liabilities extremely interest rate sensitive. The longer the average life or duration of liabilities the greater the interest rate risk and present value volatility. Since the duration of liabilities changes with interest rates (discount rates) this calculation needs to be refreshed and updated on a frequent and accurate basis. According to ASC 715 accounting rules (formerly FAS 158) liabilities are to be priced as a high-quality zero-coupon bond yield curve. FASB accepts AA corporates as the interest rates in compliance. Since corporate zeroes do not exist in the market-place, such discount rates are hypothetical interest rates. Ryan ALM is one of few vendors who supply the ASC 715 discount rates. Price Waterhouse Coopers (PWC) has been our major client since FAS 158 became effective in 2008 (now ASC 715). Our discount rates are consistently higher than most vendors providing clients with a lower present value of their pension liabilities thereby enhancing the balance sheet.
GASB accounting rules allow for liabilities to be priced at a single discount rate equal to the assumed ROA. Such divergence in discount rates between FASB and GASB creates much confusion and conflicts but don’t disagree as to the fact that liabilities are assumed to be priced as and behave as zero-coupon bonds.
Liabilities are a term structure of projected benefits. This becomes a tough job for actuaries to calculate annually so it takes some time. Usually, actuarial reports come out months after the end of the fiscal year (around six months for Public plans). Asset managers need fresh and continuous data to do their job. For asset/liability management (ALM) monthly or even daily updates are critical. Since duration and interest rates change daily, liabilities are certainly dynamic structures requiring constant attention. Without a Custom Liability Index (CLI) it would be hard, if not impossible, for a plan sponsor, its asset managers and consultant to understand the risk/reward behavior and interest rate sensitivity of their liabilities.
Solution: Cash Flow Match Benefits
The funded ratio/status and performance measurement of assets vs. liabilities are all based on present value measurements. This has led to a tower of babel on what is the proper discount rate, funded status, index benchmark, duration calculation, etc. The solution lies in cash flow matching projected benefits… future value projections. The goal of a pension is to secure benefits in a cost-effective manner. Benefits are future value numbers. They have little, if any, interest rate sensitivity. A $100 million benefit payment in 2030 is $100 million whether interest rates go up or down. It is a static non-interest rate sensitive calculation. So it follows… that the best way to hedge interest rate risk is to hedge future values by cash flow matching projected benefits with bonds. Bonds have been used historically to match benefits (i.e. defeasance, dedication, immunization) since they may be the only asset class with certainty of cash flows or future values.
Since benefit payments are future values (FV) suggests that the future value of assets vs. the future value of liabilities is the most critical evaluation. But most asset classes are difficult to ascertain their future value. Only bonds (and insurance annuities) have a known future value and have historically been used to cash flow match liabilities (i.e. defeasance, dedication, buy-out annuities). To prove my point as to the potential misinformation with using a PV calculation, let’s use a simple example below. Two pensions both at $1.0 billion market value would have the same funded ratio in PV$. But pension B is 100% invested in corporate bonds that out-yield pension A (100% invested in Treasuries) by 150 bps per year. Certainly, plan B has a much greater future value (@ 24% higher) and funded status if we used future values. This suggests that the funded ratio and funded status are not that accurate or even good indicators of the true economic solvency:
| Pension | Composition | YTM | PV | FV |
|---|---|---|---|---|
| A | 100% Treasuries | 2.00% | $1.0 billion | $1.35 billion |
| B | 100% Corporates | 3.50% | $1.0 billion | $1.68 billion |
The point of all this is… that we need to focus more on the FV of assets vs. liabilities. If we value liabilities at market rates, they would have discount rates of AA corporates (FASB method) or even better U.S. Treasury STRIPS (defeasance method). A corporate bond portfolio matched to liabilities that is skewed to A/BBB securities would out-yield liabilities and would enhance the funded status on a future value basis thereby reducing funding costs and also mitigate interest rate risk. This is why “cash flow matching” of liability future values is the most prudent risk and lowest cost methodology to de-risking a pension through asset liability management (ALM). It secures the benefits in a cost-efficient manner while neutralizing interest rate risk.
The Risk/Reward of Bonds
Unlike any other asset class, fixed income (bonds) has two risk/reward values: Total Return Certain Cash Flows Total Return Value The total return value in bonds is the converse of...
Source: The Risk/Reward of Bonds
Unlike any other asset class, fixed income (bonds) has two risk/reward values:
Total Return
Certain Cash Flows
Total Return Value
The total return value in bonds is the converse of interest rate movements. When rates go down, as they have from 1981 to 2021, they produce price appreciation and higher total returns. And the opposite happens (negative price returns) when rates go up as they did from 1953 to 1981.
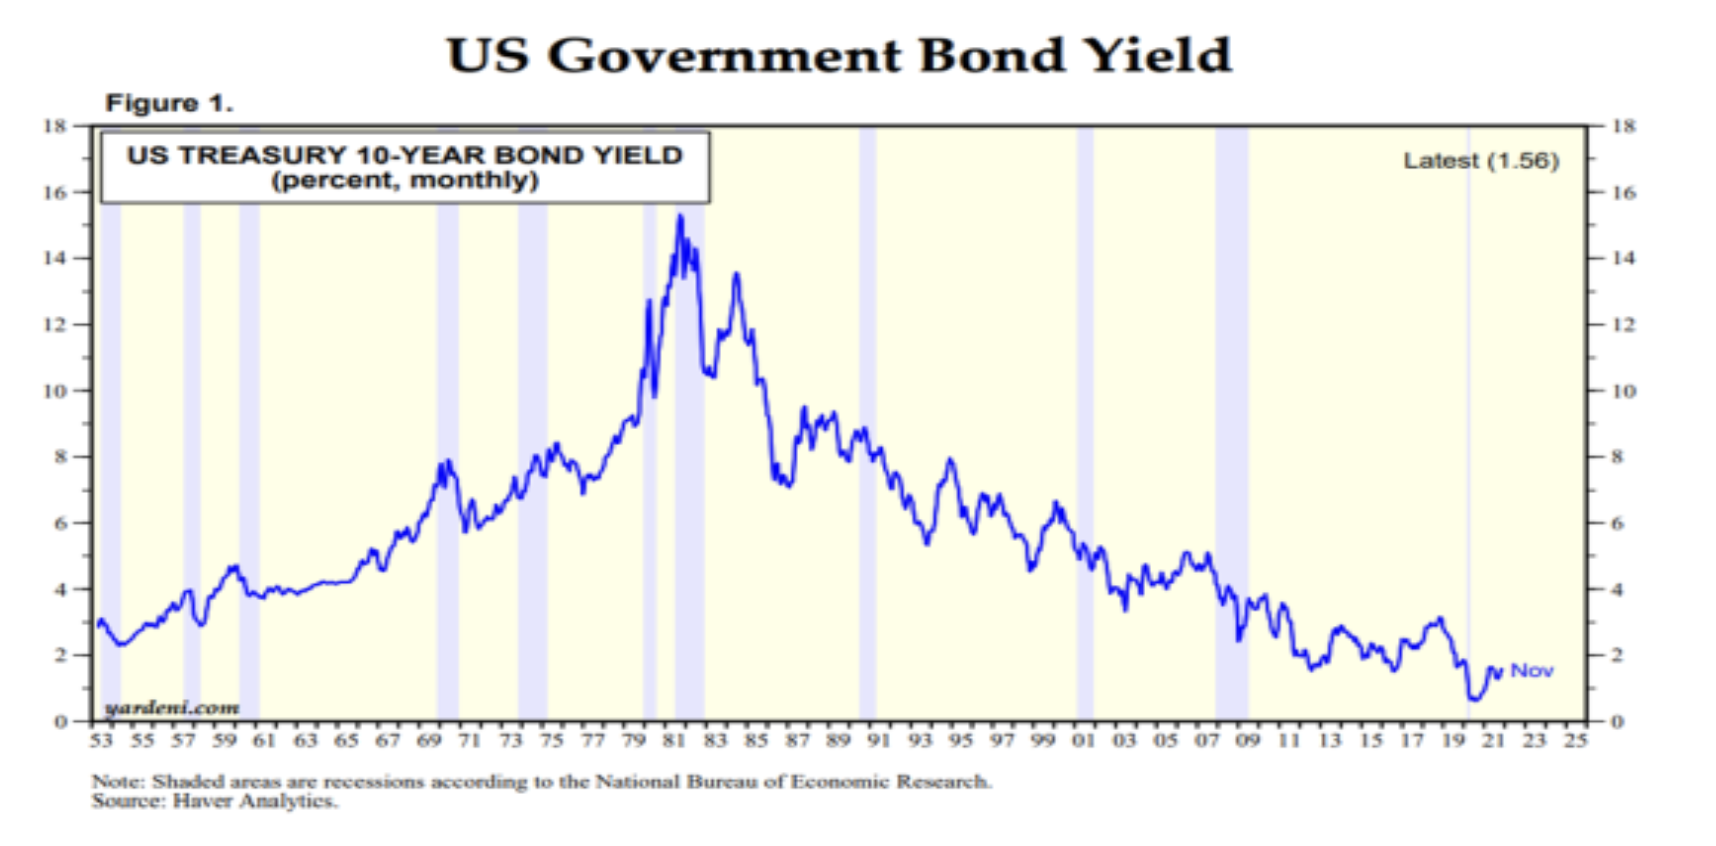
Since the start of 2022, interest rates have trended upward causing negative bond returns (BB Aggregate Index -3.25% YTD thru 02/28/22). Given the current inflation rate of over 7.0% on the CPI and over 9.0% for the PPI, coupled with the expectation that the Fed will raise short rates several times this year… this interest rate trend to higher rates should continue. As a result, pensions should expect negative fixed income returns this year and for the foreseeable future.
Certain Cash Flow Value
If you buy bonds for their intrinsic value (certainty of cash flows) you will immunize or mitigate interest rate risk! Since cash flows are future values, they are not affected by interest rate movements.Moreover, any excess cash flow reinvested will be able to buy new cash flows at reduced costs. This is truly the value in bonds and we strongly recommend that pensions use bonds as their liquidity or Beta assets. Let the performance or Alpha assets be the non-bond assets. Use bonds to cash flow match pension benefits and expenses chronologically. This synergy of Beta and Alpha assets should secure benefits, reduce funding costs, and buy time for the Alpha assets to grow unencumbered.
Cash flow matching by any name (defeasance, dedication, immunization) may be the oldest fixed-income strategy. It should be the core portfolio of a pension and the fixed income strategy chosen by pensions today given the likelihood of higher interest rates. Cash flow matching will secure benefits in a cost-efficient manner. The Ryan ALM cash flow matching product (Liability Beta Portfolio™) will reduce funding costs by about 1% per year of matching (i.e. 1-10 years = 10% funding cost reduction).
With the stock market struggling this year (S&P 500 -10.7% YTD thru 03/07/22), a cash flow matching bond allocation will buy time for the equity allocation to recover without any dilution to fund benefits and expenses. Let bonds be the liquidity assets to fund benefits + expenses. Let the growth assets grow unencumbered without any dilution. History tells us that 48% of the S&P 500 returns on a rolling 10-year basis come from dividends reinvested.
Pension Solutions Series Part 2 - Liability Beta Portfolio™ (LBP)
Pension Solution: Liability Beta Portfolio™ (LBP) The primary pension objective is to secure promised benefits (Retired Lives) in a cost- effective manner (stable to lower contribution costs) with prudent risk...
Source: Pension Solutions Series Part 2 - Liability Beta Portfolio™ (LBP)
Pension Solution: Liability Beta Portfolio™ (LBP)
The primary pension objective is to secure promised benefits (Retired Lives) in a cost-effective manner (stable to lower contribution costs) with prudent risk. This is best accomplished through cash flow matching.
Cash Flow Matching
Since benefits (liabilities) are future value numbers, it is consistent and necessary to match the future value of assets to the future value of liabilities. This is better said as cash flow matching asset cash flows to liability cash flows… cash flow driven investments (CDI). Since bonds are the only asset class with a known future value, it has been the obvious choice to cash flow match liabilities. Indeed, this is the true value of fixed income assets. In truth,cash flow matching the liability benefit payment schedule (liability cash flow) isthe ideal way to de-risk a pension plan. Since projected benefits (future values) are not interest rate sensitive, cash flow matching projected benefits eliminates the biggest risk in bonds… interest rate sensitivity.
Since contributions are the initial source to fund liabilities, current assets fund net liabilities (benefits – contributions). It is critical that current assets know what they are funding… net liabilities! Fixed income assets are best cash flow managed versus Retired Lives, which are the most certain and imminent liabilities. Active Lives tend to be the most uncertain cash flows (actuarial noise). Matching Retired Lives net liabilities chronologically is wise and recommended as it not only secures benefits over a certain time horizon, it buys time for the non-bond assets (Alpha assets) to perform and outgrow Active Lives liabilities. It would not be prudent to use volatile, risky assets to fund the shorter Retired Lives liabilities… too uncertain.
Ryan ALM has developed a cash flow matching model called the Liability Beta Portfolio™ (LBP). Our LBP is a cost optimization model that matches and funds Retired Lives monthly benefit payments chronologically at the lowest cost to the plan sponsor. Our LBP should reduce funding costs by 8% to 10% vs. 1-10 years Retired Lives. The true value in bonds is the certainty of their cash flows. We urge plan sponsors to transfer current active fixed income management from generic index benchmarks to our LBP to de-risk the plan gradually and reduce costs.
Asset Allocation
Asset allocation would be wise to separate Retired Lives from Active Lives and liability Beta assets from liability Alpha assets. We recommend using bonds cash flow matched to Retired Lives chronologically as the liability Beta assets and use Alpha assets (risky assets) for the Active Lives. The funded ratio should dictate the allocation to bonds. The higher the funded ratio: the higher the allocation to liability Beta assets. The pension plan’s current allocation to bonds should determine how much of the net liabilities bonds can cash flow match (i.e. 15% bond allocation might fund the next seven to 10-years of Net Retired Lives). By switching from traditional bond management and generic bond indexes to a Custom Liability Index coupled with a Liability Beta Portfolio will produce many benefits to the pension plan:
1. Reduce Funding Costs
The Liability Beta Portfolio should be the core portfolio since it best represents the true pension objective… securing benefits in a cost-effective manner. Our LBP will reduce funding costs by 8% to 10% in funding 1-10 years of Retired Lives. The true quest of any pension or liability driven objective is to reach and maintain a fully funded liability cash flow matched asset position. This can only be achieved with a cash flow matching bond portfolio. Any other asset class does not match the behavior of liabilities and creates the roller coaster effect of victories (surplus) and losses (deficits).
2. Reduces Volatility in Funded Ratio
If you match liabilities then you match the risk/reward behavior of the present value of liabilities. This eliminates the roller coaster effect that most plans have in their Funded Ratio due to a mismatching of assets vs. liabilities. This erratic growth difference between assets vs. liabilities plays havoc with budgets (i.e. Contributions), benefit decisions and financial statements.
3. Reduces Contribution Volatility and Cost
If you match liabilities then the funded ratio is less volatile which in turns means that contribution costs become less volatile. Our LBP will also outyield liabilities thereby creating some Alpha which will reduce Contribution costs.
4. Reduces Interest Rate Risk
Benefit payments are future value amounts which are not interest rate sensitive. By cash flow matching future values, we have neutralized interest rate risk.
5. Reduces Bond Asset Management Fees
The Ryan ALM Liability Beta Portfolio (LBP) has a low fee which should save clients about 50% on bond asset management fees.
6. Buys Time for Alpha assets
The LBP will match and fund Retired Lives chronologically. If the LBP funds 1-10 years of Retired Lives it buys 10-years of time for the Alpha assets to grow and perform. History tells us that risky assets do better the more time you give them to perform.