
Ryan ALM
White Papers
How Bonds Can Enhance the ROA
Given the volatility and uncertainty of the financial markets, bonds can provide Pension Plan Sponsors a strategy to mitigate some of that volatility. Bonds, through the certainty of their cash...
Source: How Bonds Can Enhance the ROA
Given the volatility and uncertainty of the financial markets, bonds can provide Pension Plan Sponsors a strategy to mitigate some of that volatility. Bonds, through the certainty of their cash flows, prove to be a very effective tool. Most pensions focus on earning the return on asset (ROA) assumption as the goal of asset allocation. Because bonds yield less today than the ROA (7.00% average) the asset allocation to bonds tends to be lower than historic norms. But there exists a bond allocation that could enhance the probability of achieving the ROA. Here’s how:
Cash Flow Matching – if bonds were used to cash flow match and fund net liabilities (after contributions) chronologically they would produce the liquidity needed to fully fund such net liabilities. Cash flow matching works best with longer coupon bonds where you use semi-annual interest income to partially fund liabilities. A 10-year bond has 20 interest cash flows + one principal cash flowall priced at a 10-year yield. Having this liquidity wouldeliminate the need to do a cash sweep from other asset classes which is a common liquidity procedure. According to Guinness Global, the S&P 500 has 47% of its historical returns from dividends and reinvestment since 1940 on a 10-year rolling period basis. Wouldn’t you want to reinvest dividends back into growth assets rather than spend it on funding benefits + expenses? By using bonds as the liquidity assets, the growth assets are left unencumbered to grow. The longer the cash flow matching period, the more time the growth assets have to compound their growth. This strategy and practice could significantly enhance the ROA.
Yield on Bonds – the asset allocation models forecast the return of each asset class in the model, then weight each asset class to get the derived ROA for total assets. The ROA for most asset classes is based on the historical returns of each asset class index benchmark except for bonds. The currentyield on the bond index benchmark(s) is usually used as the forecast for bond returns. The Bloomberg Barclay Aggregate is most favored as the bond index benchmark. This index was designed at Lehman Bros. by Ron Ryan when he was the head of Fixed Income Research & Strategy from 1977 to 1983. The Aggregate is a very large and diversified portfolio of bonds with the following summary statistics as of March 31, 2025:
| # of issues | 13,770 | Treasury | 44.79% | AAA | 3.06% |
| YTM | 4.51% | Agency | 1.29% | AA | 47.86% |
| Duration | 6.08 yrs. | Mtg. Backed | 24.85% | A | 11.38% |
| Avg. Maturity | 8.38 yrs. | Corporates | 24.06% | BBB | 11.43% |
| NR | 25.60% |
As a result, most asset allocation models would have a ROA for bonds of about 4.50%. If you can build a bond portfolio that outyields the Aggregate index, by definition, it should enhance the ROA for total assets. Ryan ALM Advisers, LLC has created a cash flow matching product we call the Liability Beta Portfolio™ (LBP). The LBP is a cost optimization model that cash flow matches liability cash flows chronologically at the lowest cost from a corporate bond portfolio skewed to A/BBB bonds. Based on the actuarial projections of each client we initially build a Custom Liability Index (CLI) to calculate net liabilities ((benefits + expenses) – contributions) chronologically. The CLI provides all the data needed for the LBP to function efficiently. Based on the allocation to the LBP will determine how far out the LBP can fully fund net liabilities. Usually, a 15% allocation to the LBP can fund 1-7 or even 1-10 years of net liabilities. The longer the term structure of the LBP, the higher the yield. The LBP will roughly outyield the Aggregate index by 50 bps (1-5 years) to over 100 bps (1-10 years) based on the LBP term structure. If the LBP outyields the AGG index by 50 to 100 bps, asset allocation can afford to overweight the bond allocation and still meet the target ROA for total assets. A 15% allocation to LBP is 7.5 to 15 bps value added to the ROA.
3.Cash – many pension plans have a cash allocation of around 2%+. Cash is usually the lowest yielding asset. Since the LBP becomes the liquidity assets to fully fund benefits + expenses chronologically, there is little need for cash to fund B+E. Cash might only be needed for capital calls on Private Equity and Alternative Investments. The LBP should significantly increase the yield margin versus cash since the LBP is using A/BBB+ coupon income from all maturities of the LBP. With the LBP fully funding B+E, the cash allocation can be reduced to <1%. Replacing most of the cash allocation to fund B+E with the LBP allocation is another ROA enhancement… it all adds up.
Ryan ALM Pension Monitor 4Q’22
4Q 2022 Ryan ALM Pension Monitor (Through December 31, 2022) Pension plan liabilities need to be measured and monitored regularly. Without knowledge of plan liabilities, the allocation of plan assets...
Source: Ryan ALM Pension Monitor 4Q’22
(Through December 31, 2022)
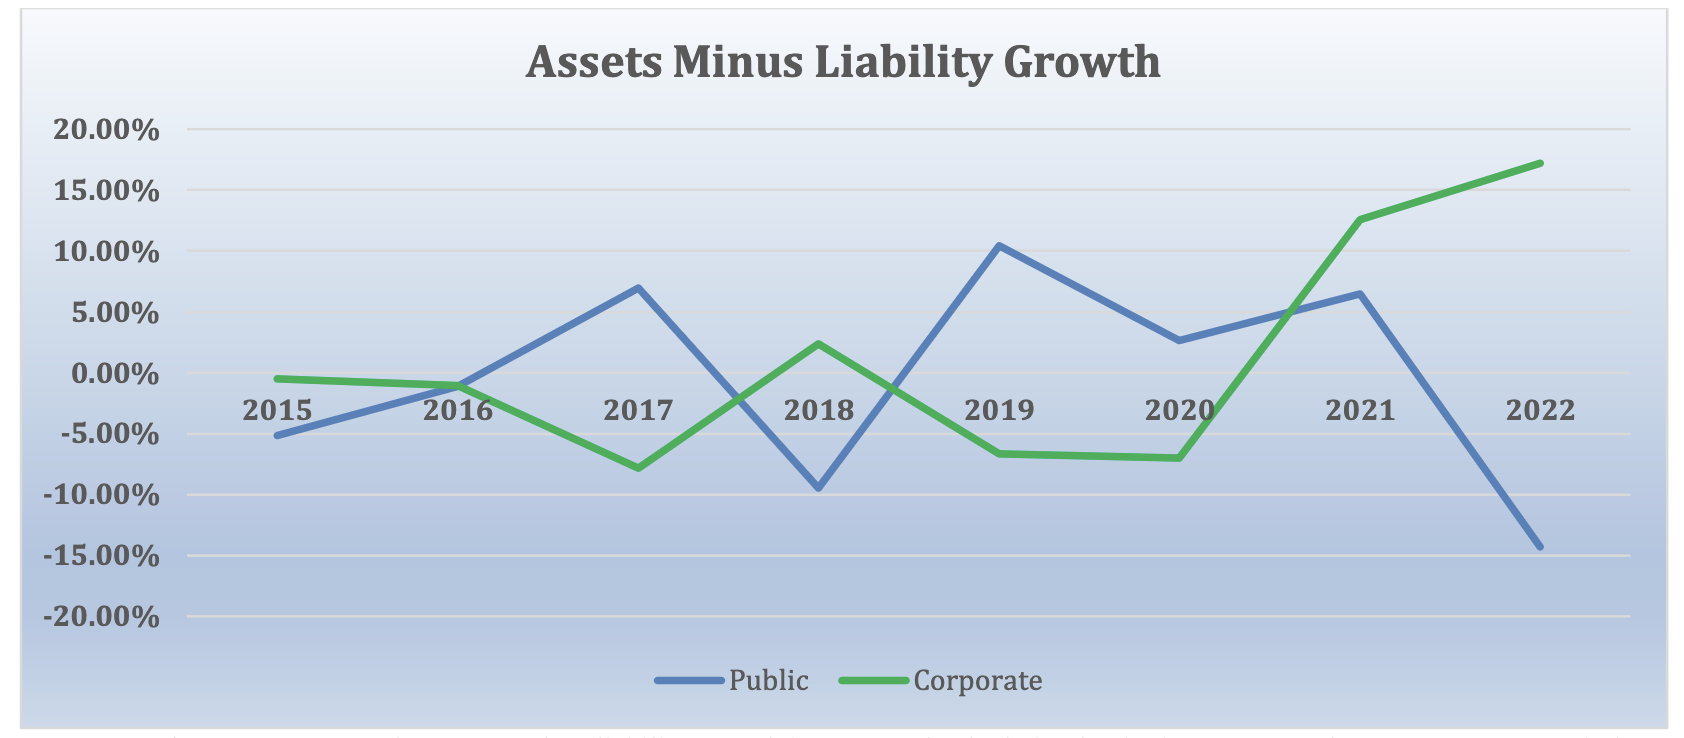
Pension plan liabilities need to be measured and monitored regularly. Without knowledge of plan liabilities, the allocation of plan assets cannot be done efficiently or appropriately. The funded ratio/status of pension plans are present value calculations. Each type of plan is governed by accounting rules and actuarial practices, which determine the discount rate used to calculate the present value of liabilities. Single employer corporate plans are under ASC 715 (FASB) discount rates (AA corporate zero-coupon yield curve); multiemployer plans and public plans use the ROA (return on asset assumption) as the liability discount rate. The difference in liability growth between these plans can be quite significant (see 2022), which will affect funded status and contribution levels.
The table below compares these different liability growth rates (based on a 12-year average duration) versus the asset growth rate based on the P&I asset allocation survey of the top 1,000 plans which is updated each year. The graph below shows the contrasting annual differences of asset versus liability growth for corporate and public plans since 2015. The impact of different accounting rules is massive, and none greater than this year.
| ASSET ALLOCATION | YTD Return | Corporate | Public | Union |
|---|---|---|---|---|
|
Domestic Stock International Stock Global Equity Domestic Fixed Income Global Fixed Income Cash Private Equity Real Estate Equity* Other |
-18.1% -14.0% -18.0% -13.0% -18.3% 1.1% 12.0% 10.8% 10.3% |
11.1% 6.5% 10.4% 46.7% 1.3% 2.0% 8.5% 4.1% 9.4% |
24.4% 16.3% 5.3% 20.2% 1.7% 2.0% 12.7% 7.9% 9.5% |
24.7% 8.6% 11.4% 28.0% 0.9% 0.6% 8.2% 9.3% 8.3% |
| TOTAL ASSETS Growth Rate | -8.7% | -7.2% | -8.7% | |
| LIABILITIES Growth Rate | -26.6% | 7.0% | 7.3% | |
| Asset Growth – Liability Growth | 17.9% | -14.2% | -16.0% |
Index Benchmarks: Domestic Stock = S&P 500; Int’l Stock = EAFE, Global Equity = All Country World; Domestic Fixed Income = BB Aggregate; Global Fixed Income = FTSE World Gov’t (unhedged); Cash = Ryan ALM Cash Index; Private Equity =10-year return for the R2500 + 2%; *Real estate Equity =NFI-DP Index (delayed one month); Alternative Investments and Other = CPI-U & 3%.
Footnote: The measurement of asset growth to liability growth is an annual calculation beginning on December 31, 2015. For periods shorter than 1-year, the observation is a YTD calculation.
The question that must be asked: If two pension systems (one public and the other private) have similar asset allocations and are investing in the same markets, how is it possible that they have such meaningful differences in outcomes? These differences, caused by different reporting requirements, may distort contributions and funded status, and may influence benefit decisions unnecessarily.
Pension Solutions Series Part 3 - Asset Exhaustion Test (AET)
Pension Solution: Asset Exhaustion Test (AET) The primary pension objective is to secure promised benefits (Retired Lives) in a cost- effective manner (stable to lower contribution costs) with prudent risk...
Source: Pension Solutions Series Part 3 - Asset Exhaustion Test (AET)
Pension Solution: Asset Exhaustion Test (AET)
The primary pension objective is to secure promised benefits (Retired Lives) in a cost-effective manner (stable to lower contribution costs) with prudent risk. In our last Pension Solution blog, we explained that this is best accomplished through cash flow matching with fixed income… hopefully through our Liability Beta Portfolio™ (LBP). We recommend that our LBP should fund the first 10-years of NET Retired Lives (after Contributions). This buys time for the Alpha assets (performance assets) to grow without being diluted to fund any benefits. This leaves the residual liabilities to be monitored and funded through Alpha assets. As a result, the Alpha assets need to know their target ROA that will fully fund residual liabilities. This requires an Asset Exhaustion Test (AET).
Asset Exhaustion Test (AET)
GASB 67/68 requires an AET. We recommend this test for all pension plans. The AET requires projected contributions be subtracted from projected benefits to get a net liability schedule. The assets are then grown at an actuarial driven ROA to see if they fully fund these annual net liabilities. If the assets are exhausted, GASB requires the discount rate to be bifurcated and the area of future deficits to be discounted at the AA muni 20-year index rate. We have always recommended a market rate to discount all liabilities to calculate the true economic present value of liabilities so the economic funded status can be known. We also recommend that contributions be included as an asset or liability offset in the funded status calculation.
Ryan ALM modifies the GASB AET into a matrix that calculates the ROA needed to fully fund the net liabilities to be fully funded by the Alpha assets. Asset allocation needs to know its target ROA in order to function efficiently. A 5.27% ROA should have a different asset allocation than an 8.23% ROA. Since contributions are included in the ROA as an asset or liability offset, the calculated ROA is way lower than without contributions included. The point here is that assets need to know what their required hurdle rate is… or target ROA. Without this calculation, asset allocation is misaligned and may invite more risk into the equation than needed. A calculated ROA should be a requirement for asset allocation.
Ryan ALM, Inc. is an asset/liability manager specializing in cash flow matching thru a proprietary cost optimization model called the Liability Beta Portfolio™.
PPA Recommendation for Multiemployer Plans
Replace Active Bond Management with Liability Beta Portfolio
Reduce Asset Management Costs by 50%
Match Net Liabilities Chronologically
Reduces Funding Costs by 4%+
De-Risks the Plan Gradually
Buys Time for the Alpha assets to Outgrow Liabilities
Transfer Alpha Victories to LBP (Portable Alpha)
Stabilizes Funded Ratio + Funded Status