

Ryan ALM
White Papers
Pension Doctor: Specialist or Generalist?
Pension Doctor: Generalist or Specialist When a person gets sick or has an injurythey go see a doctor. Usually, they prefer to see a Specialist who is the recognized expert...
Source: Pension Doctor: Specialist or Generalist?
When a person gets sick or has an injurythey go see a doctor. Usually, they prefer to see a Specialist who is the recognized expert on the ailment they have rather than a Generalist who has less expertise related to this particular medical condition. Well, the same should be true for pensions. If a pension plan needs a certain strategy to help enhance (cure) the funded status, they call in a specialist for that strategy.
Given that the true objective of a pension is to fully fund benefits and expenses (liabilities) in a cost-efficient manner with prudent risk plan sponsors and their advisors should be dialing up a risk mitigation specialist, such as Ryan ALM. For more than 50 years, our cash flow matching (CFM) strategy is the best fit and proven strategy for the pension objective. CFM provides an accurate and timely match of monthly asset cash flows to fully fund monthly liability cash flows. The CFM is a portfolio of investment grade bonds. The intrinsic value in bonds is the certainty of their cash flows (only asset class with such certainty).
Bond math teaches us that the longer the maturity and the higher the yield… the lower the cost. The Ryan ALM cash flow matching product is a cost optimization model that fully funds monthly liability cash flows at a cost savings of about 2% per year in this interest rate environment. We call our CFM model the Liability Beta Portfolio (LBP). The LBP should be the core portfolio of any DB pension and replace active fixed income management, which is highly susceptible to changes in rates. By matching and funding liabilities chronologically, the LBP buys time for the Alpha or performance assets (non-bonds) to grow unencumbered. By working in harmony with the Alpha assets the plan can gradually enhance its funded status and stabilize contribution costs. There are numerous benefits to a CFM strategy:
No need for cash sweep as LBP provides the liquidity to fully fund liabilities
Secures benefits for time horizon LBP is funding (1-10 years)
Buys time for performance assets to grow unencumbered
Outyields active bond management… enhances ROA
Reduces Volatility of Funded Ratio/Status
Reduces Volatility of Contribution costs
Low Investment Advisory Cost = 15 bps
Reduces Funding costs (2% per year)
Mitigates Interest Rate Risk
We urge pensions to use CFM as the core portfolio strategy to achieve their true objective. To our knowledge Ryan ALM is the only firm that specializes in CFM… our only product.
When is a Pension Fully Funded?
The Funded Ratio tends to be the acid test and benchmark for funded status… but is it? We have written several research white papers (www. RyanALM/Research/White Papers) about the glaring...
Source: When is a Pension Fully Funded?
The Funded Ratio tends to be the acid test and benchmark for funded status… but is it? We have written several research white papers (www. RyanALM/Research/White Papers) about the glaring issues with the Funded Ratio. Here are just a few of the inconsistencies with the Funded Ratio:
Actuarial Value versus Market Value
The Funded Ratio (FR) of a pension is usually based on the actuarial value of assets / actuarial value of liabilities. The Funded Status (FS) is the actuarial value of assets – actuarial value of liabilities. Actuarial values are different than market values… sometimes quite different. Market values are the better measurement of economic reality since you can’t spend actuarial dollars. As a result, this valuation difference can seriously distort the FR and FS calculation.
Present Value versus Future Value
Notably, the FR and FS are present value calculations. But pension liability cash flows (benefits + expenses (B+E)) are future value (FV) projections. Since the FV of most assets is not known this becomes a true pension conundrum. Bonds are the only asset class with a known and certain future value. That is why bonds have been the chosen asset class for defeasance, immunization and cash flow matching for several decades. The disconnect between PVs and FVs haunts pensions. The true objective of a pension is to secure and fully fund liability cash flows in a cost-efficient manner with prudent risk. As a result, the objective should be for asset cash flows to match and fully fund liability cash flows.So, when is a pension fully funded... when asset cash flows (future values) fully fund liability cash flows (future values). This is best accomplished thru cash flow matching and is best measured by the Asset Exhaustion Test.
Contributions = MIA
The FR and FS both ignore contributions as an asset. The truth is that contributions are future assets and should be a high consideration in any asset liability management (ALM). We recommend using the Ryan ALM modified Asset Exhaustion Test (AET) as the best way to measure the solvency and funding status of a pension. We take asset cash flows (based on a ROA) and compare them to NET liability cash flows (benefits + expenses – contributions) to understand if assets can fully fund the liability cash flows. We use a matrix of ROAs to determine what ROA is the best fit. This calculated ROA is in sharp contrast to the current ROA that is based on an asset allocation model that ignores the FR and FS. It is common that a pension plan with a 60% funded ratio and another funded at 90% have the same or similar ROA. How is this possible? Shouldn’t the 60% funded plan need assets to work harder? Yes, but that does not have anything to do with the current ROA calculation. Whatever shortfall there is in asset cash flows to fund liability cash flows (B+E) must be paid by higher contributions… this is not in the best interests of a pension plan and the sponsor’s budget. Clearly, the current ROA is not a calculated return based on the FR and FS that will guarantee a fully funded
status if achieved long-term… nor will it guarantee that contributions will go down. This has been a sad and costly trend for the last 25+ years.
Discount Rates
A most troubling issue is what discount rate to use. FASB and GASB tend to disagree on this.
FASB = high quality AA corporate zero-coupon yield curve
GASB = ROA
Since the ROA is a much higher rate (usually 100 to 200 bps) then liabilities would be priced at a much lower PV (12% to 24%). This would enhance the FR by 8% to 22%. Market rates are best in determining the market or economic value of liabilities. FASB 144 says it well:
“The objective of selecting assumed discount rates is to measure the single amount that, if invested at the measurement date in a portfolio of high-quality debt instruments, would provide the necessary future cash flows to pay the pension benefits when due. Notionally, that single amount, the projected benefit obligation, would equal the current market value of a portfolio of high-quality zero coupon bonds whose maturity dates and amounts would be the same as the timing and amount of the expected future benefit payments. The determination of the assumed discount rate is separate from the determination of the expected rate of return on plan assets”
Ryan ALM Solutions:
Custom Liability Index (CLI): The first step in prudent pension management is to calculate the liability cash flows that assets must fund. This should be a net liability cash flow (benefits + expenses – contributions). Until liabilities are monitored and priced as a Custom Liability Index (CLI) the asset side is in jeopardy of managing to the wrong objectives (i.e. ROA and generic market indexes). Only a CLI best represents the unique liability cash flows of a plan sponsor. Just like snowflakes, no two pension liability schedules are alike due to different labor forces, salaries, mortality and plan amendments. How could a static ROA or genericmarket indexes ever properly represent the risk/reward behavior of such a diverse array of pension liabilities? Once the CLI is installed, the pension can now know the true economic Funded Ratio and Funded Status which should dictate the appropriate Asset Allocation, Asset Management and Performance Measurement.
Asset Exhaustion Test (AET): GASB requires a test of solvency (AET) to document that the asset cash flows (at the ROA) will fully fund the net liability cash flows (benefits + expenses – contributions). GASB correctly understands that assets are funding net liabilities after contributions… and that contributions are future assets. This net liability is rarely focused on by the asset side in asset allocation. Ryan ALM enhances the asset exhaustion test by calculating the ROA that will fully fund net liability cash flows. Usually, we find that a lower ROA can accomplish this goal and is a better fit than the current ROA. This would suggest a more conservative asset allocation and a heavier allocation to fixed income to defease liability cash flows chronologically. This is a common and serious issue. This calculated ROA should be the asset allocation model focus. We urge all pensions to incorporate this modified AET before acting on asset allocation.
Liability Beta Portfolio™ (LBP):The intrinsic value in bonds is the certainty of its cash flows. That is why bonds have been used for decades to defease liability cash flows. The core or Beta portfolio for a pension should be in investment grade bonds that cash flow match and fully fund liabilities chronologically thereby buying time for the growth (Alpha) assets to outgrow liabilities and erase the deficit. The proper Beta portfolio for any liability objective should be… a Liability Beta Portfolio™. Ryan ALM has developed a LBP which will cash flow match liabilities chronologically and reduce funding costs by about 2% per year (1-10 years = 20%) as well as reduce the volatility of the Funded Status and contribution costs. The LBP should be the core portfolio of any pension and replace active fixed income management. By matching and funding liabilities chronologically, the LBP buys time for the growth or Alpha assets (non-bonds) to perform. By working in harmony with the Alpha assets the plan can gradually enhance its funded status and reduce contribution costs.
Liability Alpha Assets: The non-bond assets should be managed vs. the CLI to exceed liability growth (earn liability Alpha) and enhance the economic Funded Status. The goal here is outgrow liabilities in $s (relative returns) by enough to erase the deficit over a time horizon equal to the average life (duration) of liabilities (calculated by the CLI). As the Alpha assets achieve the required annual Alpha, any excess returns vs. liability growth should be ported over to the Liability Beta Portfolio™ to secure the victory. Had this been in place during the decade of the 1990s when pensions had surpluses… there would be no pension deficits today.
Pension Conundrum: Same or Similar ROA
The Funded Ratio (FR) of a pension is usually based on the actuarial value of assets / actuarial value of liabilities. The Funded Status (FS) is the actuarial value of...
Source: Pension Conundrum: Same or Similar ROA
The Funded Ratio (FR) of a pension is usually based on the actuarial value of assets / actuarial value of liabilities. The Funded Status (FS) is the actuarial value of assets – actuarial value of liabilities. Actuarial values are different than market values… sometimes quite different. Notably, the FR and FS are present value calculations. But pension liability cash flows (benefits + expenses (B+E)) are future value (FV) projections. The disconnect between PVs and FVs haunts pensions. We have written several research papers about this glaring issue.
The return on assets (ROA) assumption is not based on the funded ratio or funded status. Instead, it is based on the expected return from the pension plan’s asset allocation. The same or similar asset allocation will produce the same or similar ROA focus. This brings up the question from my title – how could 60% and 90% pension funded plans have the same ROA? Shouldn’t the 60% funded plan require assets to work harder? Yes, but that does not have anything to do with the ROA calculation. Whatever shortfall there is in asset cash flows to fund liability cash flows (B+E) must be paid through higher contributions. As a result, the ROA is not a calculated return that will guarantee a fully funded status if achieved long-term… nor will it guarantee that contributions will go down.
Ryan ALM Solutions:
Custom Liability Index (CLI): The first step in prudent pension management is to calculate the liability cash flows that assets must fund. This should be a net liability cash flow (benefits + expenses – contributions). Until liabilities are monitored and priced as a Custom Liability Index (CLI) the asset side is in jeopardy of managing to the wrong objectives (i.e. ROA and generic market indexes). Only a CLI best represents the unique liability cash flows of a pension plan. Just like snowflakes, no two pension liability schedules are alike due to different labor forces, salaries, mortality and plan amendments. How could a static ROA or genericmarket indexes ever properly represent the risk/reward behavior of such a diverse array of pension liabilities? Once the CLI is installed, the pension fund will now know the true economic Funded Ratio and Funded Status, which should dictate the appropriate Asset Allocation, Asset Management, and Performance Measurement.
Asset Exhaustion Test (AET): GASB requires a test of solvency (asset exhaustion test) to document that the asset cash flows (at the ROA) will fully fund the net liability cash flows (benefits + expenses – contributions). GASB correctly understands that assets are funding net liabilities after contributions… and that contributions are future assets. This net liability is rarely shown or focused on by the asset side in asset allocation. Ryan ALM enhances the asset exhaustion test by calculating the ROA that will fully fund net liability cash flows. Usually, we find that a lower ROA can accomplish this goal than the current ROA target. This would support a more conservative asset allocation and a heavier allocation to fixed income to defease liability cash flows chronologically. This is a common and serious issue. This calculated ROA should drive asset allocation decisions. We urge all pensions to incorporate the AET before acting on asset allocation.
Liability Beta Portfolio™ (LBP):The intrinsic value in bonds is the certainty of its cash flows. That is why bonds have been used for decades to defease liability cash flows. The core or Beta portfolio for a pension should be in investment grade bonds that cash flow match and fully fund liabilities chronologically thereby buying time for the growth assets to outgrow liabilities and erase the deficit. The proper Beta portfolio for any liability objective should be… a Liability Beta Portfolio™. Ryan ALM has developed an LBP which will cash flow match liabilities chronologically and reduce funding costs by about 2% per year (1-10 years = 20%), as well as reduce the volatility of the Funded Status and contribution costs. The LBP should be the core portfolio of any pension fund and replace active fixed income management, which is subject to great interest rate risk. By matching and funding liabilities chronologically, the LBP buys time for the growth or Alpha assets (non-bonds) to perform. By working in harmony with the Alpha assets the plan can gradually enhance its funded status and reduce contribution costs.
Liability Alpha Assets: The non-bond assets are managed vs. the CLI to exceed liability growth (earn liability Alpha) and enhance the economic Funded Status. The goal here is outgrow liabilities in $s (relative returns) by enough to erase the deficit over a time horizon equal to the average life (duration) of liabilities (calculated by the CLI). As the Alpha assets achieve the required annual Alpha, any excess returns versus liability growth should be ported over to the Liability Beta Portfolio™ to secure the victory. Had this been in place during the decade of the 1990s when pensions had surpluses… there would be no pension deficits today.
What’s It All About? Liabilities!
Most institutional assets are required to fund some type of liability objective (Pensions, OPEB, Lottery, Endowment & Foundation) yet liabilities tend to be missing in every function related to assets:...
Source: What’s It All About? Liabilities!
Most institutional assets are required to fund some type of liability objective (Pensions, OPEB, Lottery, Endowment & Foundation) yet liabilities tend to be missing in every function related to assets:
Asset Allocation – is focused on achieving an absolute rate of return (ROA) which has nothing to do with a liability objective. The proof: how could a 60% and a 90% funded pension plan have the same or similar ROA? Wouldn’t the 60% funded plan have to work harder? This common focus is really assets versus assets (as measured by some index benchmarks) and not assets versus liabilities.
Asset Management – most asset classes are given some generic index benchmark as their return focus. Obviously no generic index could ever represent the unique liability cash flows of each client.
Performance Measurement – once again we have assets versus assets (generic index benchmarks). If an asset class outperforms its generic index benchmark does that mean assets have outgrown liability growth? Of course not! This is again a complete disconnect which plaques most institutional comparisons.
Solutions:
Ryan ALM has developed a turnkey system of products that are a best fit to achieving the true liability objective of institutions:
Custom Liability Index (CLI) – In 1991, the Ryan team developed the CLI as the proper benchmark for any liability objective. The CLI is a monthly report that calculates what liability cash flows assets must fund. For pensions, this is usually the net monthly liability cash flows (after contributions). The CLI is in harmony with clients’ actuarial projections since that is the data used to construct the CLI.
Liability Beta Portfolio™ (LBP) – The LBP is our proprietary cash flow matching (CFM) model which will fully fund monthly net liability cash flows at a low cost to our clients. Usually, the LBP will reduce funding costs by roughly 2% per year (20% for 1-10 years). Our LBP is a good fit as the liquidity assets so there is no need for a cash sweep that takes income from all asset classes to fund benefits + expenses (B+E). Since the LBP is focused on liability cash flows (future values or FV) it mitigates interest rate risk as well because FVs are not interest rate sensitive.
Performance Attribution Report (PAR) – Our proprietary PAR product provides 14 risk/reward calculations of the LBP versus the CLI, providing even more evidence of value added (in addition to cost savings + mitigation of interest rate risk) since our LBP should outyield and outgrow the CLI.
Asset Exhaustion Test (AET) – Our AET will calculate the true ROA needed to fully fund net liability cash flows. Quite often this calculated ROA is much lower than the current ROA used for asset allocation. Developing an AET should be a first step in the asset allocation process in determining the allocation to the liquidity bucket (LBP assets).
Observations:
The intrinsic value in bonds is the certainty of their cash flows. Bonds are the only asset class with certainty of their cash flows. That is why bonds have been the logical choice for Dedication and Defeasance using Cash Flow Matching (CFM) strategies since the 1970s. Only CFM is a best fit for any liability driven objective. The primary objective of a pension is to secure benefitsin a cost-efficient manner. Our CFM product (LBP) will secure and fully fund benefits by matching asset cash flows monthly versus liability cash flows. This matching process is done chronologically for as far out as the plan sponsor deems necessary.
Furthermore, it would be wise to separate liquidity assets (liability Beta assets) from growth assets (liability Alpha assets). The Beta assets should be the bond allocation to cash flow match the net liability cash flows (after contributions) chronologically for a target horizon. This will buy time for the risky assets (Alpha) to grow unencumbered since you have certainty of the Beta assets’ cash flows for as long a period as you want. A study of S&P data by Guinness Global highlights that dividends and dividends reinvested account for about 47% of the S&P 500 total return on rolling 10-year periods dating back to 1940 and 57% for 20-year horizons. So why would you want to dilute equity returns with a cash sweep? Since we are dealing with net liabilities (after contributions) a 15% LBP allocation may fund liabilities out to 10-years or more, especially given the higher U.S. interest rate environment.
Observations and Benefits of LBP:
No change in Cash and Bond allocation
No dilution of Alpha assets to fund B + E
Reduces funding costs by about 2% per year
Mitigates interest rate risk (funding future values)
Secures + fully funds monthly B+E chronologically
Eliminates the need for a cash sweep which dilutes equity returns
LBP will out yield current bond managers and enhance the ROA
Cash flow matching buys time for Alpha assets to grow unencumbered
Generic bond indexes cash flows look nothing like the projected benefit payment schedule
This leads to a mismatch of cash flows and risk/reward behaviors… serious issues over time
Alpha assets need time to perform without any dilution of their cash flows to pay benefits so they shouldn’t be a source of liquidity. Use CFM as the liquidity assets.
Logic:
Let the performance assets (Alpha assets) perform by growing unencumbered as the liquidity assets (Beta assets) provide cash flows sufficient to fully fund benefits plus expenses chronologically.
Bond Yields… Caveat Emptor
Most bonds are priced and traded on some yield calculation. These yield calculations are based on assumptions that are difficult, if not impossible, to achieve. For example: Yield to Maturity...
Source: Bond Yields… Caveat Emptor
Most bonds are priced and traded on some yield calculation. These yield calculations are based on assumptions that are difficult, if not impossible, to achieve. For example:
Yield to Maturity (YTM) assumes you will reinvest every six months at the purchase YTM until maturity of the bond. How could this happen? Yields are changing every day, and will you reinvest exactly every six months into the same maturity and same YTM? Sounds like Mission Impossible! In fact, the reinvestment rate on any bond is based on the total return of what you reinvested into. Yes, it is possible to have a negative reinvestment rate if you reinvested into a security with a negative total return. Moreover, the longer the bond maturity… the more the reinvestment rate of return determines the yield or return to maturity. In truth, the basic value of the YTM is to determine a price for the security.
All other yields (yield to call, yield to average life, yield to worst, etc.) are based on assumptions that are most difficult to occur, if not impossible. The intrinsic value of most bonds is the certainty of their cash flows. This is what the smart investor should focus on and utilize. Remove the uncertainty that is embedded in all bond yield calculations. Bonds are the only asset class with this certainty of their cash flows. That is why bonds have been the logical choice for Dedication and Defeasance using Cash Flow Matching (CFM) strategies since the 1970s. Only CFM is a best fit for any liability driven objective (Endowments & Foundations, Lotteries, Pensions, OPEB, etc.). The primary objective of a pension is to secure benefitsin a cost-efficient manner with prudent risk. CFM will secure and fully fund benefits by asset cash flows matching and fully funding monthly liability cash flows chronologically for as far out as the plan sponsor deems necessary.
We believe that a best practice is to separate liquidity assets (liability Beta assets) from growth assets (liability Alpha assets). The Beta assets should be the bond allocation to cash flow match the net liability cash flows (after contributions) chronologically for a target horizon (we recommend 10 years). This will provide the time for risky assets (Alpha) to grow unencumbered since you have the certainty of the Beta assets cash flows for as long a period as you want. It would also be wise to take the Cash and Fixed Income allocation and apply it to a CFM allocation. Several pension plans do a cash sweep of all assets’ income to fund the monthly benefits and expenses. A study of S&P 500 data by Guinness Global has determined that dividends and dividends reinvested account for about 47% of the S&P 500 total return on rolling 10-year periods and 57% for 20-year time horizons. So why would you want to dilute equity returns by spending the dividend income? Let the cash + bond allocation fund the current monthly liability cash flows through our CFM model (Liability Beta Portfolio™ or LBP). Our LBP would match and secure benefits chronologically for as far out as the allocation of funds allows. Since we are dealing with net liabilities (after contributions) a 15% LBP allocation may fund liabilities out to 10-years. The Ryan ALM cash flow matching model is well tested showing a funding cost savings of about 2% per year or more for longer maturity programs (20% for 1-10 years) depending on the liability term structure.
The Ryan ALM LBP model is funding benefits (future values) which are not interest rate sensitive. This eliminates the largest risk in bonds. Our LBP model will usually outyield active bond managers by over 50 bps, which will also reduce costs.
Observations and Benefits of LBP:
No change in Cash and Bond allocation
No dilution of Alpha assets to fund B + E
Reduces funding costs by about 2% per year
Mitigates interest rate risk (funding future values)
Secures + fully funds monthly B+E chronologically
Eliminates the need for a cash sweep which dilutes equity returns
LBP will out yield current bond managers and enhance the ROA
Cash flow matching buys time for Alpha assets to grow unencumbered
Logic
Let the performance assets (Alpha assets) perform by growing unencumbered as the liquidity assets (Beta assets) provide cash flow sufficient to fully fund benefits plus expenses chronologically.
How Bonds Can Enhance the ROA
Given the volatility and uncertainty of the financial markets, bonds can provide Pension Plan Sponsors a strategy to mitigate some of that volatility. Bonds, through the certainty of their cash...
Source: How Bonds Can Enhance the ROA
Given the volatility and uncertainty of the financial markets, bonds can provide Pension Plan Sponsors a strategy to mitigate some of that volatility. Bonds, through the certainty of their cash flows, prove to be a very effective tool. Most pensions focus on earning the return on asset (ROA) assumption as the goal of asset allocation. Because bonds yield less today than the ROA (7.00% average) the asset allocation to bonds tends to be lower than historic norms. But there exists a bond allocation that could enhance the probability of achieving the ROA. Here’s how:
Cash Flow Matching – if bonds were used to cash flow match and fund net liabilities (after contributions) chronologically they would produce the liquidity needed to fully fund such net liabilities. Cash flow matching works best with longer coupon bonds where you use semi-annual interest income to partially fund liabilities. A 10-year bond has 20 interest cash flows + one principal cash flowall priced at a 10-year yield. Having this liquidity wouldeliminate the need to do a cash sweep from other asset classes which is a common liquidity procedure. According to Guinness Global, the S&P 500 has 47% of its historical returns from dividends and reinvestment since 1940 on a 10-year rolling period basis. Wouldn’t you want to reinvest dividends back into growth assets rather than spend it on funding benefits + expenses? By using bonds as the liquidity assets, the growth assets are left unencumbered to grow. The longer the cash flow matching period, the more time the growth assets have to compound their growth. This strategy and practice could significantly enhance the ROA.
Yield on Bonds – the asset allocation models forecast the return of each asset class in the model, then weight each asset class to get the derived ROA for total assets. The ROA for most asset classes is based on the historical returns of each asset class index benchmark except for bonds. The currentyield on the bond index benchmark(s) is usually used as the forecast for bond returns. The Bloomberg Barclay Aggregate is most favored as the bond index benchmark. This index was designed at Lehman Bros. by Ron Ryan when he was the head of Fixed Income Research & Strategy from 1977 to 1983. The Aggregate is a very large and diversified portfolio of bonds with the following summary statistics as of March 31, 2025:
| # of issues | 13,770 | Treasury | 44.79% | AAA | 3.06% |
| YTM | 4.51% | Agency | 1.29% | AA | 47.86% |
| Duration | 6.08 yrs. | Mtg. Backed | 24.85% | A | 11.38% |
| Avg. Maturity | 8.38 yrs. | Corporates | 24.06% | BBB | 11.43% |
| NR | 25.60% |
As a result, most asset allocation models would have a ROA for bonds of about 4.50%. If you can build a bond portfolio that outyields the Aggregate index, by definition, it should enhance the ROA for total assets. Ryan ALM Advisers, LLC has created a cash flow matching product we call the Liability Beta Portfolio™ (LBP). The LBP is a cost optimization model that cash flow matches liability cash flows chronologically at the lowest cost from a corporate bond portfolio skewed to A/BBB bonds. Based on the actuarial projections of each client we initially build a Custom Liability Index (CLI) to calculate net liabilities ((benefits + expenses) – contributions) chronologically. The CLI provides all the data needed for the LBP to function efficiently. Based on the allocation to the LBP will determine how far out the LBP can fully fund net liabilities. Usually, a 15% allocation to the LBP can fund 1-7 or even 1-10 years of net liabilities. The longer the term structure of the LBP, the higher the yield. The LBP will roughly outyield the Aggregate index by 50 bps (1-5 years) to over 100 bps (1-10 years) based on the LBP term structure. If the LBP outyields the AGG index by 50 to 100 bps, asset allocation can afford to overweight the bond allocation and still meet the target ROA for total assets. A 15% allocation to LBP is 7.5 to 15 bps value added to the ROA.
3.Cash – many pension plans have a cash allocation of around 2%+. Cash is usually the lowest yielding asset. Since the LBP becomes the liquidity assets to fully fund benefits + expenses chronologically, there is little need for cash to fund B+E. Cash might only be needed for capital calls on Private Equity and Alternative Investments. The LBP should significantly increase the yield margin versus cash since the LBP is using A/BBB+ coupon income from all maturities of the LBP. With the LBP fully funding B+E, the cash allocation can be reduced to <1%. Replacing most of the cash allocation to fund B+E with the LBP allocation is another ROA enhancement… it all adds up.
Pension Strategy to Reduce Funding Costs by 20%+
The true objective of a pension is to secure and fully fund benefits in a cost-efficient manner with prudent risk . It is a liability and cost objective… it is...
Source: Pension Strategy to Reduce Funding Costs by 20%+
The true objective of a pension is to secure and fully fund benefits in a cost-efficient manner with prudent risk. It is a liability and cost objective… it is NOT a return objective! This objective is best accomplished through a cash flow matching strategy where an optimal bond portfolio will fully fund monthly benefits + administrative expenses net of contributions. Bonds are the only asset class with certainty of its cash flows. That is why bonds have been the asset choice to defease liabilities for over 50 years.
Cash flow matching (CFM) used to be called Dedication in the 1970s and 1980s. As the head of Fixed Income Research at Lehman in the 1970s and early 1980s, I was in charge of our Dedication model. When I created my initial firm in 1984 (Ryan Financial Strategy Group), I hired the two professors in charge of Dedication at I.P. Sharpe to build our model. At Ryan ALM, we have rebuilt a CFM model that best fits any liability objective. The Ryan ALM CFM strategy utilizes our proprietary cost optimization model that will fully fund monthly net liabilities and reduce funding costs by about 2% per year. If we CFM 1-10 years of net liabilities, we should be able to reduce funding costs by about 20%, 1-15 years = 30%, etc. In addition to reducing funding costs, CFM has several benefits that should be utilized and recognized. We strongly urge pensions to consider CFM as the core portfolio that best fits the true pension objective and provides many additional benefits as listed below:
Cash Flow Matching – Provides Liquidity
The intrinsic value of bonds is the certainty of their cash flows! If bonds were used to cash flow match and fund net liabilities (benefits - contributions) chronologically they would produce the liquidity needed to fully fund such net liabilities. Cash flow matching works best with longer coupon bonds where you use semi-annual interest income cash flows to partially fund liabilities. A 10-year bond has 20 interest cash flows + one principal cash flow all priced at a 10-year yield. This would eliminate the need to do a cash sweep of other asset classes which is a common liquidity procedure. According to S&P data, the S&P 500 has 48% of its historical returns from dividends and reinvestment since 1940 on a 10-year rolling period basis. Wouldn’t you want to reinvest dividends back into growth assets rather than spend it on funding benefits + expenses? Wouldn’t you want the ROA of growth assets enhanced?
Cash Flow Matching - Provides TIME
Ryan ALM, Inc. released a 2022 research report titled “Most Important Asset of a Pension… Time!”. By using bonds as the liquidity assets, the growth assets are left unencumbered to grow. The longer the cash flow matching period, the more time the growth assets have to compound their growth. This could significantly enhance the ROA. By cash flow matching net liabilities chronologically, Ryan ALM can buy the time a plan sponsor and their consultant feel is necessary for the growth assets to grow unencumbered… and recover from negative return years. When markets correct and go down (i.e. 2022) it may take several years to recover and achieve the average annual target ROA that was assigned to that asset class.
Cash Flow Matching – Provides Inflation Hedge
Ryan ALM released a 2020 research report and pension alert titled “Pension Inflation =/= CPI”. Pension inflation has three parts: a cost of living adjustment (COLA) lives; a salary increase factor for active lives and a forecast of administrative expenses. The COLA may be based on the CPI but with a floor and a cap or even a % of the CPI while the salary and administrative expense increases tend to be quite static @ 3% annual increase. As a result, pension inflation tends to be less volatile and more static than the CPI. The plan sponsor actuary includes pension inflation in their projected benefit + expenses payment schedule for both retired and active lives. This fact suggests clearly that the best way (and only way) to hedge pension inflation is to cash flow match the actuarial projected benefits + expenses. If you cash flow match the actuarial projections, you have defeased liabilities and hedged pension inflation.
Cash Flow Matching – Outyields Benchmark and Bond ROA
The Ryan ALM cash flow matching product (Liability Beta Portfolio or LBP) is heavily skewed to A/BBB corporate bonds while the BB Aggregate is heavily skewed to Government bonds. As a result, the LBP will outyield the BB Aggregate by a significant yield spread… usually 50 – 75 bps, which will enhance the ROA of bonds.
Higher Yields are Good for Cash Flow Matching… and Pensions
Ryan ALM released a topical 2022 research report titled “Why Higher Interest Rates are Good for Pensions”. Pension funds are highly interest rate sensitive! Certainly, fixed income assets are such that the longer their maturity and effective duration, the greater their interest rate sensitivity. But it is pension liabilities that are more interest rate sensitive. Liabilities behave like a 100% zero-coupon bond portfolio because the discount rate(s) chosen price liabilities as zero-coupon bonds. This causes liabilities to be longer in duration then the same maturity(s) coupon bonds. Many discount rates are a yield curve of rates (ASC 715, PPA, PBGC, IASB). As interest rates trend higher, bonds can cash flow match liabilities at lower and lower costs. Note that cash flow matching is focused on funding B + E which are future values. Future values are not interest rate sensitive. Bonds are the only asset class with the certainty of cash flows (future values). That is why bonds have always been used as the methodology for defeasance (cash flow matching) of liabilities. Moreover, if interest rates trend upward any reinvestment of cash flow can buy future value at a lower cost. As a result, cash flow matching sees higher interest rates as an opportunity to reduce funding costs. The Ryan ALM cash flow matching product can reduce funding costs by @ 20% for most pension liabilities out to 10 years. In contrast, bonds used as performance or growth assets could see negative returns… like 2022. Total return performance is not the value in bonds… the certainty of cash flow is the intrinsic value. We urge pensions to transfer their bond allocation from focusing on outperforming some generic bond index to focusing on cash flow matching liabilities chronologically, especially at today’s higher rates.
Reminder: The ROA is Plural… ROAs
Ryan ALM, Inc. released a topical 2022 research report titled “The Pension ROA is plural… ROAs” that details how the ROA is calculated. Each asset class is askby using their index benchmark as the target return proxy. However, for fixed income it is the YIELD of the index benchmark… not the total return like other asset classes. The Bloomberg Barclay Aggregate is most favored as the bond index benchmark. This index and almost all popular bond index benchmarks were designed at Lehman Bros. by me (Ron Ryan) when I was the head of Fixed Income Research & Strategy from 1977 to 1983. Please note… each asset class is NOT required to earn the pension fund ROA assumption (@ 6.50% today). This is an important fact to remember in asset allocation. We at Ryan ALM often hear the criticism and question… how can we invest in 4% bonds to earn our ROA? The answer is bonds do NOT need to earn the pension ROA… just their assigned ROA (yield of index benchmark) in the asset allocation model.
The Smartest Beta
The term “beta” is credited to William F. Sharpe, Ph.D. in his 1964 work in development of the “Capital Asset Pricing Model (CAPM)”. It means (1) the covariance of the...
Source: The Smartest Beta
The term “beta” is credited to William F. Sharpe, Ph.D. in his 1964 work in development of the “Capital Asset Pricing Model (CAPM)”. It means (1) the covariance of the return on a security or portfolio with that of the market portfolio divided by (2) the variance of the return on the market portfolio. Professor Sharpe originally called this “market sensitivity” since you are comparing an investment to the market as defined by a market index. A beta of 1.0 suggests you have no residual risk in that you match the risk/reward behavior of the market index you are being compared against. Ideally, a market index fund should consistently have a market beta of 1.0.
Beta is a measurement based on a market or objective index. Without the index benchmark there is no applicable beta calculation. Traditionally, this has been the popular index benchmarks (i.e. S&P 500, Lehman Aggregate, etc.) but in truth it can be any index that best represents the objective of such funds (i.e. ETFs, index funds). Back in 1964 there was the absence of market indexes so beta was limited mainly to a measurement versus the S&P 500. The first bond index was introduced by Kuhn Loeb in 1973 (merged into Lehman in 1977). Since the advent of ETFs in 1993 there has been numerous new indexes created to feed the explosive growth of ETFs. Such new indexes are the stated objective of these many new ETFs.
Smart Beta
Smart beta is the optimization of the risk/reward behavior of a market index usually by changing the weights. Popular smart beta weighting schemes have been: fundamental weighting, equal-weighting, risk-clusters, and diversity weighting (combines equal and cap weighting). By changing the weights methodology the goal is to enhance returns or reduce volatility or both. Smart beta products have grown well in a short period of time but for the most part are still equity index derivatives. Rob Arnott and Research Affiliates, LLC have been a leader here introducing fundamental weighting for both bond and stock indexes as risk/reward value-added.
There is debate as to whether changing the weight methodology of a market index is really active management or an alpha strategy rather than a beta strategy or discipline. My recommendation is that the objective decides what is beta and alpha. What is important is to have the objective defined by a rules based index. If this reweighted index is the stated objective of an ETF, mutual fund or client then beta is the portfolio that matches the risk/reward of this objective index version. It also follows that alpha is the excess return versus this modified index objective. All comparisons to the traditional generic market index are just good information to know but do not determine the alpha and beta calculations.
Liability Beta Portfolio (The Smartest Beta)
The “smartest beta” portfolio is the portfolio that best matches and achieves the true client objective with the least amount of risk and cost. Risk is best measured as the uncertainty of achieving the objective. Cost is the amount required to fund the objective. The true objective of most institutions and even individuals is some type of liability (annuities, banks, insurance, lotteries, NDT, OPEB, pensions, etc.). The absolute level of volatility of returns is not risk given a liability objective. Indeed a 10-year liability payment is best matched and funded (defeased) by a 10-year Treasury STRIPS which has a certain future value. A three month T-bill would be very risky given this liability objective as it has 39 reinvestment moments of uncertainty. Although the 10-year Treasury STRIPS would be much more volatile in returns, such a return pattern would match the present value behavior of the 10-year liability and thus be low risk or even risk-free (defeasance).
Given a liability objective it is critical to create a custom liability index (CLI) as the proper benchmark. It must be a custom index since liabilities are like snowflakes… you will never find two alike. The CLI is a portfolio of liability payments weighted by the schedule of payments (term structure). Most institutional liabilities are calculated by actuaries who produce an actuarial projection of the liability payment schedule for each client. As such, the CLI is weighted by the actuarial projection in present value dollars. To calculate the present value of each liability payment you need to price liabilities based on a yield curve of discount rates. Depending on the type of liability there are accounting rules (ASC, FASB, GASB, IASB, PPA, etc.) that dictate the discount rate methodology.
Most, if not all, liabilities are priced as zero-coupon bonds since they produce a certain future value. Using U.S. corporate pensions, as an example, they are regulated by ASC 715 (formerly FAS 158) for GAAP accounting purposes. These rules suggest pricing liabilities as if they were AA corporate zero-coupon bonds. Since such bonds are not available in the bond market, they have to be manufactured as hypothetical zero-coupon bonds. As a result, liabilities behave like a yield curve of zero-coupon bonds weighted by the actuarial projections. This means that pension liabilities are extremely interest rate sensitive.
The CLI should calculate all of the necessary statistics to maintain and monitor a liability beta portfolio: term structure weights, total present value, YTM, duration, growth rate, interest rate sensitivity. The CLI is also the proper benchmark to measure liability alpha. If equity assets outperform the S&P 500 but underperform the CLI growth rate… did you earn alpha? In the eyes of the client you lost to liability growth which will damage the funded ratio (assets/liabilities), credit rating and increase contribution cost. Liability alpha is the excess return versus the CLI return (growth rate) and not versus a market index return. Based on Ryan ALM indexes, liability YTD returns through November 30 should be between 12.7% (10-year duration) and 22.2% (15-year duration). Hard to believe that any pension has earned liability alpha so far in 2014.
The key point here is that the client objective is truly the focus and determinant of relative risk and reward (beta and alpha). The client objective is to fund liabilities in such a way that risk and cost are reduced and stable over a long horizon. Given a long average life (duration) based on the liability payment schedule then the liability beta portfolio needs to match these term structure weights. An S&P 500 index fund or any generic market index fund could never represent the beta portfolio for a liability driven objective. Cash or a money market fund is a very risky investment for most liability objectives that have long average lives (duration).
The most appropriate and smartest beta portfolio is the one that matches the liabilities cash flow as measured by the CLI. In essence, the smartest beta portfolio is a custom liability index fund. Such a portfolio should be the core portfolio for any liability objective. By matching the liability term structure the uncertainty risk of matching liabilities is eliminated and interest rate sensitivity is neutralized. By matching the liability term structure with bonds that have higher yields and lower present values (price) than the discount rates used… you have reduced costs. Since the accounting rules (ASC 715, IASB, and PPA) use AA zero-coupon discount rates then a liability beta portfolio of A and BBB will produce higher yields and lower costs. This should provide significant cost savings of 10% to 15%. This matching process is called cash flow matching. Beware of duration matching strategies (i.e. immunization) which do not match the liability cash flows but just the average duration. This is not an accurate or cost effective way to match liabilities. The smartest beta portfolio is a liability cash flow matched portfolio!
The Evolution of Asset/Liability Management
CEO, Ryan ALM, Inc. What Is Asset/Liability Management (ALM)? The objective of most institutions in the United States with assets to invest is to fund some sort of liability, (banks,...
Source: The Evolution of Asset/Liability Management
CEO, Ryan ALM, Inc.
What Is Asset/Liability Management (ALM)?
The objective of most institutions in the United States with assets to invest is to fund some sort of liability, (banks, insurance companies, pension funds, etc.). As a result, asset/liability management (ALM) should be the investment focus and strategy for these institutions.
Banks and insurance companies have maintained this focus because it is required by the regulations under which they operate. The IAIS Standard No. 13 (2006), which is the basis for insurance company regulation in the United States, defines asset/liability management (ALM) as the practice of managing a business so that decisions and actions taken with respect to assets and liabilities are coordinated.1 Oracle Financial Services (2008), in its white paper “Asset Liability Management: An Overview,” defines ALM for banks as a mechanism to address the risk faced by a bank because of a mismatch between assets and liabilities resulting from either differences in liquidity or changes in interest rates.
Indeed, as banks and insurance companies have practiced it, ALM is the management of assets so that asset cash flows are as similar as possible to that of the liability cash flows. Exley, Mehta, and Smith (1997) conclude in their paper “The Financial Theory of Defined Benefit Pension Schemes” that financial theory offers no good reason why ALM as practiced by pensions should differ from ALM by banks. They emphasize that the time has come to stop treating pensions as anything special. Pension liabilities are the same as any other liability. In a special LDI (liability-driven investing) issue of aiCIO Magazine, McDaniel (2011)
IAIS is the International Association of Insurance Supervisors. See http://www.iaisweb.com.
provides a well-documented history of LDI theory in his column “LDI’s Founding Document,” concluding that pension liabilities should be treated in the same way as bank and insurance liabilities, giving each a proper ALM focus.
The focus of this review will be the evolution of ALM for pensions. Pensions have no regulations requiring asset/liability management or the matching of assets cash flows to liability cash flows. This lack of regulation may be the most important cause of the spiraling pension deficits and decline of defined benefit plans since 1999.
Prehistory: Insurance Company Management of Pension Funds
In the decades before pension plan sponsors began to manage pension assets as quasi-independent investment organizations, it was typical for pension plan sponsors to simply pay an insurance company to assume the liabilities of the pension plan. The insurance company was then responsible for investing the assets while complying with then-current insurance regulations. By regulations, the insurance companies invested most of these assets in fixed-income securities, matching the cash flows from the assets to the cash required to be paid to the pension beneficiaries. This trend has existed from roughly 1875 when the first U.S. corporate pension plan (American Express) was established to today.
In the Beginning: Dedication
Dedication was the earliest form of ALM practiced by pension plans as quasi-independent investment organizations. It was in vogue during the historically high-interest-rate environment of the 1970s and early 1980s. Marty Leibowitz was the first to refer to cash flow matching as “dedication” because it required matching a stream of cash inflows (assets) to a stream of cash outflows (liabilities); each cash inflow was “dedicated” to paying a particular outflow. His work was initially published by Salomon Brothers in the 1970s, where he was managing director, and then (1986) as a series in the Financial Analysts Journal under the title “The Dedicated Bond Portfolio in Pension Funds.” Many authors have written about the pros and cons of dedication. Perhaps the most complete set of writings is offered by Frank Fabozzi (2005) in Dedicated Bond Portfoliosin The Handbook of Fixed Income Securities.
As interest rates rose in a long secular trend, the financial industry began to pay attention. Realizing that the high interest rates would allow them to lock in unprecedented rates of return, defined benefit pension fund managers embraced the concepts of dedication and then later immunization. Wall Street
broker/dealers, especially Salomon Brothers, with Marty Leibowitz as its intellectual leader, provided the complicated software models needed to execute dedication and immunization effectively. Many papers promoting and critiquing ALM strategies were written by quantitative scholars during this time. Times were also good for broker/dealers who could execute very large dedication and immunization portfolios. Perhaps the largest bond trades ever recorded were those done for dedication and immunization.
The dedication model assumed a 100% bond portfolio held to maturity. The quest was to find the least expensive collection of bonds that provided the needed cash flows over the time horizon of the liabilities to be funded. Dedication had several distinct advantages:
Simple asset allocation (100% bonds)
Mitigates interest rate risk since it is funding future values
Specificity (asset cash flows must match liability cash flows)
Predictable cash flows (when the bonds are held to maturity)
Structured management (more certain returns with lower fees)
Reduction of risk (interest rates, reinvestment, inflation, and liquidity)
Immunization Introduced as an ALM Strategy
In the 1980s when interest rates started a secular decline immunization became popular, which focuses on matching the interest rate movement of liabilities in present value dollars. The idea is to minimize the volatility of the surplus (the dollar value of assets minus liabilities) by having an asset duration equal to the liability duration. Duration is the present-value-weighted average time to receipt of the cash flows from a security or portfolio. Macaulay (1938), in his book entitled Some Theoretical Problems Suggested by] the Movement of Interest Rates, Bond Yields and Stock Prices in the United States since 1856,2 is credited with introducing the term “duration” and defining it as above. In 1942, Koopmans’s paper “The Risk of Interest Fluctuations in Life Insurance Companies” pointed out that if the duration of the bonds held in a portfolio were matched to the duration of the liabilities those bonds would fund, the effects of interest rate changes could be mitigated or nullified completely (i.e., the portfolio would be immunized).
This effort to define ALM strategies that would protect a portfolio from interest rate changes largely conducted by academics, culminated in a 1952 paper titled “Review of the Principles of Life-Office Valuations” by a nonacademic actuary, F.M. Redington, who worked for a British insurance company. He is credited with introducing the term “immunization” to signify the investment of assets in such a way that the existing business is immune to a general change in the interest rate.
As interest rates began to fall in early 1982, call risk surfaced as a serious impediment to immunization and dedication models, especially for those who ventured into mortgage-backed securities. This call (or prepayment) risk would alter cash flows and maturity structures, with resulting damage to the integrity of immunization and dedication models that depended on the certainty of these cash flows and maturity dates.
Accounting Rules Redirect Pension Asset Management
This FASB standard would help those designing immunization strategies to understand how to match the present value of liabilities. However, for pension expense purposes, the new statement allowed corporations to use the return on assets (ROA) assumption as follows: If the dollar growth in pension assets based on the ROA rate exceeded the pension expense amount, then pension expense would be negative—that is, it would become pension income which would directly enhance earnings. Because corporations are earnings led and not liabilities led, the ROA became the hurdle rate objective for pension assets.
When interest rates went below the ROA assumption rate (around 8%) in the late 1980s, dedication and immunization strategies fell out of vogue because they locked in a return that would not be sufficient to neutralize or overcome pension expense, resulting in a drain on EPS. As a consequence, dedication and immunization were largely replaced by surplus optimization strategies that aimed at the growth of pension assets to outpace liability growth, thereby creating a pension surplus that would reduce or even eliminate contribution costs. Contribution costs were a function of the funded status (the present value of assets minus the present value of liabilities). Any deficit or underfunding (a funded ratio less than 100%) was to be erased through contributions planned out over time so that the pension plan would be fully funded over the life of the liabilities.
The late 1980s and the decade of the 1990s were good times for pensions. With the switch to a surplus optimization strategy, asset allocation models were heavily skewed to equities over bonds because the ROA was now the “bogey,” or investment return benchmark. This asset allocation decision worked out well during this period; equities enjoyed several good years of double-digit returns, resulting in pension surpluses that enhanced EPS (returns above the ROA were an “actuarial gain” line item that increased EPS) and reduced contribution costs. During this period, ALM became a hard sell, given the level of interest rates, the historical return track record of equities, and the resulting financial statement benefits of an ROA hurdle rate. This focus on an absolute return (ROA) rather than on relative cash flows would soon haunt the pension industry and prove fatal to some plan sponsors.
The equity bear market that hit in 2000–2002 became a pension tsunami for several reasons. The correction was quite deep, amounting to a 49% fall in the S&P 500 Index, with the result that pension asset growth underperformed liability growth by as much as 75% on a cumulative basis over those three years. This event led to spiking contribution costs because of crashing funded ratios, an EPS drain from the pension assets underperforming the ROA (actuarial loss), and even insolvency of the plan sponsor, with several companies (notably airlines) filing for bankruptcy because pensions tend to be the largest liability of many firms.
The Society of Actuaries (SOA) became concerned that such an asset/liability disparity occurred as a result of accounting rules and it issued a research paper draft (2004) titled “Principles Underlying Asset Liability Management,” which warned that accounting measures can distort economic reality and produce reports that are inconsistent with economic results. It
further stated that entities that focus on economic value tend to achieve their financial objectives more consistently in the long run. In other words, the SOA promoted ALM on an economic basis (i.e., market value), rather than on an accounting basis, as the proper asset management style.
At that time, corporations were begging for relief from spiking pension contribution costs. Congress responded with the Pension Protection Act (PPA) of 2006. A number of pension experts provided testimony during the several-years-long process of writing the PPA. In my testimony before the ERISA Advisory Council on Employee Welfare and Pension Benefit Plans (2003), I recommended that liabilities should be priced at the market as a yield curve since liabilities are a term structure. In harmony with FAS 87 rules, I reminded them that the discount rate used should be one that settles the liabilities. I further proposed that as an acid test a rule should be created and enforced that reads, “If you cannot buy it, you cannot use it as a discount rate!”
a 24-month moving average of a three-segment yield curve and (
the current spot-rate yield curve. In both options, the yield curve was based on high-quality corporate bonds rather than Treasury bonds. In effect, the PPA raised discount rates which lowered the present value of liabilities, thereby enhancing the apparent funded ratio and lowering contribution requirements.
The FASB was also concerned that existing standards did not communicate the funded status on balance sheets, so in 2006 it issued Statement of Accounting Standards No. 158: Employers’ Accounting for Defined Benefit Pension and Other Postretirement Plans (effective 2007). This communication, usually referred to as FAS 158, clarified that the discount rates used should correspond to the current market value of aportfolio of high-quality zero-coupon bonds whose maturity dates and amounts match the expected future benefit payments. This accounting standard also introduced Other Post-Employment Benefits (OPEB) liabilities onto the balance sheet, revealing that they are one of the largest liabilities facing U.S. institutions.
ALM Strategies Reborn as LDI
After the equity correction of 2000–2003, the stage was set for institutions to return to the basic practice of asset/liability management, because failure to do so had resulted in deteriorating funded ratios, large actuarial losses, spiking contribution costs and even bankruptcies. This time, however, ALM was more frequently referred to as liability-driven investing (LDI) to suggest a new, enhanced approach.
Because of the ongoing secular trend toward lower rates and the fact that the expected return on assets continued to be used to calculate pension expense, corporations continued to pursue an asset allocation away from bonds but with less equity concentration. This trend opened the asset allocation door to many new asset classes and strategies, including hedge funds, alternative investments, and new LDI strategies.
Frank Fabozzi, Ph.D. and I have written prolifically on ALM strategies and considerations. Fabozzi’s books are a mainstay for any ALM practitioner. His Bond Portfolio Management (especially the chapter “Managing Funds Against Liabilities”), published in 2001, and his Handbook of Fixed Income Securities (chapter on “Cash Flow Matching”), published in 2022, have become required reading. Fabozzi and I teamed up in 2005 to produce the article “Reforming Pension Reform,” proposing a solution to the growing pension crisis. Our solution starts with pricing liabilities at the market (economic value) and then building a custom liability index as the proper benchmark for pensions (or any liability-driven objective), because liabilities are unique to each pension plan. We later followed this article with “Liability Index Fund: The Liability Beta Portfolio” (2011), in which we argued that a liability index fund should bethe core portfolio and is the only correct beta portfolio for a pension with a liability objective. The liability beta portfolio is the proper form of ALM or LDI which cash flow matches liability cash flows at low cost. To create and maintain such a portfolio, a custom liability index is also required.
Waring and Siegel produced a detailed account of why saving defined benefit pension plans is a good idea in their 2007 paper “Don’t Kill the Golden Goose! Saving Pension Plans.” They conclude that the first element needed to manage a defined benefit plan is an “economic” view of the liability. The only risks that can be hedged through investment policy and strategy are those that are correlated with market returns of one kind or another. Accounting values are not hedgeable because they are smoothed and are not market values. In the face of a trend toward freezing defined benefit plans in favor of defined contribution plans, the authors argued that defined benefit plans are more cost effective and efficient than defined contribution plans.
Public pensions have the largest deficits and the lowest funded ratios, a result that may be attributable to the Governmental Accounting Standards Board (GASB) accounting rules, which smooth assets over five years and price liabilities at a ROA discount rate. Since 1999, this accounting practice has usually overvalued assets and undervalued liabilities versus economic values (market values). In my paper “The Public Pension Crisis” (2011), I described how the ROA discount rate misled pension trustees and consultants into making inappropriate asset allocation, benefit, and contribution decisions by thinking they were highly funded when they had true large economic deficits. All of these decisions are linked together. My solution to the public pension crisis starts with liabilities. I argued that until a Custom Liability Index (CLI) is installed as the proper benchmark priced as a yield curve of market rates, all asset allocation, budget, and contribution decisions are in jeopardy.
In conclusion, the true objective of a pension plan is to secure the benefits in a cost-efficient manner with prudent risk. This is best accomplished thru cash flow matching of the liability cash flows. A Custom Liability Index should also be installed as the proper benchmark so asset allocation can know the true economic funded status and performance measurement of asset growth versus liability growth can be accurately assessed.
“Insanity is doing the same thing over and over again and expecting different results” - Albert Einstein
Bibliography
Black, Fischer. 1980. “The Tax Consequences of Long-Run Pension Policy.” Financial Analysts Journal, vol. 36, no. 4 (July/August):21–28.
“I believe that every tax-paying firm’s defined benefit pension fund portfolio should be invested entirely in bonds (or insurance contracts). Although the firm’s pension funds are legally distinct from the firm, there is a close tie between the performance of the pension fund investments and the firm’s cash flows. Sooner or later, gains or losses in pension fund portfolios will mean changes in the firm’s pension contributions. Shifting from stocks to bonds in the pension funds will increase the firm’s debt capacity, because it will reduce the volatility of the firm’s future cash flows. Shifting from stocks to bonds will give an indirect tax benefit equal to the firm’s marginal tax rate times the interest on the bonds.” (p. 21)
Choie, Kenneth S. 1992. “Caveats in Immunization of Pension Liabilities.” Journal of Portfolio Management, vol. 18, no. 2 (Winter):54–69.
“Immunization requires that the value of assets and the present value of liabilities be the same, and that the interest rate sensitivity or duration of the assets be the same as that of the liabilities. The first issue in immunization is establishment of the appropriate discount rates to compute the present value and the duration of a liability schedule. The question of the appropriate discount rates for a given liability schedule has crucial ramifications for construction of an asset portfolio to immunize the liability stream.” (p. 54)
Collie, Bob. 2012. “LDI’s Journey toward Greater Customization.” aiCIO Magazine, vol. 4, no. 4 (LDI Special Issue):6–11.
“The basic initial steps of an LDI program are an increase in the portfolio’s sensitivity to interest rates and a reduction in equity holdings. These steps are similar no matter who is taking them. However, as the LDI program becomes more advanced and the link between the asset portfolio and the liabilities becomes stronger, a point is reached at which a greater degree of customization becomes necessary.” (p. 6)
Ehrentreich, Norman. 2009. “The Asset Return–Funding Cost Paradox: The Case for LDI.” Ehrentreich LDI Consulting & Research.
“Pension regulations of the 1980s have effectively removed incentives for corporate plan sponsors to overfund their pension plans. Now, equity based investing strategies sooner or later lead to large funding shortfalls, and the inability of most plan sponsors to close them immediately makes them persistent. Therefore, the most basic requirement for converting eventual higher asset returns into lower funding costs, i.e., having average funding levels of 100% or more, is regularly violated by most pension plans.” (p. 1)
Fabozzi, Frank. 2005a. “Dedicated Bond Portfolios.” In TheHandbook of Fixed Income Securities. 7th ed. New York: McGraw-Hill:1103–1117.
“The dedicated bond portfolio, as it is frequently called, is a strategy that matches monthly cash flows from a portfolio of bonds to a prespecified set of monthly cash requirements of liabilities. Cash matching or prefunding these liabilities leads to the elimination of interest-rate risk and the defeasance of the liability. Applications for the dedicated strategy include pension benefit funding, defeasance of debt service, municipal funding of construction takedown schedules, structured settlement funding, GIC matching and funding of other fixed insurance products.” (p. 1103)
Fabozzi, Frank, and Ronald Ryan. 2005. “Reforming Pension Reform.” Institutional Investor (January):84–88.
“Until pension liabilities are priced at the market, pension funds run the risk of an asset-liability disconnect. Liabilities should be priced off of a market yield curve. An ironclad pension accounting rule should be: If you cannot buy it, you cannot use it as a discount rate. Start with the Treasury zero-coupon yield curve. Use this yield curve to build custom liability indexes for each plan. Once a plan sponsor creates a custom index as a benchmark for liabilities, it can properly manage assets. Asset allocation and performance measurement models will be able to compare the growth and risk behavior of assets and liabilities by term structure. If assets are not measured against liabilities, they are likely to have the wrong index objective.” (p. 88)
Fabozzi, Frank, and Ronald Ryan. 2011. “Liability Index Fund: The Liability Beta Portfolio.” Journal of Financial Transformation, vol. 33 (December):29–33.
“For corporate defined benefit plans, only a CLI [custom liability index] is the appropriate asset benchmark for liability-driven objectives. With a CLI, Beta and Alpha portfolios are redefined and can work in harmony with the true objective. The asset management guidelines of a pension plan can then take into account the risk/reward behavior of the true economic objective in establishing investment policy, especially the liability Beta portfolio which should be installed as the core portfolio.” (p. 33)
“By definition, an index fund is the correct Beta portfolio that matches the index benchmark with such accuracy that the tracking error is nil with the Beta calculation at 1.00 and the correlation at or near 100. With a liability-driven objective, only a liability index fund could qualify as the Beta or matching portfolio. A liability index fund, by definition, requires an index that reflects a pension fund’s liability term structure. Since each liability structure is unique, this calls for the creation of a custom liability index (CLI). Until the asset portfolio’s cash flows match each monthly liability payment (i.e., liability term structure), the interest rate risk (systematic risk) that dominates the risk/reward behavior of pension liabilities cannot be hedged.” (p. 31)
Financial Accounting Standards Board. 1985. “Statement of Financial Accounting Standards No. 87: Employers’ Accounting for Pensions.” FASB
“Interest rates vary depending on the duration of investments; for example, U.S. Treasury bills, 7-year bonds, and 30-year bonds have different interest rates. … The disclosures required by this Statement regarding components of the pension benefit obligation will be more representationally faithful if individual discount rates to various benefit deferral periods are selected.” (paragraph 199)
“In making those estimates, employers may also look to rates of return on high-quality fixed-income investments currently available and expected to be available during the period to maturity of the pension benefits.” (paragraph 44)
Financial Accounting Standards Board. 2006. “Statement of Financial Accounting Standards No. 158: Employers’ Accounting for Defined Benefit Pension and Other Postretirement Plans.”
“The objective of selecting assumed discount rates is to measure the single amount that, if invested at the measurement date in a portfolio of high-quality debt instruments, would provide the necessary future cash flows to pay the accumulated benefits when due. Notionally, that single amount, the accumulated post-retirement benefit obligation, would equal the current market value of a portfolio of high-quality zero-coupon bonds whose maturity dates and amounts would be the same as the timing and amount of the expected future benefit payments.” (paragraph 144a)
International Association of Insurance Supervisors. 2006. “Standard on Asset-Liability Management.” IAIS Standard No. 13
“This paper describes best practices for asset-liability management (ALM) that a well-managed insurer would be expected to follow and identifies 11 minimum requirements. Asset-liability management (ALM) is the practice of managing a business so that decisions and actions taken with respect to assets and liabilities are coordinated. The objective of ALM is not to eliminate risk. Rather, it is to manage risks within a framework that includes self-imposed limits. The IAIS requires that insurers have in place effective procedures for monitoring and managing their asset-liability positions to ensure that their assets and investment activities are appropriate to their liability and risk profiles and their solvency positions.” (pp. 3, 5, 6)
Leibowitz, Martin L. 1986a. “The Dedicated Bond Portfolio in Pension Funds—Part I: Motivations and Basics.” Financial Analysts Journal, vol. 42, no. 1
“Dedicated bond portfolios allow a corporate pension fund to take advantage of favorable fixed income markets and the actuarial system’s willingness to provide special benefits for a minimum-risk investment approach. Purely as an investment approach, a dedicated portfolio serves as a least-risk asset, minimizing the risks involved in fulfilling a large class of nominal-dollar liabilities. Because the process is largely assumption-free, it provides the sponsoring corporation with an actuarially acceptable way to take advantage of available market interest rates to improve funding status.” (p. 68)
Leibowitz, Martin L. 1986b. “The Dedicated Bond Portfolio in Pension Funds—Part II: Immunization, Horizon Matching and Contingent Procedures.” Financial Analysts Journal, vol. 42, no. 2
“Immunization, horizon matching and various contingent schemes offer pension plan sponsors and managers an opportunity to minimize risk while retaining some degree of management discretion to pursue lower costs or higher returns. Immunization calls for the creation of a portfolio of bonds whose value coincides with the present value of a given schedule of liabilities and whose duration, or interest rate sensitivity, is the same as that of the liabilities. By specifying a minimum portfolio return somewhat below the available market rate, the manager can create a “cushion spread” that provides the basis for several contingent schemes. As long as the portfolio retains assets sufficient to meet the target return, it may be actively managed. When adverse market moves threaten this return, the portfolio must be converted into a dedicated mode that will assure the target return.” (p. 47)
Macaulay, Frederick R. 1938. Some Theoretical Problems Suggested by the Movement of Interest Rates, Bond Yields and Stock Prices in the United States since 1856. New York: National Bureau of Economic Research.
“The time to maturity is not an accurate or even a good measure of ‘duration.’ ‘Duration’ is a reality of which ‘maturity’ is only one factor. Whether one bond represents an essentially shorter or an essentially longer term loan than another bond depends not only upon the respective ‘maturities’ of the two bonds but also upon their respective ‘coupon rates’ and under certain circumstances, on their respective ‘yields.’ Only if maturities, coupon rates and yields are identical can we say, without calculations, that the ‘durations’ of two bonds are the same. The duration of a stream of payments may be thought of as the average life of the stream.” (p. 45)
McDaniel, Kip. 2011. “LDI’s Founding Document.” aiCIO Magazine, vol. 3, no. 2 (LDI Special Issue)
“The history of a formal LDI theory is littered, it seems, with false starts. Our conclusion is that, although historically a distinction has been drawn between asset and liability management by banks and pension funds, financial theory offers no good reason for this distinction. Time to stop treating pensions as anything special. They’re the same as any other liability—and time to show that on the balance sheet.” (pp. 8, 9)
Oracle Financial Services. 2008. “Asset Liability Management: An Overview.” Oracle White Papers (http://www.oracle.com/us/industries/financial-services/045581.pdf).
“Asset Liability Management (ALM) can be defined as a mechanism to address the risk faced by a bank due to a mismatch between assets and liabilities either due to liquidity or changes in interest rates. Apart from liquidity, a bank may also have a mismatch due to changes in interest rates as banks typically tend to borrow short term (fixed or floating) and lend long term (fixed or floating). The function of ALM is not just protection from risk. The safety achieved through ALM also opens up opportunities for enhancing net worth.” (p. 2)
Ryan, Ronald. 2003. “Testimony before the ERISA Advisory Council on Employee Welfare and Pension Benefit Plans.” U.S. Department of Labor
“Liabilities should be priced at the market as a yield curve. A rule should be created, or enforced, that reads: If you cannot buy it, you cannot use it as a discount rate! Bond indexes are market-weighted; they’re not liability weighted. Until a custom liability index is built for each pension plan, based upon the unique actuarial term structure of that plan, and priced off of real zero-coupon bonds, pensions are in jeopardy of managing to the wrong objective.” (p. 9)
Ryan, Ronald. 2011. “The Public Pension Crisis.” IMCA Investments and Wealth Monitor
“The solution to the public pension and budget crisis starts with liabilities. Until a custom liability index (CLI) is installed as the proper benchmark, all asset allocation, asset management, benefit and contribution decisions will be based upon erroneous and misleading calculations. The benchmark must be a CLI because no two pensions are alike due to different salaries, mortality and plan amendments.” (p. 30)
Society of Actuaries. 2004. “Principles Underlying Asset Liability Management.” SOA Exposure Draft
“Asset Liability Management is the ongoing process of formulating, implementing, monitoring, and revising strategies related to assets and liabilities to achieve financial objectives, for a given set of risk tolerances and constraints. A consistent ALM structure can only be achieved for economic objectives. Various accounting measures are affected by rules that change the emergence of income and the reported book value of assets and liabilities. These measures can sometimes distort economic reality and produce results inconsistent with economic value. Because ALM is concerned with the future asset and liability cash flows, the natural focus of ALM is economic value. Entities that focus on economic value tend to achieve their financial objectives more consistently in the long term.” (p. 6)
Waring, M. Barton, and Laurence B. Siegel. 2007. “Don’t Kill the Golden Goose! Saving Pension Plans.” Financial Analysts Journal, vol. 63, no. 1
“The first element of ‘new’ technology needed to manage DB plan risk and cost is an economic view of the liability. The only risks that are helpful to know about are the risks that can be hedged through investing the assets. Such risks are those in the liability that are market related—that is, correlated with the returns of assets or indices available in the markets. Therefore, sponsors need to set aside the actuarial and accounting views of the liability and rediscount the cash flows at appropriate, market-related rates. Plus, they need to understand how these market-related values, economically sensible measures of periodic pension cost, and economically required contributions change as market interest rates change.” (p. 36)
Waring, Barton, and Duane Whitney. 2009. “An Asset–Liability Version of the Capital Asset Pricing Model with a Multi-Period Two-Fund Theorem.” Journal of Portfolio Management, vol. 35, no. 4 (Summer)
“The authors present a new capital asset pricing model (CAPM) that incorporates investors’ deferred spending plans, or ‘economic liabilities’—the underlying purpose behind all investments—and thus reveal a new risk-free asset, the investor’s liability-matching asset portfolio.” (p. 111)
Liability Beta vs. Market Beta
Beta is a term first pioneered by PhD. William Sharpe in his 1970 book “Portfolio Theory and Capital Markets”. Here he introduced his famous capital asset pricing model (CAPM) which...
Source: Liability Beta vs. Market Beta
Beta is a term first pioneered by PhD. William Sharpe in his 1970 book “Portfolio Theory and Capital Markets”. Here he introduced his famous capital asset pricing model (CAPM) which presented the idea that individual investments contain two types of risk: Systematic and Unsystematic risk.
Systematic risk was deemed to be market risk that cannot be diversified away while unsystematic risk was deemed to be the specific risk of that investment (i.e. credit, features, etc.) that can be diversified away through adding other investments to the portfolio. Modern portfolio theory (MPT) shows that unsystematic risks can be removed or reduced through portfolio diversification. The problem that remains is that of market risk.
The Notre Dame fixed income indexes study of 1986 proved that the market risk for bonds is interest rate risk which is quite dominate. Their calculations showed that interest rate risk explained or accounted for 96% plus of the total return for the major bond index aggregates. This study further proved that interest rate is best measured by a yield curve that is well diversified by maturity or duration (term structure). Any bond index that does not have a distinct term structure is not a good measurement of bond market risk.
Through time, it became obvious how difficult it was for active management to consistently outperform a market index as a benchmark (especially after fees). This led to Index Funds as a major asset management style. The growth in this form of asset management has been dramatic especially when including the explosive growth of exchange traded funds (ETFs).
With the advent of Portable Alpha as a strategy, assets are divided into two groups: Alpha and Beta. A Portable Alpha strategy transfers (ports) the excess return (Alpha) over to the Beta portfolio to secure the victory. The Beta portfolio is considered the portfolio that matches the objective as an index benchmark (i.e. Index Fund) and Alpha is considered the portfolio that outgrows (excess return) the index objective.
Given the currentasset liability management(ALM)or liability driven investment (LDI) trends, it has become obvious that the true objective of a pension is to fund a liability schedule unique to each plan sponsor. Since the objective of a pension (and most institutional objectives) is liability driven shouldn’t the terms Beta and Alpha be redefined for any LDI objective. After communication with PhD. William Sharpe years ago, he suggested I qualify my research as Liability Beta and Liability Alpha to distinguish it from market beta and market alpha. I agree, that makes good sense.
Market Beta and Alpha
Most asset managers are given an index bogey or objective that best represents the asset class risk/reward behavior that the client has chosen as the objective of such asset allocation. Asset consultants are quite diligent in selecting and monitoring the asset managers to perform under these index objectives. The goal could be to either match the risk/reward behavior (Beta portfolio or index fund) or outperform the return behavior (earn Alpha). A few good questions here are: if your asset managers earn market Alpha, does that mean they earned liability Alpha? If all asset managers outperformed their index bogey but total assets underperformed liability growth, did the client win or lose? Did asset allocation create value added (Alpha)?
Liability Beta and Alpha
Several strategies exist to match pension liabilities (cash flow matching, duration matching, derivatives, interest rate swaps, etc.). These liability Beta portfolios are to match the liability cash flow schedule (cash flow matching) or interest rate sensitivity of liabilities (duration matching) or both. Liability Alpha is rarely a consideration yet this is how a pension improves its funding status and reduces pension costs (i.e. contributions). In the end, total assets must outgrow total liabilities over time to earn liability Alpha thereby enhancing the funded status and reduce pension costs.
Custom Liability Index
Given any liability driven objective, the proper index benchmark should be a Custom Liability Index (CLI) that best measures the size, shape and risk/reward behavior of these client specific benefit payment schedules. The Ryan ALM CLI is a monthly report that calculates the present value, growth rate and interest rate sensitivity of liabilities. Client liabilities are like snowflakes… you will never find two alike. Only a CLI could accurately represent the true pension objective. It should be obvious thatthe true objective of a pension is to fund their liabilities in a cost-efficient manner with prudent risk. It is difficult, if not impossible, for asset liability management (ALM) to function effectively without proper knowledge of the liability cash flows. In sports, the scoreboard dictates the strategy. The CLI is the pension scoreboard for liabilities. When compared to assets, the plan sponsor knows every month if they are winning or losing the pension game.
Current accounting rules and actuarial practices price liabilities as a zero-coupon bond portfolio at a single discount rate on an annual basis, months delinquent where the liability cash flow schedule (annual projections of benefits) is rarely seen. Moreover, this single discount rate may not be a market rate (GASB for public plans uses the ROA). Could any asset manager perform versus a generic market index if it came out annually, months delinquent where the index portfolio was not transparent and all issues were priced at the same yield? Sounds ridiculous … well, welcome to the current pension liability world we live in.
The Society of Actuaries (SoA) in their 2004 research paper addressed this situation citing that current accounting rules distort economic reality and urged pensions to create a set of economic books that price liabilities at the market on a frequent and accurate basis. Such economic books are best created and maintained as a Custom Liability Index. Indeed, until a Custom Liability Index is installed, the asset side cannot function effectively towards a liability objective. How could an asset allocation model function without correct input as to the true economic Funded Ratio (assets/liabilities) and the size of the economic deficit or surplus (funded status)? How could performance measurement be calculated quarterly without knowledge of the true economic liability growth rate (total return)? How could you match and fund assets to liabilities without a Custom Liability Index?
I designed the CLI over 32 years ago as the best representation and benchmark for any liability objective. The CLI is a monthly report that prices liabilities at the market (using either the Ryan ALM ASC 715 (AA corporates) discount rates or US Treasury STRIPS). The CLI calculates the true economic present value of liabilities and their growth rate so the funded status and performance measurement of assets versus liabilities can both be ascertained.
Lehman Aggregate and Generic Bond Indexes
As the designer of many of the popular Lehman bond indexes (now Bloomberg Barclay’s), I am honored by the acceptance of these bond indexes. However, it should be obvious that they do not behave like liabilities. All of the popular generic bond indexes are rules based. Such rules only use coupon bonds and do not have zero-coupon bonds. Mathematically, the longest duration of any coupon bond is around 17 years today. As a result, such bond indexes could not be a proxy for long duration liabilities or match these liabilities as an index fund. Furthermore, most pensions are weighted to long durations with an average pension fund in the 10 to 15-year average duration area. The Bloomberg Barclay’s Aggregate’s average duration is usually between four to five years … a definite mismatch to pension liabilities cash flow. Even the long Corporate or Credit index cannot match liabilities. It has two distinct rules based problems. First, it has no issues shorter than 10 years in maturity which leaves out a large and most important segment of liability cash flows. Second, it has no issues with durations longer than 17 years. This is an inappropriate proxy for any pension’s liabilities. It is not the average duration you are trying to match and monitor but the entire liability term structure (liability cash flows). Once again only a Custom Liability Index is the proper fit as a liability benchmark.
Liability Beta Portfolio™ (LBP)
If the Beta portfolio is the portfolio that matches the index objective (Index Fund) then given a liability objective, the proper liability Beta portfolio is … the portfolio that matches the liability objective (Liability Index Fund). To be accurate, you must fund each monthly liability payment.
The Ryan ALM LBP is a cash flow matching portfolio that matches and funds monthly liability cash flows chronologically. Our LBP is a cost optimization model that will produce the optimal lowest cost portfolio to fund the target liability cash flows. Our LBP should reduce funding costs by about 2% per year (1-10 year liability schedule = 20% funding cost savings)! Moreover, the LBP will outyield the CLI thereby providing liability Alpha similar to the yield difference which enhances the funded status. The Ryan ALM LBP should also mitigate interest rate risk (similar duration and term structure matching) and reduce pension expense, the volatility of the funded status and contributions.
The intrinsic value in bonds is the certainty of their cash flows. We urge pensions to use bonds for their value… to match bond cash flows that fund liability cash flows. We do not view bonds as performance vehicles or Alpha assets. They are best as liquidity assets to fund liabilities as they come due. By bifurcating liquidity assets from growth assets (Beta vs. Alpha assets) you BUY TIME for the Alpha assets to grow unencumbered. Many pensions use a “Cash Sweep” where they take away income from all asset classes to fund benefits + expenses (B+E). According to S&P 500 data, dividends reinvested accounted for: 47% of rolling 10 years returns since 1940. So let the bond allocation (liquidity assets) fund B+E which will buy time for the Alpha assets to grow significantly more.
“An error is not a mistake until you refuse to correct it” John F. Kennedy
How To De-risk a Pension
Risk is best defined as the “uncertainty” of meeting the client objective. The pension objective is to fund liabilities in a cost-effective manner such that contribution costs remain low and...
Source: How To De-risk a Pension
Risk is best defined as the “uncertainty” of meeting the client objective. The pension objective is to fund liabilities in a cost-effective manner such that contribution costs remain low and stable. Pension plans also want to de-risk their plans over time. The lowest risk assets for a pension are those that match the liability benefit payment schedule with certainty. By definition, Treasury zero-coupon bonds (STRIPS) and annuities would be the lowest risk assets for pension since they have a known future value… but they tend to come at a high cost since they are low yielding (STRIPS) or have high fees (annuities). Given that the pension objective is to secure benefit payments in a cost-efficient manner, then solving for cost while matching and fully funding the liability payment schedule would be the ideal way to de-risk a pension.
A pension liability benefit payment schedule is a term structure or yield curve often referred to as the liability cash flow. In order to match or de-risk each pension liability payment requires a matching cash flow from assets. Only bonds (and annuities) produce a certain cash flow. That is why bonds have been used for decades as the best way to defease, immunize, and de-risk a pension plan.
Problems with Hedges
Duration-matching strategies (Immunization), Interest Rate Swaps, futures, derivatives, risk overlays, etc. are all hedging tools to help assets match the liability growth rate. They are NOT de-risking strategies since they do not match the liability cash flows. Duration matching has several difficult, if not erroneous, data gathering choices it uses:
Average duration of liabilities
Where do you get the average duration of liabilities? Most, if not all, actuarial reports do not provide this calculation. Moreover, they usually do not provide the projected liability benefit payment schedule which you would need to calculate duration. In addition, actuarial reports are, at a minimum, annual reports usually three to six months delinquent so there would be serious delayed information. The duration calculation is at a precise moment in time… like a balance sheet. As time and interest rates change… so will duration. Only A Custom Liability Index (CLI) based on each pension’s unique liability benefit payment schedule could provide an accurate and monthly duration profile.Discount Rates
Since the duration of liabilities changes with interest rates (discount rates) this calculation needs to be refreshed and updated on a frequent and accurate basis. According to pension accounting rules (FAS 158, GASB 67) and federal funding standards (PPA – MAP 21 and spot rates) there is an assortment of discount rates required to price liabilities. Which one is best? The FASB accounting language says it best… you are use a discount rate that settles the liability payments. This means discount rates you can buy to settle or defease the liability payment schedule. ASC 715 comes the closest by using an AA corporate bond yield curve. Treasury STRIPS would be ideal, but no one seems to favor this approach since STRIPS are low yielding causing the present value of liabilities to be higher. The yield difference in these discount rates could be significant. Any difference in yield creates a difference in the calculation of duration and liability growth rates.Generic Bond Indexes
A common proxy for the average duration of liabilities is to use a generic bond market index… usually the Barclay’s long corporate index. Such a proxy creates several erroneous data issues. This index has no bonds shorter than 10 years and no durations longer than 16 years. This certainly does not represent any pension liability schedule even if the average durations were similar. Accounting standards and actuarial practices price liabilities as a portfolio of zero-coupon bonds with a single average discount rate based on the present value of this zero-coupon liability portfolio. There are no generic bond indexes that use zero-coupon bonds as their portfolio. There are no generic bond indexes that use pension discount rates in accordance with FASB, GASB and PPA guidelines. Each pension plan’s liabilities are different and unique to that plan due to a different labor force, salaries, mortality, and plan amendments. There is no way any generic bond market index could represent any pension plan liability term structure.Only a Custom Liability Index could properly represent and measure any pension plan’s liabilities providing all of the critical data calculations needed to de-risk the plan. In 1991, Ron Ryan designed the first Custom Liability Index (CLI). Based on each client’s unique projected liability benefit payment schedule, Ryan ALM produces monthly CLI reports on:
Structure (Present Value, Average Duration, YTM, Price, etc.)Growth Rate (Liability growth for month, year, and since inception)
Interest Rate Sensitivity (PV change in % and $ given rate changes)
Interest Rate Sensitivity
Every 1 year of duration difference between the liability proxy and the actual duration of each plan’s benefit payment schedule would represent a 1% mismatch in liability growth for every 100 bps of discount rate change. In truth, the duration mismatch is more likely to be three to five years rather than one year. Given that pension cost for the actuary, administration, asset managers, and consultant are usually less than 50 bps a year; such a duration mismatch could be very costly representing years of pension cost.
Funding Liabilities
Imagine a 12-year average duration liability benefit payment schedule. It could have many different term structure shapes to come up with an average 12-year average duration. Imagine 100% of the assets in a 12-year duration bond portfolio. If interest rates rose 50 basis points in one-year, total assets and liabilities supposedly would both have a -6% price return (interest rate movement x duration (as a negative number). If they had the same income return = 5% they would match again. However, if the duration matching assets are used to fund liabilities as they come due then a -1% loss (-6% + 5% = -1%) on assets could be funding a short liability which will have a small positive growth rate. So, the assets could be taking a loss each year to fund the next liability payment if interest rates continue to rise. This could get to be a serious costly mismatch if interest rates continue their secular trend to higher rates for the next few years. But the point is……there is no cash flow match here, only a duration match so there is both a funding and interest rate risk!
Derivatives
Interest rate swaps and futures are contracts not assets. There is no cash flow or funds available to make the liability cash flow payments. They are certainly NOT de-risking strategies but hedges vs. the liability growth rate. In fact, these strategies introduce more risk: counter party risk, interest rate risk, non-matching risk of assets purchased (usually equities) vs. liabilities, and leverage. In addition, interest rate swaps and futures have all of the problems associated with a liability proxy data gathering… as listed with duration matching.
Solution: Cash Flow Matching
As stated in the beginning, matching the liability benefit payment schedule (liability cash flow) at the lowest cost is the ideal way to de-risk a pension plan. Ryan ALM built a liability cash flow matching product, named the Liability Beta Portfolio™ (LBP), as a cost optimization model that matches the liability benefit payment schedule at the lowest cost given the investment policy restrictions of our clients.
The LBP provides about a 2% per year funding cost savings (1-15 years = 30%). This is a serious cost reduction and should be a major consideration of any de-risking strategy. Yes, the LBP model has some credit risk but very small since we are using investment grade corporate bonds with a credit filter (no bonds on negative watch list) plus the cost savings provides a large value-added cushion.
The funded ratio should dictate the allocation to bonds. A surplus should have a high allocation to bonds matched to liabilities and vice versa for a deficit funded status. Unfortunately, asset allocation did not respond to the surplus status in the 1990s which led to the US pension crisis. With funded ratios at 120% and above then, why didn’t pensions immunize and secure this victory? Amazingly, instead of increasing their bond allocation in response to a growing funded ratio they reduced it consistently because of low interest rates to the lowest bond allocations in modern history by 1999.
The allocation to bonds should determine how much of the liabilities we can cash flow match (i.e. a 25% bond allocation might fund the next seven years of gross liabilities). Ryan ALMrecommends: funding the next 10 years of Retired Lives on a net liability basis (after contributions). Indeed, current assets fund the net liabilities not the gross liabilities. Our LBP model will calculate with precision the cost to fund liabilities (gross or net) in a cost-effective manner either as a % of total liabilities or liabilities chronologically, as both methods will de-risk the plan gradually. There are advantages for each method.
Since liabilities are funded initially by contributions, using the LBP model to cash flow match net liabilities chronologically may be able to fund more liabilities than you think. Assume that a 20% bond allocation could match the next 10 years of net liability payments chronologically. Based on the Ryan ALM Liability Beta Portfolio™ (LBP) model we show a cost savings of about 20% on cash flow matching the first 10 years of liabilities, in this interest rate environment.
Matching liabilities chronologically should also buy time for the non-bond assets (Alpha assets) to perform and outgrow liabilities. Given time (7-10 years) most non-bond asset classes tend to outperform bonds. Since liabilities behave like bonds there is a high probability that non-bond asset classes could outperform vs. liability growth over an extended time horizon.
Since the pension objective is a cost focus, cash flow matching a % of total liabilities would produce the optimal cost savings since the longer the bond the less it costs given the same future value. Our LBP model is back tested since 2009. Every $1 billion in bonds used in our LBP model could save about $200 million in cost savings on a 1-10 year liability schedule and $400 million on a 1-20 year liability schedule.
Asset Allocation (AA)
Pension consultants and plan sponsors should consider installing an LBP as the core portfolio in asset allocation and as the liquidity assets to fund liability cash flows chronologically. The intrinsic value in bonds is the certainty of their cash flows. Bonds are usually not considered performance assets (Alpha assets) especially vs. pension liabilities which behave like bonds. Cash flow matching liabilities chronologically will buy time for the Alpha assets (non-bonds) to perform vs. liability growth, thereby enhancing the funded ratio. Such excess returns should be transferred over to the Liability Beta Portfolio™ (LBP) to de-risk more and more liabilities… Portable Alpha. Had this portable Alpha discipline been in place during the decade of the 1990s when funded ratios grew to their highest historical levels with true economic surpluses… there would be no U.S. pension crisis today!
Nota Bene (Note Well)
Please note that the definition of risk used in this article is in sharp contrast to the traditional approach produced by the Nobel Prize winner Ph.D. William F. Sharpe back in 1966. Professor Sharpe proposed that risk is the volatility of total returns and that the three-month T-Bill was the default risk-free rate. He developed the Sharpe Ratio as a means of calculating the risk-adjusted return by subtracting the return of the three-month T-Bill from the mean return of the asset(s) being analyzed and dividing the net return by the volatility of the return of the asset(s) in review. For many decades the Sharpe Ratio was the standard measurement of risk-adjusted returns. In 1994 Prof. Sharpe called me and invited me to Stanford to discuss our unique Custom Liability Index data and reports. I had the unique pleasure to meet and debate with one of the finest intellects I have ever met.
I proposed that risk is not a generic measurement but based on each client’s objective. I referenced pensions where every client’s liabilities are different (like snowflakes). As proof, I asked Professor Sharpe what is the risk-free asset for a 10-year liability payment? Professor Sharpe answered… a 10-year Treasury zero-coupon bond. Prof. Sharpe identified that the three-month T-Bill would have 39 reinvestment moments of uncertainty, so there is no way the three-month T-Bill could match a 10-year liability future value with any certainty and would become a risky asset. Our discussion led to Prof. Sharpe re-inventing the Sharpe Ratio in 1994 to include the benchmark objective instead of the three-month T-Bill in the numerator and denominator such that the average return of the asset portfolio is reduced by the average return of the objective (numerator). This net average return is then divided by the standard deviation of the asset portfolio excess return vs. the objective return. This is commonly called today… the Information Ratio.
Ryan ALM Pension Alert Q2’23
Most Asset Allocations for pensions are based on achieving the ROA. The ROA is an annual forecast of asset returns. Each asset class is assigned a ROA then weighted by...
Source: Ryan ALM Pension Alert Q2’23
Spread between ROA and Bonds Narrowest in 20+ Years
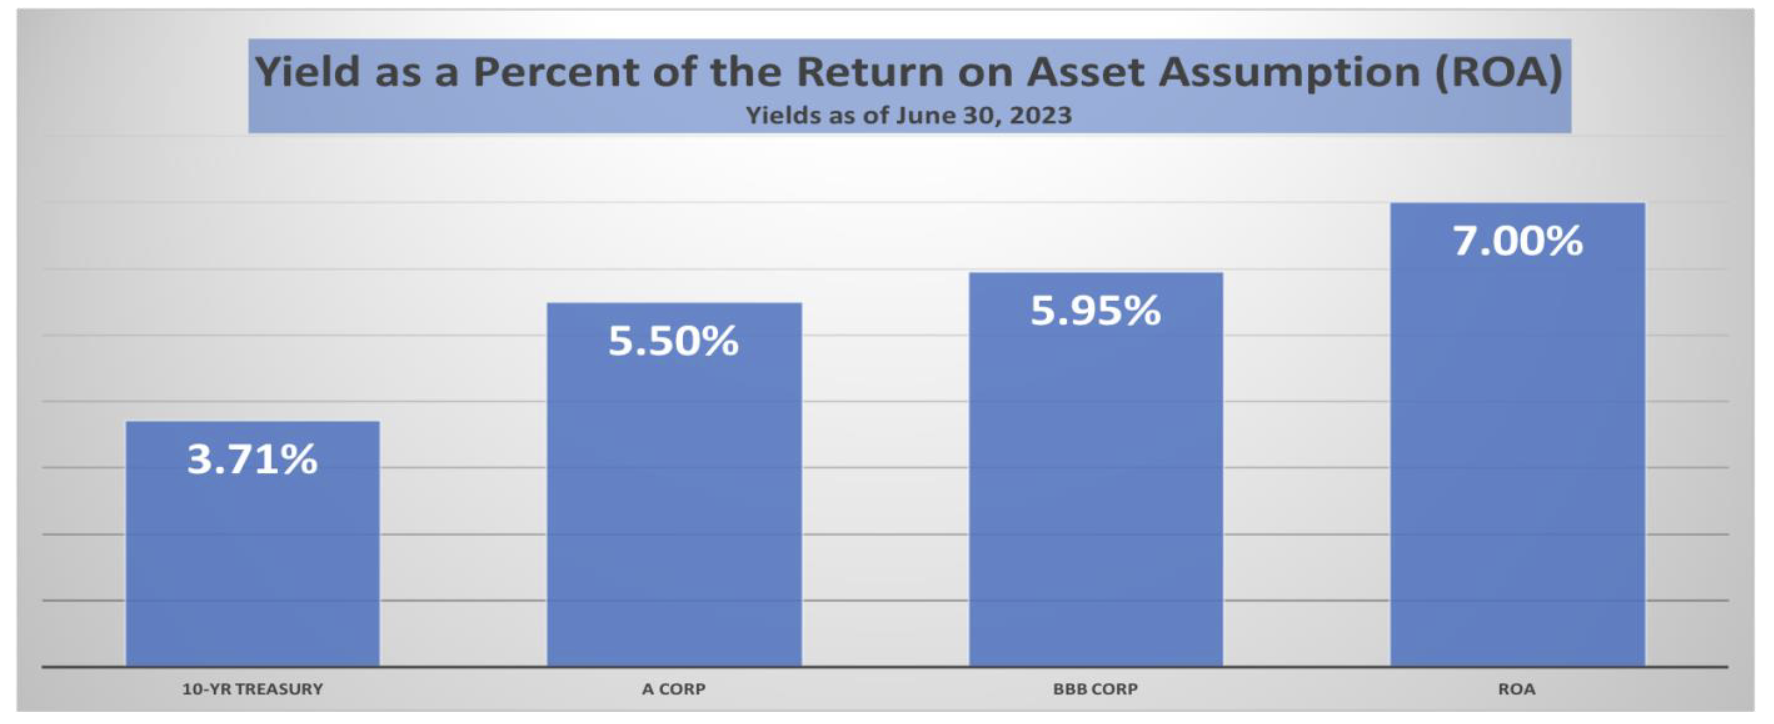
Most Asset Allocations for pensions are based on achieving the ROA. The ROA is an annual forecast of asset returns. Each asset class is assigned a ROA then weighted by the target allocation to get an average or target ROA. Currently, the ROA for most Public pensions is around 7.00%. Yields on A and BBB corporates have risen significantly in the last two years and are now fast approaching the ROA target return. With A and BBB corporate yields at 78.6% to 85.0% of the ROA, a strong argument should be made to increase the allocation to fixed income. The 2023 Milliman Public Funding Survey suggests that the ROA will continue its trend lower. With the Milliman 2024 estimate of a 6.75% ROA, A and BBB corporate bonds would approach 81.5% to 88.2% of the target return. Ryan ALM recommends using bonds for their intrinsic value… the certainty of their cash flows. Cash flow matching liabilities chronologically would be in harmony with the true objective of a pension… to secure the promised benefits in a cost-efficient manner with prudent risk.
Benefits of Higher Bond Allocation to Cash Flow Matching:
Improve Liquidity
Outyield ROA = liability Alpha
Reduce Volatility (risk) of Funded Ratio
Create CORE portfolio as anchor to earning ROA
Reduce costs to fund Benefits + Expenses (B + E)
Buy TIME for performance assets to grow unencumbered