

Ryan ALM
White Papers
Pension Doctor: Specialist or Generalist?
Pension Doctor: Generalist or Specialist When a person gets sick or has an injurythey go see a doctor. Usually, they prefer to see a Specialist who is the recognized expert...
Source: Pension Doctor: Specialist or Generalist?
When a person gets sick or has an injurythey go see a doctor. Usually, they prefer to see a Specialist who is the recognized expert on the ailment they have rather than a Generalist who has less expertise related to this particular medical condition. Well, the same should be true for pensions. If a pension plan needs a certain strategy to help enhance (cure) the funded status, they call in a specialist for that strategy.
Given that the true objective of a pension is to fully fund benefits and expenses (liabilities) in a cost-efficient manner with prudent risk plan sponsors and their advisors should be dialing up a risk mitigation specialist, such as Ryan ALM. For more than 50 years, our cash flow matching (CFM) strategy is the best fit and proven strategy for the pension objective. CFM provides an accurate and timely match of monthly asset cash flows to fully fund monthly liability cash flows. The CFM is a portfolio of investment grade bonds. The intrinsic value in bonds is the certainty of their cash flows (only asset class with such certainty).
Bond math teaches us that the longer the maturity and the higher the yield… the lower the cost. The Ryan ALM cash flow matching product is a cost optimization model that fully funds monthly liability cash flows at a cost savings of about 2% per year in this interest rate environment. We call our CFM model the Liability Beta Portfolio (LBP). The LBP should be the core portfolio of any DB pension and replace active fixed income management, which is highly susceptible to changes in rates. By matching and funding liabilities chronologically, the LBP buys time for the Alpha or performance assets (non-bonds) to grow unencumbered. By working in harmony with the Alpha assets the plan can gradually enhance its funded status and stabilize contribution costs. There are numerous benefits to a CFM strategy:
No need for cash sweep as LBP provides the liquidity to fully fund liabilities
Secures benefits for time horizon LBP is funding (1-10 years)
Buys time for performance assets to grow unencumbered
Outyields active bond management… enhances ROA
Reduces Volatility of Funded Ratio/Status
Reduces Volatility of Contribution costs
Low Investment Advisory Cost = 15 bps
Reduces Funding costs (2% per year)
Mitigates Interest Rate Risk
We urge pensions to use CFM as the core portfolio strategy to achieve their true objective. To our knowledge Ryan ALM is the only firm that specializes in CFM… our only product.
When is a Pension Fully Funded?
The Funded Ratio tends to be the acid test and benchmark for funded status… but is it? We have written several research white papers (www. RyanALM/Research/White Papers) about the glaring...
Source: When is a Pension Fully Funded?
The Funded Ratio tends to be the acid test and benchmark for funded status… but is it? We have written several research white papers (www. RyanALM/Research/White Papers) about the glaring issues with the Funded Ratio. Here are just a few of the inconsistencies with the Funded Ratio:
Actuarial Value versus Market Value
The Funded Ratio (FR) of a pension is usually based on the actuarial value of assets / actuarial value of liabilities. The Funded Status (FS) is the actuarial value of assets – actuarial value of liabilities. Actuarial values are different than market values… sometimes quite different. Market values are the better measurement of economic reality since you can’t spend actuarial dollars. As a result, this valuation difference can seriously distort the FR and FS calculation.
Present Value versus Future Value
Notably, the FR and FS are present value calculations. But pension liability cash flows (benefits + expenses (B+E)) are future value (FV) projections. Since the FV of most assets is not known this becomes a true pension conundrum. Bonds are the only asset class with a known and certain future value. That is why bonds have been the chosen asset class for defeasance, immunization and cash flow matching for several decades. The disconnect between PVs and FVs haunts pensions. The true objective of a pension is to secure and fully fund liability cash flows in a cost-efficient manner with prudent risk. As a result, the objective should be for asset cash flows to match and fully fund liability cash flows.So, when is a pension fully funded... when asset cash flows (future values) fully fund liability cash flows (future values). This is best accomplished thru cash flow matching and is best measured by the Asset Exhaustion Test.
Contributions = MIA
The FR and FS both ignore contributions as an asset. The truth is that contributions are future assets and should be a high consideration in any asset liability management (ALM). We recommend using the Ryan ALM modified Asset Exhaustion Test (AET) as the best way to measure the solvency and funding status of a pension. We take asset cash flows (based on a ROA) and compare them to NET liability cash flows (benefits + expenses – contributions) to understand if assets can fully fund the liability cash flows. We use a matrix of ROAs to determine what ROA is the best fit. This calculated ROA is in sharp contrast to the current ROA that is based on an asset allocation model that ignores the FR and FS. It is common that a pension plan with a 60% funded ratio and another funded at 90% have the same or similar ROA. How is this possible? Shouldn’t the 60% funded plan need assets to work harder? Yes, but that does not have anything to do with the current ROA calculation. Whatever shortfall there is in asset cash flows to fund liability cash flows (B+E) must be paid by higher contributions… this is not in the best interests of a pension plan and the sponsor’s budget. Clearly, the current ROA is not a calculated return based on the FR and FS that will guarantee a fully funded
status if achieved long-term… nor will it guarantee that contributions will go down. This has been a sad and costly trend for the last 25+ years.
Discount Rates
A most troubling issue is what discount rate to use. FASB and GASB tend to disagree on this.
FASB = high quality AA corporate zero-coupon yield curve
GASB = ROA
Since the ROA is a much higher rate (usually 100 to 200 bps) then liabilities would be priced at a much lower PV (12% to 24%). This would enhance the FR by 8% to 22%. Market rates are best in determining the market or economic value of liabilities. FASB 144 says it well:
“The objective of selecting assumed discount rates is to measure the single amount that, if invested at the measurement date in a portfolio of high-quality debt instruments, would provide the necessary future cash flows to pay the pension benefits when due. Notionally, that single amount, the projected benefit obligation, would equal the current market value of a portfolio of high-quality zero coupon bonds whose maturity dates and amounts would be the same as the timing and amount of the expected future benefit payments. The determination of the assumed discount rate is separate from the determination of the expected rate of return on plan assets”
Ryan ALM Solutions:
Custom Liability Index (CLI): The first step in prudent pension management is to calculate the liability cash flows that assets must fund. This should be a net liability cash flow (benefits + expenses – contributions). Until liabilities are monitored and priced as a Custom Liability Index (CLI) the asset side is in jeopardy of managing to the wrong objectives (i.e. ROA and generic market indexes). Only a CLI best represents the unique liability cash flows of a plan sponsor. Just like snowflakes, no two pension liability schedules are alike due to different labor forces, salaries, mortality and plan amendments. How could a static ROA or genericmarket indexes ever properly represent the risk/reward behavior of such a diverse array of pension liabilities? Once the CLI is installed, the pension can now know the true economic Funded Ratio and Funded Status which should dictate the appropriate Asset Allocation, Asset Management and Performance Measurement.
Asset Exhaustion Test (AET): GASB requires a test of solvency (AET) to document that the asset cash flows (at the ROA) will fully fund the net liability cash flows (benefits + expenses – contributions). GASB correctly understands that assets are funding net liabilities after contributions… and that contributions are future assets. This net liability is rarely focused on by the asset side in asset allocation. Ryan ALM enhances the asset exhaustion test by calculating the ROA that will fully fund net liability cash flows. Usually, we find that a lower ROA can accomplish this goal and is a better fit than the current ROA. This would suggest a more conservative asset allocation and a heavier allocation to fixed income to defease liability cash flows chronologically. This is a common and serious issue. This calculated ROA should be the asset allocation model focus. We urge all pensions to incorporate this modified AET before acting on asset allocation.
Liability Beta Portfolio™ (LBP):The intrinsic value in bonds is the certainty of its cash flows. That is why bonds have been used for decades to defease liability cash flows. The core or Beta portfolio for a pension should be in investment grade bonds that cash flow match and fully fund liabilities chronologically thereby buying time for the growth (Alpha) assets to outgrow liabilities and erase the deficit. The proper Beta portfolio for any liability objective should be… a Liability Beta Portfolio™. Ryan ALM has developed a LBP which will cash flow match liabilities chronologically and reduce funding costs by about 2% per year (1-10 years = 20%) as well as reduce the volatility of the Funded Status and contribution costs. The LBP should be the core portfolio of any pension and replace active fixed income management. By matching and funding liabilities chronologically, the LBP buys time for the growth or Alpha assets (non-bonds) to perform. By working in harmony with the Alpha assets the plan can gradually enhance its funded status and reduce contribution costs.
Liability Alpha Assets: The non-bond assets should be managed vs. the CLI to exceed liability growth (earn liability Alpha) and enhance the economic Funded Status. The goal here is outgrow liabilities in $s (relative returns) by enough to erase the deficit over a time horizon equal to the average life (duration) of liabilities (calculated by the CLI). As the Alpha assets achieve the required annual Alpha, any excess returns vs. liability growth should be ported over to the Liability Beta Portfolio™ to secure the victory. Had this been in place during the decade of the 1990s when pensions had surpluses… there would be no pension deficits today.
Pension Conundrum: Same or Similar ROA
The Funded Ratio (FR) of a pension is usually based on the actuarial value of assets / actuarial value of liabilities. The Funded Status (FS) is the actuarial value of...
Source: Pension Conundrum: Same or Similar ROA
The Funded Ratio (FR) of a pension is usually based on the actuarial value of assets / actuarial value of liabilities. The Funded Status (FS) is the actuarial value of assets – actuarial value of liabilities. Actuarial values are different than market values… sometimes quite different. Notably, the FR and FS are present value calculations. But pension liability cash flows (benefits + expenses (B+E)) are future value (FV) projections. The disconnect between PVs and FVs haunts pensions. We have written several research papers about this glaring issue.
The return on assets (ROA) assumption is not based on the funded ratio or funded status. Instead, it is based on the expected return from the pension plan’s asset allocation. The same or similar asset allocation will produce the same or similar ROA focus. This brings up the question from my title – how could 60% and 90% pension funded plans have the same ROA? Shouldn’t the 60% funded plan require assets to work harder? Yes, but that does not have anything to do with the ROA calculation. Whatever shortfall there is in asset cash flows to fund liability cash flows (B+E) must be paid through higher contributions. As a result, the ROA is not a calculated return that will guarantee a fully funded status if achieved long-term… nor will it guarantee that contributions will go down.
Ryan ALM Solutions:
Custom Liability Index (CLI): The first step in prudent pension management is to calculate the liability cash flows that assets must fund. This should be a net liability cash flow (benefits + expenses – contributions). Until liabilities are monitored and priced as a Custom Liability Index (CLI) the asset side is in jeopardy of managing to the wrong objectives (i.e. ROA and generic market indexes). Only a CLI best represents the unique liability cash flows of a pension plan. Just like snowflakes, no two pension liability schedules are alike due to different labor forces, salaries, mortality and plan amendments. How could a static ROA or genericmarket indexes ever properly represent the risk/reward behavior of such a diverse array of pension liabilities? Once the CLI is installed, the pension fund will now know the true economic Funded Ratio and Funded Status, which should dictate the appropriate Asset Allocation, Asset Management, and Performance Measurement.
Asset Exhaustion Test (AET): GASB requires a test of solvency (asset exhaustion test) to document that the asset cash flows (at the ROA) will fully fund the net liability cash flows (benefits + expenses – contributions). GASB correctly understands that assets are funding net liabilities after contributions… and that contributions are future assets. This net liability is rarely shown or focused on by the asset side in asset allocation. Ryan ALM enhances the asset exhaustion test by calculating the ROA that will fully fund net liability cash flows. Usually, we find that a lower ROA can accomplish this goal than the current ROA target. This would support a more conservative asset allocation and a heavier allocation to fixed income to defease liability cash flows chronologically. This is a common and serious issue. This calculated ROA should drive asset allocation decisions. We urge all pensions to incorporate the AET before acting on asset allocation.
Liability Beta Portfolio™ (LBP):The intrinsic value in bonds is the certainty of its cash flows. That is why bonds have been used for decades to defease liability cash flows. The core or Beta portfolio for a pension should be in investment grade bonds that cash flow match and fully fund liabilities chronologically thereby buying time for the growth assets to outgrow liabilities and erase the deficit. The proper Beta portfolio for any liability objective should be… a Liability Beta Portfolio™. Ryan ALM has developed an LBP which will cash flow match liabilities chronologically and reduce funding costs by about 2% per year (1-10 years = 20%), as well as reduce the volatility of the Funded Status and contribution costs. The LBP should be the core portfolio of any pension fund and replace active fixed income management, which is subject to great interest rate risk. By matching and funding liabilities chronologically, the LBP buys time for the growth or Alpha assets (non-bonds) to perform. By working in harmony with the Alpha assets the plan can gradually enhance its funded status and reduce contribution costs.
Liability Alpha Assets: The non-bond assets are managed vs. the CLI to exceed liability growth (earn liability Alpha) and enhance the economic Funded Status. The goal here is outgrow liabilities in $s (relative returns) by enough to erase the deficit over a time horizon equal to the average life (duration) of liabilities (calculated by the CLI). As the Alpha assets achieve the required annual Alpha, any excess returns versus liability growth should be ported over to the Liability Beta Portfolio™ to secure the victory. Had this been in place during the decade of the 1990s when pensions had surpluses… there would be no pension deficits today.
What’s It All About? Liabilities!
Most institutional assets are required to fund some type of liability objective (Pensions, OPEB, Lottery, Endowment & Foundation) yet liabilities tend to be missing in every function related to assets:...
Source: What’s It All About? Liabilities!
Most institutional assets are required to fund some type of liability objective (Pensions, OPEB, Lottery, Endowment & Foundation) yet liabilities tend to be missing in every function related to assets:
Asset Allocation – is focused on achieving an absolute rate of return (ROA) which has nothing to do with a liability objective. The proof: how could a 60% and a 90% funded pension plan have the same or similar ROA? Wouldn’t the 60% funded plan have to work harder? This common focus is really assets versus assets (as measured by some index benchmarks) and not assets versus liabilities.
Asset Management – most asset classes are given some generic index benchmark as their return focus. Obviously no generic index could ever represent the unique liability cash flows of each client.
Performance Measurement – once again we have assets versus assets (generic index benchmarks). If an asset class outperforms its generic index benchmark does that mean assets have outgrown liability growth? Of course not! This is again a complete disconnect which plaques most institutional comparisons.
Solutions:
Ryan ALM has developed a turnkey system of products that are a best fit to achieving the true liability objective of institutions:
Custom Liability Index (CLI) – In 1991, the Ryan team developed the CLI as the proper benchmark for any liability objective. The CLI is a monthly report that calculates what liability cash flows assets must fund. For pensions, this is usually the net monthly liability cash flows (after contributions). The CLI is in harmony with clients’ actuarial projections since that is the data used to construct the CLI.
Liability Beta Portfolio™ (LBP) – The LBP is our proprietary cash flow matching (CFM) model which will fully fund monthly net liability cash flows at a low cost to our clients. Usually, the LBP will reduce funding costs by roughly 2% per year (20% for 1-10 years). Our LBP is a good fit as the liquidity assets so there is no need for a cash sweep that takes income from all asset classes to fund benefits + expenses (B+E). Since the LBP is focused on liability cash flows (future values or FV) it mitigates interest rate risk as well because FVs are not interest rate sensitive.
Performance Attribution Report (PAR) – Our proprietary PAR product provides 14 risk/reward calculations of the LBP versus the CLI, providing even more evidence of value added (in addition to cost savings + mitigation of interest rate risk) since our LBP should outyield and outgrow the CLI.
Asset Exhaustion Test (AET) – Our AET will calculate the true ROA needed to fully fund net liability cash flows. Quite often this calculated ROA is much lower than the current ROA used for asset allocation. Developing an AET should be a first step in the asset allocation process in determining the allocation to the liquidity bucket (LBP assets).
Observations:
The intrinsic value in bonds is the certainty of their cash flows. Bonds are the only asset class with certainty of their cash flows. That is why bonds have been the logical choice for Dedication and Defeasance using Cash Flow Matching (CFM) strategies since the 1970s. Only CFM is a best fit for any liability driven objective. The primary objective of a pension is to secure benefitsin a cost-efficient manner. Our CFM product (LBP) will secure and fully fund benefits by matching asset cash flows monthly versus liability cash flows. This matching process is done chronologically for as far out as the plan sponsor deems necessary.
Furthermore, it would be wise to separate liquidity assets (liability Beta assets) from growth assets (liability Alpha assets). The Beta assets should be the bond allocation to cash flow match the net liability cash flows (after contributions) chronologically for a target horizon. This will buy time for the risky assets (Alpha) to grow unencumbered since you have certainty of the Beta assets’ cash flows for as long a period as you want. A study of S&P data by Guinness Global highlights that dividends and dividends reinvested account for about 47% of the S&P 500 total return on rolling 10-year periods dating back to 1940 and 57% for 20-year horizons. So why would you want to dilute equity returns with a cash sweep? Since we are dealing with net liabilities (after contributions) a 15% LBP allocation may fund liabilities out to 10-years or more, especially given the higher U.S. interest rate environment.
Observations and Benefits of LBP:
No change in Cash and Bond allocation
No dilution of Alpha assets to fund B + E
Reduces funding costs by about 2% per year
Mitigates interest rate risk (funding future values)
Secures + fully funds monthly B+E chronologically
Eliminates the need for a cash sweep which dilutes equity returns
LBP will out yield current bond managers and enhance the ROA
Cash flow matching buys time for Alpha assets to grow unencumbered
Generic bond indexes cash flows look nothing like the projected benefit payment schedule
This leads to a mismatch of cash flows and risk/reward behaviors… serious issues over time
Alpha assets need time to perform without any dilution of their cash flows to pay benefits so they shouldn’t be a source of liquidity. Use CFM as the liquidity assets.
Logic:
Let the performance assets (Alpha assets) perform by growing unencumbered as the liquidity assets (Beta assets) provide cash flows sufficient to fully fund benefits plus expenses chronologically.
Bond Yields… Caveat Emptor
Most bonds are priced and traded on some yield calculation. These yield calculations are based on assumptions that are difficult, if not impossible, to achieve. For example: Yield to Maturity...
Source: Bond Yields… Caveat Emptor
Most bonds are priced and traded on some yield calculation. These yield calculations are based on assumptions that are difficult, if not impossible, to achieve. For example:
Yield to Maturity (YTM) assumes you will reinvest every six months at the purchase YTM until maturity of the bond. How could this happen? Yields are changing every day, and will you reinvest exactly every six months into the same maturity and same YTM? Sounds like Mission Impossible! In fact, the reinvestment rate on any bond is based on the total return of what you reinvested into. Yes, it is possible to have a negative reinvestment rate if you reinvested into a security with a negative total return. Moreover, the longer the bond maturity… the more the reinvestment rate of return determines the yield or return to maturity. In truth, the basic value of the YTM is to determine a price for the security.
All other yields (yield to call, yield to average life, yield to worst, etc.) are based on assumptions that are most difficult to occur, if not impossible. The intrinsic value of most bonds is the certainty of their cash flows. This is what the smart investor should focus on and utilize. Remove the uncertainty that is embedded in all bond yield calculations. Bonds are the only asset class with this certainty of their cash flows. That is why bonds have been the logical choice for Dedication and Defeasance using Cash Flow Matching (CFM) strategies since the 1970s. Only CFM is a best fit for any liability driven objective (Endowments & Foundations, Lotteries, Pensions, OPEB, etc.). The primary objective of a pension is to secure benefitsin a cost-efficient manner with prudent risk. CFM will secure and fully fund benefits by asset cash flows matching and fully funding monthly liability cash flows chronologically for as far out as the plan sponsor deems necessary.
We believe that a best practice is to separate liquidity assets (liability Beta assets) from growth assets (liability Alpha assets). The Beta assets should be the bond allocation to cash flow match the net liability cash flows (after contributions) chronologically for a target horizon (we recommend 10 years). This will provide the time for risky assets (Alpha) to grow unencumbered since you have the certainty of the Beta assets cash flows for as long a period as you want. It would also be wise to take the Cash and Fixed Income allocation and apply it to a CFM allocation. Several pension plans do a cash sweep of all assets’ income to fund the monthly benefits and expenses. A study of S&P 500 data by Guinness Global has determined that dividends and dividends reinvested account for about 47% of the S&P 500 total return on rolling 10-year periods and 57% for 20-year time horizons. So why would you want to dilute equity returns by spending the dividend income? Let the cash + bond allocation fund the current monthly liability cash flows through our CFM model (Liability Beta Portfolio™ or LBP). Our LBP would match and secure benefits chronologically for as far out as the allocation of funds allows. Since we are dealing with net liabilities (after contributions) a 15% LBP allocation may fund liabilities out to 10-years. The Ryan ALM cash flow matching model is well tested showing a funding cost savings of about 2% per year or more for longer maturity programs (20% for 1-10 years) depending on the liability term structure.
The Ryan ALM LBP model is funding benefits (future values) which are not interest rate sensitive. This eliminates the largest risk in bonds. Our LBP model will usually outyield active bond managers by over 50 bps, which will also reduce costs.
Observations and Benefits of LBP:
No change in Cash and Bond allocation
No dilution of Alpha assets to fund B + E
Reduces funding costs by about 2% per year
Mitigates interest rate risk (funding future values)
Secures + fully funds monthly B+E chronologically
Eliminates the need for a cash sweep which dilutes equity returns
LBP will out yield current bond managers and enhance the ROA
Cash flow matching buys time for Alpha assets to grow unencumbered
Logic
Let the performance assets (Alpha assets) perform by growing unencumbered as the liquidity assets (Beta assets) provide cash flow sufficient to fully fund benefits plus expenses chronologically.
Operation Home Run
Pension Solution: Operation Home Run The true objective of a pension is to secure and fully fund benefits in a cost-efficient manner with prudent risk . This is best accomplished...
Source: Operation Home Run
Pension Solution:Operation Home Run
The true objective of a pension is to secure and fully fund benefits in a cost-efficient manner with prudent risk. This is best accomplished through a cash flow matching (CFM) strategy using investment grade bonds to fully fund and match monthly benefit payments at low cost. CFM has several advantages of which we label four as “Operation Home Run”:
1.Liquidity
Liquidity is a critical and necessary priority of a pension since it must fund monthly benefits + expenses (B + E) on time. Many plan sponsors use a “cash sweep” or a cash allocation strategy to provide such cash flow. Both strategies are not optimal for a pension plan. A cash sweep usually takes income or cash flow from all asset classes to fund the current monthly B+E. This can severely damage the ROA of such asset classes. According to a research report by Guinness Global since 1940, dividends and dividends reinvested have accounted for 47% of the S&P 500 total return on a 10-year rolling period and 57% on a 20-year rolling period. So, this data questions the logic of a cash sweep that uses dividends to fund benefits + expenses (B+E). A cash allocation is usually low yielding + is close to a 1:1 relationship between present value and future value which is high cost. CFM will fully fund monthly B+E in a cost-efficient manner with yields of the average duration of the CFM.
2.Security
Pensions need to secure the benefit payments as a high priority. This is best accomplished through CFM which has the certainty of asset cash flows that fully fund liability cash flows on time with the correct amount. To our knowledge only bonds and annuities have certain cash flows. This is why bonds have been chosen as the appropriate securities to defease liability cash flows for decades.
3.Time
The greatest asset of a pension is time. Most pensions have long average lives. The best way to buy time is with a CFM strategy that will defease liabilities for as long a period of time as the plan sponsor wants. S&P data proves that the longer the time horizon the higher the total return of stocks… and most risky investments. Ryan ALM recommends a CFM strategy to fund at least 1-7 years.
4.Cost
The pension objective is a liability objective and cost objective. Since liabilities are future value costs, only a CFM or annuity strategy could fund liability cash flows with certainty. The Ryan ALM CFM model will reduce funding costs by about 2% per year (20% for 1-10 years of liabilities).
Conclusion
As a best-fit to achieve the true pension objective, Ryan ALM recommends our cash flow matching (CFM) strategy to fully fund B+E in a cost-efficient manner. Our CFM model will provide timely cash flows that will fully fund B+E at the lowest cost to our clients. The benefits of our CFM model are quite substantial:
CFM will provide certainty of cash flows which eliminates liquidity risk.
CFM secures the benefit payments through the certainty of its cash flows.
CFM buys time. The longer the time, the greater the ROA for the growth assets.
CFM is a cost optimization model that reduces funding costs by about 2% per year.
CFM is an investment grade portfolio skewed to the longest maturities within the area it is funding (i.e. 1-5 years or 1-10 years) that should enhance the CFM yield versus the yield on cash reserves and active bond management.
CFM reduces reinvestment risk if interest rates trend downward (as many expect).
As a solution, Ryan ALM recommends separating liquidity assets from growth assets in asset allocation. Let bonds in a CFM strategy be your liquidity assets for the advantages mentioned above. A CFM strategy will have a longer average duration and higher yield than cash thereby reducing the cost to fund B+E. In this way the liquidity assets and the growth assets are a team that will produce the optimal solutions.
Problem/Solution: Asset-only Focus
Most, if not all asset allocation models are focused on achieving a total return target or hurdle rate… commonly called the ROA (return on assets). This ROA target return is derived from a weighting of…
Source: Problem/Solution: Asset-only Focus
Problem: Asset Only Focus on Asset Allocation
Solution: Asset Liability Management (ALM)
Most, if not all asset allocation models are focused on achieving a total return target or hurdle rate… commonly called the ROA (return on assets). This ROA target return is derived from a weighting of all asset classes forecasted index benchmark returns except for bonds which uses the yield of the index benchmark. These forecasts are based on some historical average (i.e. last 20 years or longer). As a result, it is common that most pensions have the same or similar ROA.
This ROA exercise ignores the funded status. It is certainly obvious that a 60% funded plan should have a much higher ROA than a 90% plan. But the balancing item is contributions. If the 60% funded plan would pay more in contributions than the 90% plan (% wise) then it can have a lower ROA. I guess the question is what comes first. And the answer is the ROA with contributions as a byproduct of the ROA. The actuarial math is whatever the assets don’t fund… contributions will fund.
If the true objective of a pension is to secure and fully fund benefits and expenses (B+E) in a cost-efficient manner with prudent risk, then you would think that liabilities (benefits + expenses) would be the focus of asset allocation. NO, liabilities are usually missing in the asset allocation process. Pensions are supposed to be an asset/liability management (ALM) process not a total return process. Ryan ALM recommends the following asset allocation process:
Calculate the cost to fully fund (defease) the B+E of retired lives for the next 10 years chronologically using a cash flow matching (CFM) process with investment grade bonds. CFM will secure and fully fund B+E of retired lives for the next 10 years. Then calculate the ROA needed to fully fund the residual B+E with the current level of contributions. This is calculated through an asset exhaustion test (AET) which is a GASB requirement as a test of solvency. The difference is GASB requires it on the current estimated ROA before you do this ALM process. Ryan ALM can create this calculated ROA through our AET model. If the calculated ROA is too high then either you reduce the allocation to the CFM or increase contributions or a little bit of both. If the calculated ROA is low, then increasing the allocation to CFM is appropriate. Running AET iterations can produce the desired or most comfortable asset allocation answer.
Cash flow matching (CFM) will provide the liquidity and certainty needed to fully fund B+E in a cost-efficient manner with prudent risk. The Ryan ALM model (Liability Beta Portfolio™ or LBP) will reduce funding costs by about 2% per year or 20% for 1-10 years of liabilities. We will use corporate bonds skewed to A/BBB+ issues. There has never been a bond default in the 20-year history of Ryan ALM.
Assets are a team of liquidity (bonds) and growth assets to beat the liability opponent. They should work together in asset allocation to achieve the true pension objective.
Problem/Solution: Generic Indexes
Problem: Find Pension Liabilities in any Generic Bond Index Solution: Custom Liability Index (CLI) Pension liabilities are unique to each plan sponsor… different salaries, benefits, expenses, contributions, mortality, inflation assumptions,...
Source: Problem/Solution: Generic Indexes
Problem: Find Pension Liabilities in any Generic Bond Index
Solution: Custom Liability Index (CLI)
Pension liabilities are unique to each plan sponsor… different salaries, benefits, expenses, contributions, mortality, inflation assumptions, plan amendments, etc. In an effort to capture and calculate the true liability objective, the Ryan team created the first Custom Liability Index (CLI) in 1991 as the proper pension benchmark for asset liability management (ALM). We take the actuarial projections of benefits and administrative expenses (B+E) for each client and then subtract Contributions to calculate the true liability cash flows that assets have to fund since contributions are the initial source to fund B+E. We then calculate the monthly liability cash flows as (B+E) – C. The CLI is a monthly report that includes the calculations of:
Net future values broken out by term structure
Net present values broken out by term structure
Total returns broken out by term structure
Summary statistics (yield, duration, etc.)
Interest rate sensitivity
The Ryan ALM CLI should be installed as the index benchmark for any bond manager as well as total assets. This should be the first step in asset management and asset allocation. The CLI can be broken out into any time segment that bond assets are directed to fund (i.e. 1-3 years, 1-10 years, etc.). Moreover, total assets should be compared versus total liabilities to know if the funded ratio and funded status have improved over time. If all asset managers outperform their generic index benchmarks but lose to liability growth rate (total return)… the pension plan loses and must pay a higher contribution.
Since the CLI is a monthly report, plan sponsors can compare assets versus liabilities monthly. There should never be an investment update of just assets versus assets (generic index benchmarks) which is common. It is hard to understand in today’s sophisticated finance world, that liabilities are missing as an index. The reason must be that it is extra work for each client. But it should be clear that no generic bond index could ever properly represent the liability cash flows that assets are required to fund. It is apples versus oranges.
“Given the wrong index benchmark… you will get the wrong risk/reward”
The Pension Crisis of 2000-02
In my 2013 book “The U.S. Pension Crisis” I detailed the causes of the 2000-02 pension crisis where funded ratios deteriorated significantly from a surplus position in the 1990s. This...
Source: The Pension Crisis of 2000-02
In my 2013 book “The U.S. Pension Crisis” I detailed the causes of the 2000-02 pension crisis where funded ratios deteriorated significantly from a surplus position in the 1990s. This created a spike in contribution costs for many years which I labeled as the U.S. pension crisis… it was actually a contribution cost crisis. Contribution costs for many pensions rose quickly by 5x to 10x or even more in a short period of time. This led many cities and states into a budget shock and some even filed for bankruptcy (i.e. Detroit, Harrisburg, Jefferson County, Stockton).
The major cause of this dilemma, I reasoned, was the asset allocation objective of achieving a ROA (about 8.00% then). This was in sharp contrast and conflict with the true pension objective… to fund benefits (liabilities) in a cost-effective manner with prudent risk.
With funded ratios in a surplus position in the late 1990s. most pension plans could have defeased their liabilities with a bond allocation that used a cash flow matching (CFM) strategy. This CFM strategy would have secured benefit payments and kept contribution costs very low. This used to be called Dedication in the 1970s and 1980s and was a widespread strategy then. CFM gives certainty that the asset cash flows will fully fund the liability cash flows at the lowest cost to the plan sponsor. But because interest rates were well below the ROA of 8.0% in the late 1990s, asset allocation models heavily skewed their weights to equities and other non-bond risky assets to try to earn this 8.0% ROA hurdle rate.
When the equity correction hit in 2000 it was quite severe for pensions. Not only did the equity assets have negative growth but due to a secular decline in interest rates from 1982 this translated into high pension liability growth since they behave like bonds. According to Federal Reserve calculations, the average asset growth for public pensions underperformed the average liability growth by about 73% in the period 2000-02 as follows:
| Assets | Liabilities | Difference | Cumulative | |
|---|---|---|---|---|
| 2000 | -2.50% | 25.96% | -28.46% | -28.46% |
| 2001 | -5.40% | 3.08% | -8.48% | -37.60 |
| 2002 | -11.41% | 19.47% | -30.88% | -73.40% |
2000AssetsLiabilitiesDifferenceCumulative2000-2.50%25.96%-28.46%-28.46%2001-5.40%3.08%- 8.48%-37.602002-11.41%19.47%-30.88%-73.40%
This underperformance caused pension funded ratios to go from a nice surplus to a deep deficit creating the spike in contribution costs. According to the Federal Reserve System data the average funded ratio for state pension funds was 58.9% as of 2002 from a surplus position in 1999.
for their asset allocation models. According to the 2024 Milliman study the average asset allocation for public pensions is skewed to equities at 76% with bonds at 21% down from 24% 10 years ago.
Given the performance of equities in recent years, we may be nearing a correction similar to 2000-02 based on some key criteria:
Reversion to the Mean
This is a common and logical concept. The S&P 500 has a mean return of 9.75% for 20 years and 9.90% for 30 years with dividends. The last 5 years has a mean return of 11.33% and 10 years = 12.39%. This suggests a possible negative growth for the near future to revert to the mean.
P/E Multiple
Valuation is another key determinant. Based on forward earnings, the current forward P/E for the S&P 500 is around 24.26x today. The graph below by Yardeni shows it at 21.7x on Jan. 23. The point here is that the forward P/E today is above the median P/E of 20.1x and is near a 25 year high which happened in 2000.
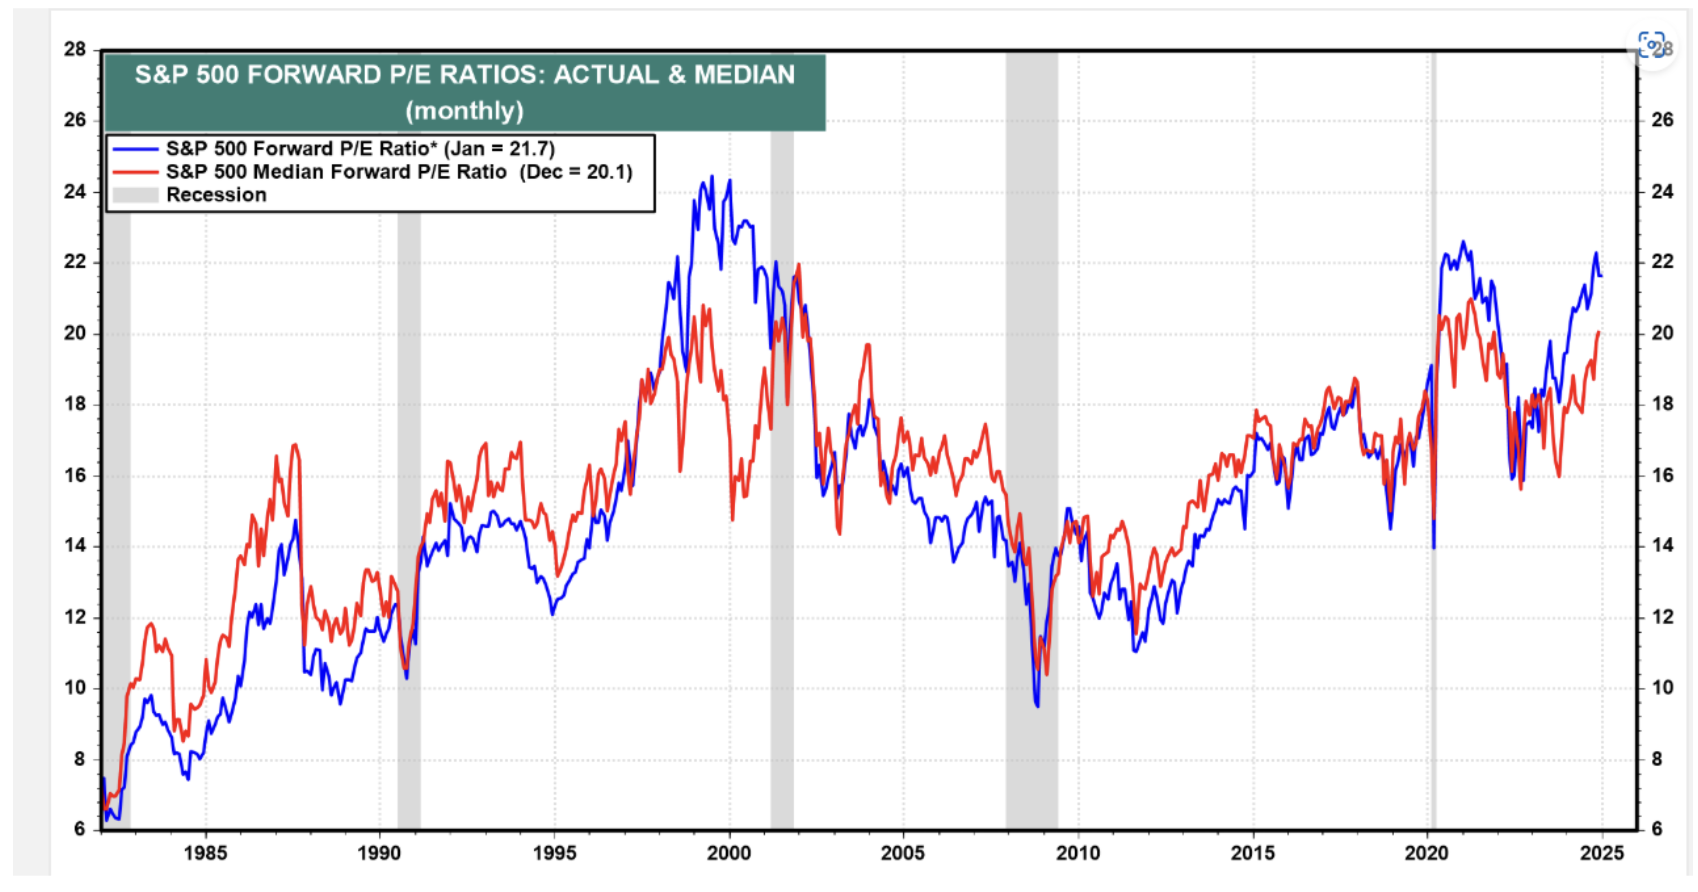
Déjà Vu
Pensions need to protect and enhance their funded status. They cannot afford volatility in the funded ratio and contribution costs. Now is the time to address asset allocation by shifting assets to a cash flow matching strategy. We recommend a minimum of defeasing the 1-10 year liability cash flows. This would buy time for the risky assets to grow unencumbered and recover from any correction. It also eliminates the need for a cash sweep that reduces the ROA of stocks significantly.
How Bonds Can Enhance the ROA
Given the volatility and uncertainty of the financial markets, bonds can provide Pension Plan Sponsors a strategy to mitigate some of that volatility. Bonds, through the certainty of their cash...
Source: How Bonds Can Enhance the ROA
Given the volatility and uncertainty of the financial markets, bonds can provide Pension Plan Sponsors a strategy to mitigate some of that volatility. Bonds, through the certainty of their cash flows, prove to be a very effective tool. Most pensions focus on earning the return on asset (ROA) assumption as the goal of asset allocation. Because bonds yield less today than the ROA (7.00% average) the asset allocation to bonds tends to be lower than historic norms. But there exists a bond allocation that could enhance the probability of achieving the ROA. Here’s how:
Cash Flow Matching – if bonds were used to cash flow match and fund net liabilities (after contributions) chronologically they would produce the liquidity needed to fully fund such net liabilities. Cash flow matching works best with longer coupon bonds where you use semi-annual interest income to partially fund liabilities. A 10-year bond has 20 interest cash flows + one principal cash flowall priced at a 10-year yield. Having this liquidity wouldeliminate the need to do a cash sweep from other asset classes which is a common liquidity procedure. According to Guinness Global, the S&P 500 has 47% of its historical returns from dividends and reinvestment since 1940 on a 10-year rolling period basis. Wouldn’t you want to reinvest dividends back into growth assets rather than spend it on funding benefits + expenses? By using bonds as the liquidity assets, the growth assets are left unencumbered to grow. The longer the cash flow matching period, the more time the growth assets have to compound their growth. This strategy and practice could significantly enhance the ROA.
Yield on Bonds – the asset allocation models forecast the return of each asset class in the model, then weight each asset class to get the derived ROA for total assets. The ROA for most asset classes is based on the historical returns of each asset class index benchmark except for bonds. The currentyield on the bond index benchmark(s) is usually used as the forecast for bond returns. The Bloomberg Barclay Aggregate is most favored as the bond index benchmark. This index was designed at Lehman Bros. by Ron Ryan when he was the head of Fixed Income Research & Strategy from 1977 to 1983. The Aggregate is a very large and diversified portfolio of bonds with the following summary statistics as of March 31, 2025:
| # of issues | 13,770 | Treasury | 44.79% | AAA | 3.06% |
| YTM | 4.51% | Agency | 1.29% | AA | 47.86% |
| Duration | 6.08 yrs. | Mtg. Backed | 24.85% | A | 11.38% |
| Avg. Maturity | 8.38 yrs. | Corporates | 24.06% | BBB | 11.43% |
| NR | 25.60% |
As a result, most asset allocation models would have a ROA for bonds of about 4.50%. If you can build a bond portfolio that outyields the Aggregate index, by definition, it should enhance the ROA for total assets. Ryan ALM Advisers, LLC has created a cash flow matching product we call the Liability Beta Portfolio™ (LBP). The LBP is a cost optimization model that cash flow matches liability cash flows chronologically at the lowest cost from a corporate bond portfolio skewed to A/BBB bonds. Based on the actuarial projections of each client we initially build a Custom Liability Index (CLI) to calculate net liabilities ((benefits + expenses) – contributions) chronologically. The CLI provides all the data needed for the LBP to function efficiently. Based on the allocation to the LBP will determine how far out the LBP can fully fund net liabilities. Usually, a 15% allocation to the LBP can fund 1-7 or even 1-10 years of net liabilities. The longer the term structure of the LBP, the higher the yield. The LBP will roughly outyield the Aggregate index by 50 bps (1-5 years) to over 100 bps (1-10 years) based on the LBP term structure. If the LBP outyields the AGG index by 50 to 100 bps, asset allocation can afford to overweight the bond allocation and still meet the target ROA for total assets. A 15% allocation to LBP is 7.5 to 15 bps value added to the ROA.
3.Cash – many pension plans have a cash allocation of around 2%+. Cash is usually the lowest yielding asset. Since the LBP becomes the liquidity assets to fully fund benefits + expenses chronologically, there is little need for cash to fund B+E. Cash might only be needed for capital calls on Private Equity and Alternative Investments. The LBP should significantly increase the yield margin versus cash since the LBP is using A/BBB+ coupon income from all maturities of the LBP. With the LBP fully funding B+E, the cash allocation can be reduced to <1%. Replacing most of the cash allocation to fund B+E with the LBP allocation is another ROA enhancement… it all adds up.
What’s Better For a Pension?
Asset returns are uncertain and very volatile. The S&P 500 is a good example. Since 1990 this index has enjoyed 13 years of 20% + growth. Unfortunately, it was accompanied...
Source: What’s Better For a Pension?
Asset returns are uncertain and very volatile. The S&P 500 is a good example. Since 1990 this index has enjoyed 13 years of 20% + growth. Unfortunately, it was accompanied with several negative return years which brought the average 20 year return down to 9.75%:
The decades of the 2000s began with three negative return years for the S&P 500 as follows:
2000 = (9.03%) 2001 = (11.85%) 2002 = (21.97%)
This combined with a secular decline in interest rates made liability growth spike by 55.12% in those three years (according to the Ryan ALM Liability Index) causing funded ratios to drop significantly by as much as 47%. This brings up the commonsense math… if funded ratios go down about 50%, they need to have assets outgrow liabilities by about 100% to get back to full funding. Since the return on assets (ROA) forecast is not based on the funded status but on the expected return of the plan’s asset allocation, the actuarial projections must make up the funded status deficit by increasing contributions. Most pension plans have experienced spiking contributions costs since 2000 which I proclaimed as the primary impetus for the US pension crisis in my 2013 book (The U.S. Pension Crisis). The uncertainty and volatility of the actual ROA has plagued pensions forever and will continue if this remains the focus of asset allocation.
Since the true objective of a pension is to secure benefits in a cost-efficient manner with prudent risk then asset allocation should be focused on this objective and not an ROA objective, which doesn’t guarantee success. This is best accomplished by bifurcating assets into liquidity (Beta) and growth (Alpha) assets. The liquidity or Beta assets should fully fund the liability cash flows (benefits + expenses) chronologically with certainty for as long as the allocation will cover. We define risk as the uncertainty of achieving the objective. So, the least risky asset strategy is to cash flow match (defease) the liability cash flows with certainty. Depending on the plan’s funded status will dictate the asset allocation between the liquidity and growth assets. The funded status is best measured by the
Asset Exhaustion Test (AET) which compares the annual asset cash flows (including contribution) versus the annual liability cash flows (including benefits + expenses).
Ryan ALM recommends starting with an allocation to liquidity or Beta assets that fully funds the liability cash flows for the next 10 years. Then we run the AET to see what ROA is needed for the residual growth assets to fully fund the residual liability cash flows. If the calculated ROA is lower than the current ROA assumption, you can allocate more to the liquidity assets and vice versa.
The benefits of the Ryan ALM cash flow matching strategy (Liability Beta Portfolio™) are numerous and significant:
Reduces risk (de-risks) by cash flow matching liability cash flows with certainty
No interest rate risk since it is funding future values (B+E liability payments)
Provides timely and proper liquidity to fully fund benefits + expenses (B+E)
AET will calculate proper allocation between liquidity and growth assets
AET will calculate ROA needed to fully fund liability cash flows
Reduces funding costs by about 2% per year (1-10 years = 20%)
Reduces asset management costs (Ryan ALM fee = 15 bps)
Reduces volatility of the funded ratio and contributions
Buys time for the Alpha assets to grow unencumbered
No need for a cash sweep to meetliquidity needs
In summary, a LBP cash flow matching strategy for liquidity assets will reduce funding costs by about 2% per year (1-10 years = 20%) while fully funding the liability cash flows with certainty. This will reduce the volatility of the funded status and allow plan sponsors and their consultants to better plan asset allocation for the growth assets. By eliminating a cash sweep, the growth assets can now reinvest their income and enhance their ROA. So, I ask once again: What is better for a pension plan? A 20% asset gain or a 20% liability cost reduction? It is clearly the cost reduction given the certainty of the outcome!
Pension Strategy to Reduce Funding Costs by 20%+
The true objective of a pension is to secure and fully fund benefits in a cost-efficient manner with prudent risk . It is a liability and cost objective… it is...
Source: Pension Strategy to Reduce Funding Costs by 20%+
The true objective of a pension is to secure and fully fund benefits in a cost-efficient manner with prudent risk. It is a liability and cost objective… it is NOT a return objective! This objective is best accomplished through a cash flow matching strategy where an optimal bond portfolio will fully fund monthly benefits + administrative expenses net of contributions. Bonds are the only asset class with certainty of its cash flows. That is why bonds have been the asset choice to defease liabilities for over 50 years.
Cash flow matching (CFM) used to be called Dedication in the 1970s and 1980s. As the head of Fixed Income Research at Lehman in the 1970s and early 1980s, I was in charge of our Dedication model. When I created my initial firm in 1984 (Ryan Financial Strategy Group), I hired the two professors in charge of Dedication at I.P. Sharpe to build our model. At Ryan ALM, we have rebuilt a CFM model that best fits any liability objective. The Ryan ALM CFM strategy utilizes our proprietary cost optimization model that will fully fund monthly net liabilities and reduce funding costs by about 2% per year. If we CFM 1-10 years of net liabilities, we should be able to reduce funding costs by about 20%, 1-15 years = 30%, etc. In addition to reducing funding costs, CFM has several benefits that should be utilized and recognized. We strongly urge pensions to consider CFM as the core portfolio that best fits the true pension objective and provides many additional benefits as listed below:
Cash Flow Matching – Provides Liquidity
The intrinsic value of bonds is the certainty of their cash flows! If bonds were used to cash flow match and fund net liabilities (benefits - contributions) chronologically they would produce the liquidity needed to fully fund such net liabilities. Cash flow matching works best with longer coupon bonds where you use semi-annual interest income cash flows to partially fund liabilities. A 10-year bond has 20 interest cash flows + one principal cash flow all priced at a 10-year yield. This would eliminate the need to do a cash sweep of other asset classes which is a common liquidity procedure. According to S&P data, the S&P 500 has 48% of its historical returns from dividends and reinvestment since 1940 on a 10-year rolling period basis. Wouldn’t you want to reinvest dividends back into growth assets rather than spend it on funding benefits + expenses? Wouldn’t you want the ROA of growth assets enhanced?
Cash Flow Matching - Provides TIME
Ryan ALM, Inc. released a 2022 research report titled “Most Important Asset of a Pension… Time!”. By using bonds as the liquidity assets, the growth assets are left unencumbered to grow. The longer the cash flow matching period, the more time the growth assets have to compound their growth. This could significantly enhance the ROA. By cash flow matching net liabilities chronologically, Ryan ALM can buy the time a plan sponsor and their consultant feel is necessary for the growth assets to grow unencumbered… and recover from negative return years. When markets correct and go down (i.e. 2022) it may take several years to recover and achieve the average annual target ROA that was assigned to that asset class.
Cash Flow Matching – Provides Inflation Hedge
Ryan ALM released a 2020 research report and pension alert titled “Pension Inflation =/= CPI”. Pension inflation has three parts: a cost of living adjustment (COLA) lives; a salary increase factor for active lives and a forecast of administrative expenses. The COLA may be based on the CPI but with a floor and a cap or even a % of the CPI while the salary and administrative expense increases tend to be quite static @ 3% annual increase. As a result, pension inflation tends to be less volatile and more static than the CPI. The plan sponsor actuary includes pension inflation in their projected benefit + expenses payment schedule for both retired and active lives. This fact suggests clearly that the best way (and only way) to hedge pension inflation is to cash flow match the actuarial projected benefits + expenses. If you cash flow match the actuarial projections, you have defeased liabilities and hedged pension inflation.
Cash Flow Matching – Outyields Benchmark and Bond ROA
The Ryan ALM cash flow matching product (Liability Beta Portfolio or LBP) is heavily skewed to A/BBB corporate bonds while the BB Aggregate is heavily skewed to Government bonds. As a result, the LBP will outyield the BB Aggregate by a significant yield spread… usually 50 – 75 bps, which will enhance the ROA of bonds.
Higher Yields are Good for Cash Flow Matching… and Pensions
Ryan ALM released a topical 2022 research report titled “Why Higher Interest Rates are Good for Pensions”. Pension funds are highly interest rate sensitive! Certainly, fixed income assets are such that the longer their maturity and effective duration, the greater their interest rate sensitivity. But it is pension liabilities that are more interest rate sensitive. Liabilities behave like a 100% zero-coupon bond portfolio because the discount rate(s) chosen price liabilities as zero-coupon bonds. This causes liabilities to be longer in duration then the same maturity(s) coupon bonds. Many discount rates are a yield curve of rates (ASC 715, PPA, PBGC, IASB). As interest rates trend higher, bonds can cash flow match liabilities at lower and lower costs. Note that cash flow matching is focused on funding B + E which are future values. Future values are not interest rate sensitive. Bonds are the only asset class with the certainty of cash flows (future values). That is why bonds have always been used as the methodology for defeasance (cash flow matching) of liabilities. Moreover, if interest rates trend upward any reinvestment of cash flow can buy future value at a lower cost. As a result, cash flow matching sees higher interest rates as an opportunity to reduce funding costs. The Ryan ALM cash flow matching product can reduce funding costs by @ 20% for most pension liabilities out to 10 years. In contrast, bonds used as performance or growth assets could see negative returns… like 2022. Total return performance is not the value in bonds… the certainty of cash flow is the intrinsic value. We urge pensions to transfer their bond allocation from focusing on outperforming some generic bond index to focusing on cash flow matching liabilities chronologically, especially at today’s higher rates.
Reminder: The ROA is Plural… ROAs
Ryan ALM, Inc. released a topical 2022 research report titled “The Pension ROA is plural… ROAs” that details how the ROA is calculated. Each asset class is askby using their index benchmark as the target return proxy. However, for fixed income it is the YIELD of the index benchmark… not the total return like other asset classes. The Bloomberg Barclay Aggregate is most favored as the bond index benchmark. This index and almost all popular bond index benchmarks were designed at Lehman Bros. by me (Ron Ryan) when I was the head of Fixed Income Research & Strategy from 1977 to 1983. Please note… each asset class is NOT required to earn the pension fund ROA assumption (@ 6.50% today). This is an important fact to remember in asset allocation. We at Ryan ALM often hear the criticism and question… how can we invest in 4% bonds to earn our ROA? The answer is bonds do NOT need to earn the pension ROA… just their assigned ROA (yield of index benchmark) in the asset allocation model.