

Ryan ALM
White Papers
Pension Conundrum - Liquidity Risk
Liquidity is a critical and necessary priority of a pension fund, since it must fund monthly benefits and expenses (B + E) on time. Many plan sponsors use a “cash...
Source: Pension Conundrum - Liquidity Risk
Liquidity is a critical and necessary priority of a pension fund, since it must fund monthly benefits and expenses (B + E) on time. Many plan sponsors use a “cash sweep” or a fixed cash allocation to provide such cash flow. Both strategies are not optimal for a pension plan.
Cash Sweep
A cash sweep usually takes income or cash flow from all asset classes to fund the current monthly B+E. This can severely damage the ROA of such asset classes. According to a research report by Guinness Global found since 1940, dividends and dividends reinvested have accounted for 47% of the S&P 500 total return on a 10-year rolling period and 57% on a 20-year rolling period. So, this data questions the logic of a cash sweep that uses dividends to fund B+E.
As a solution, Ryan ALM recommends that you use a cash flow matching (CFM) strategy to fully fund B+E. Our CFM model will provide timely cash flows that will fully fund B+E at the lowest cost to our clients. The benefits of CFM are quite substantial:
Allows growth (non-liquidity) assets to grow unencumbered. Should enhance their ROA significantly.
CFM buys time. The longer the time, the greater the probability of achieving the ROA for the growth assets.
CFM will provide certainty (barring a default) of cash flows which reduces or eliminates liquidity risk.
CFM is an investment grade portfolio skewed to the longest maturities within the area it is funding (i.e. 1-3 years or 1-5 years) that should enhance the CFM yield versus the yield on cash reserves.
CFM reduces reinvestment risk if interest rates trend downward (as many expect).
Asset Allocation (AA)
Most AA have a cash allocation somewhere between 2% to 5%. Why? Normally you hear it is for liquidity purposes or even diversification. Cash is usually the lowest yielding asset especially when there is a positive sloping yield curve. Due to its very short maturities, cash is usually costing the plan close to a 1:1 cost ratio of present value to future value. The present value of a 3-month T-Bill will be quite close to its future value or a 1:1 ratio. While a CFM portfolio with a 3-year average maturity yielding 4.00% would have a 0.88:1 ratio for a cost reduction = 12%.
As a solution, Ryan ALM recommends separating liquidity assets from growth assets in asset allocation. Let bonds in a CFM strategy be your liquidity assets for the advantages mentioned above. A CFM strategy will have a longer average duration than cash thereby reducing the cost ratio. In this way the liquidity assets and the growth assets are a team that will produce the optimal solutions:
Enhance ROA by eliminating a cash sweep so growth assets grow unencumbered.
Reduce or eliminate liquidity risk by fully funding B+E monthly with certainty.
Enhance the ROA by outyielding cash
Reduce funding costs
How To De-risk a Pension
Risk is best defined as the “uncertainty” of meeting the client objective. The pension objective is to fund liabilities in a cost-effective manner such that contribution costs remain low and...
Source: How To De-risk a Pension
Risk is best defined as the “uncertainty” of meeting the client objective. The pension objective is to fund liabilities in a cost-effective manner such that contribution costs remain low and stable. Pension plans also want to de-risk their plans over time. The lowest risk assets for a pension are those that match the liability benefit payment schedule with certainty. By definition, Treasury zero-coupon bonds (STRIPS) and annuities would be the lowest risk assets for pension since they have a known future value… but they tend to come at a high cost since they are low yielding (STRIPS) or have high fees (annuities). Given that the pension objective is to secure benefit payments in a cost-efficient manner, then solving for cost while matching and fully funding the liability payment schedule would be the ideal way to de-risk a pension.
A pension liability benefit payment schedule is a term structure or yield curve often referred to as the liability cash flow. In order to match or de-risk each pension liability payment requires a matching cash flow from assets. Only bonds (and annuities) produce a certain cash flow. That is why bonds have been used for decades as the best way to defease, immunize, and de-risk a pension plan.
Problems with Hedges
Duration-matching strategies (Immunization), Interest Rate Swaps, futures, derivatives, risk overlays, etc. are all hedging tools to help assets match the liability growth rate. They are NOT de-risking strategies since they do not match the liability cash flows. Duration matching has several difficult, if not erroneous, data gathering choices it uses:
Average duration of liabilities
Where do you get the average duration of liabilities? Most, if not all, actuarial reports do not provide this calculation. Moreover, they usually do not provide the projected liability benefit payment schedule which you would need to calculate duration. In addition, actuarial reports are, at a minimum, annual reports usually three to six months delinquent so there would be serious delayed information. The duration calculation is at a precise moment in time… like a balance sheet. As time and interest rates change… so will duration. Only A Custom Liability Index (CLI) based on each pension’s unique liability benefit payment schedule could provide an accurate and monthly duration profile.Discount Rates
Since the duration of liabilities changes with interest rates (discount rates) this calculation needs to be refreshed and updated on a frequent and accurate basis. According to pension accounting rules (FAS 158, GASB 67) and federal funding standards (PPA – MAP 21 and spot rates) there is an assortment of discount rates required to price liabilities. Which one is best? The FASB accounting language says it best… you are use a discount rate that settles the liability payments. This means discount rates you can buy to settle or defease the liability payment schedule. ASC 715 comes the closest by using an AA corporate bond yield curve. Treasury STRIPS would be ideal, but no one seems to favor this approach since STRIPS are low yielding causing the present value of liabilities to be higher. The yield difference in these discount rates could be significant. Any difference in yield creates a difference in the calculation of duration and liability growth rates.Generic Bond Indexes
A common proxy for the average duration of liabilities is to use a generic bond market index… usually the Barclay’s long corporate index. Such a proxy creates several erroneous data issues. This index has no bonds shorter than 10 years and no durations longer than 16 years. This certainly does not represent any pension liability schedule even if the average durations were similar. Accounting standards and actuarial practices price liabilities as a portfolio of zero-coupon bonds with a single average discount rate based on the present value of this zero-coupon liability portfolio. There are no generic bond indexes that use zero-coupon bonds as their portfolio. There are no generic bond indexes that use pension discount rates in accordance with FASB, GASB and PPA guidelines. Each pension plan’s liabilities are different and unique to that plan due to a different labor force, salaries, mortality, and plan amendments. There is no way any generic bond market index could represent any pension plan liability term structure.Only a Custom Liability Index could properly represent and measure any pension plan’s liabilities providing all of the critical data calculations needed to de-risk the plan. In 1991, Ron Ryan designed the first Custom Liability Index (CLI). Based on each client’s unique projected liability benefit payment schedule, Ryan ALM produces monthly CLI reports on:
Structure (Present Value, Average Duration, YTM, Price, etc.)Growth Rate (Liability growth for month, year, and since inception)
Interest Rate Sensitivity (PV change in % and $ given rate changes)
Interest Rate Sensitivity
Every 1 year of duration difference between the liability proxy and the actual duration of each plan’s benefit payment schedule would represent a 1% mismatch in liability growth for every 100 bps of discount rate change. In truth, the duration mismatch is more likely to be three to five years rather than one year. Given that pension cost for the actuary, administration, asset managers, and consultant are usually less than 50 bps a year; such a duration mismatch could be very costly representing years of pension cost.
Funding Liabilities
Imagine a 12-year average duration liability benefit payment schedule. It could have many different term structure shapes to come up with an average 12-year average duration. Imagine 100% of the assets in a 12-year duration bond portfolio. If interest rates rose 50 basis points in one-year, total assets and liabilities supposedly would both have a -6% price return (interest rate movement x duration (as a negative number). If they had the same income return = 5% they would match again. However, if the duration matching assets are used to fund liabilities as they come due then a -1% loss (-6% + 5% = -1%) on assets could be funding a short liability which will have a small positive growth rate. So, the assets could be taking a loss each year to fund the next liability payment if interest rates continue to rise. This could get to be a serious costly mismatch if interest rates continue their secular trend to higher rates for the next few years. But the point is……there is no cash flow match here, only a duration match so there is both a funding and interest rate risk!
Derivatives
Interest rate swaps and futures are contracts not assets. There is no cash flow or funds available to make the liability cash flow payments. They are certainly NOT de-risking strategies but hedges vs. the liability growth rate. In fact, these strategies introduce more risk: counter party risk, interest rate risk, non-matching risk of assets purchased (usually equities) vs. liabilities, and leverage. In addition, interest rate swaps and futures have all of the problems associated with a liability proxy data gathering… as listed with duration matching.
Solution: Cash Flow Matching
As stated in the beginning, matching the liability benefit payment schedule (liability cash flow) at the lowest cost is the ideal way to de-risk a pension plan. Ryan ALM built a liability cash flow matching product, named the Liability Beta Portfolio™ (LBP), as a cost optimization model that matches the liability benefit payment schedule at the lowest cost given the investment policy restrictions of our clients.
The LBP provides about a 2% per year funding cost savings (1-15 years = 30%). This is a serious cost reduction and should be a major consideration of any de-risking strategy. Yes, the LBP model has some credit risk but very small since we are using investment grade corporate bonds with a credit filter (no bonds on negative watch list) plus the cost savings provides a large value-added cushion.
The funded ratio should dictate the allocation to bonds. A surplus should have a high allocation to bonds matched to liabilities and vice versa for a deficit funded status. Unfortunately, asset allocation did not respond to the surplus status in the 1990s which led to the US pension crisis. With funded ratios at 120% and above then, why didn’t pensions immunize and secure this victory? Amazingly, instead of increasing their bond allocation in response to a growing funded ratio they reduced it consistently because of low interest rates to the lowest bond allocations in modern history by 1999.
The allocation to bonds should determine how much of the liabilities we can cash flow match (i.e. a 25% bond allocation might fund the next seven years of gross liabilities). Ryan ALMrecommends: funding the next 10 years of Retired Lives on a net liability basis (after contributions). Indeed, current assets fund the net liabilities not the gross liabilities. Our LBP model will calculate with precision the cost to fund liabilities (gross or net) in a cost-effective manner either as a % of total liabilities or liabilities chronologically, as both methods will de-risk the plan gradually. There are advantages for each method.
Since liabilities are funded initially by contributions, using the LBP model to cash flow match net liabilities chronologically may be able to fund more liabilities than you think. Assume that a 20% bond allocation could match the next 10 years of net liability payments chronologically. Based on the Ryan ALM Liability Beta Portfolio™ (LBP) model we show a cost savings of about 20% on cash flow matching the first 10 years of liabilities, in this interest rate environment.
Matching liabilities chronologically should also buy time for the non-bond assets (Alpha assets) to perform and outgrow liabilities. Given time (7-10 years) most non-bond asset classes tend to outperform bonds. Since liabilities behave like bonds there is a high probability that non-bond asset classes could outperform vs. liability growth over an extended time horizon.
Since the pension objective is a cost focus, cash flow matching a % of total liabilities would produce the optimal cost savings since the longer the bond the less it costs given the same future value. Our LBP model is back tested since 2009. Every $1 billion in bonds used in our LBP model could save about $200 million in cost savings on a 1-10 year liability schedule and $400 million on a 1-20 year liability schedule.
Asset Allocation (AA)
Pension consultants and plan sponsors should consider installing an LBP as the core portfolio in asset allocation and as the liquidity assets to fund liability cash flows chronologically. The intrinsic value in bonds is the certainty of their cash flows. Bonds are usually not considered performance assets (Alpha assets) especially vs. pension liabilities which behave like bonds. Cash flow matching liabilities chronologically will buy time for the Alpha assets (non-bonds) to perform vs. liability growth, thereby enhancing the funded ratio. Such excess returns should be transferred over to the Liability Beta Portfolio™ (LBP) to de-risk more and more liabilities… Portable Alpha. Had this portable Alpha discipline been in place during the decade of the 1990s when funded ratios grew to their highest historical levels with true economic surpluses… there would be no U.S. pension crisis today!
Nota Bene (Note Well)
Please note that the definition of risk used in this article is in sharp contrast to the traditional approach produced by the Nobel Prize winner Ph.D. William F. Sharpe back in 1966. Professor Sharpe proposed that risk is the volatility of total returns and that the three-month T-Bill was the default risk-free rate. He developed the Sharpe Ratio as a means of calculating the risk-adjusted return by subtracting the return of the three-month T-Bill from the mean return of the asset(s) being analyzed and dividing the net return by the volatility of the return of the asset(s) in review. For many decades the Sharpe Ratio was the standard measurement of risk-adjusted returns. In 1994 Prof. Sharpe called me and invited me to Stanford to discuss our unique Custom Liability Index data and reports. I had the unique pleasure to meet and debate with one of the finest intellects I have ever met.
I proposed that risk is not a generic measurement but based on each client’s objective. I referenced pensions where every client’s liabilities are different (like snowflakes). As proof, I asked Professor Sharpe what is the risk-free asset for a 10-year liability payment? Professor Sharpe answered… a 10-year Treasury zero-coupon bond. Prof. Sharpe identified that the three-month T-Bill would have 39 reinvestment moments of uncertainty, so there is no way the three-month T-Bill could match a 10-year liability future value with any certainty and would become a risky asset. Our discussion led to Prof. Sharpe re-inventing the Sharpe Ratio in 1994 to include the benchmark objective instead of the three-month T-Bill in the numerator and denominator such that the average return of the asset portfolio is reduced by the average return of the objective (numerator). This net average return is then divided by the standard deviation of the asset portfolio excess return vs. the objective return. This is commonly called today… the Information Ratio.
Ryan ALM Pension Alert Q2’23
Most Asset Allocations for pensions are based on achieving the ROA. The ROA is an annual forecast of asset returns. Each asset class is assigned a ROA then weighted by...
Source: Ryan ALM Pension Alert Q2’23
Spread between ROA and Bonds Narrowest in 20+ Years
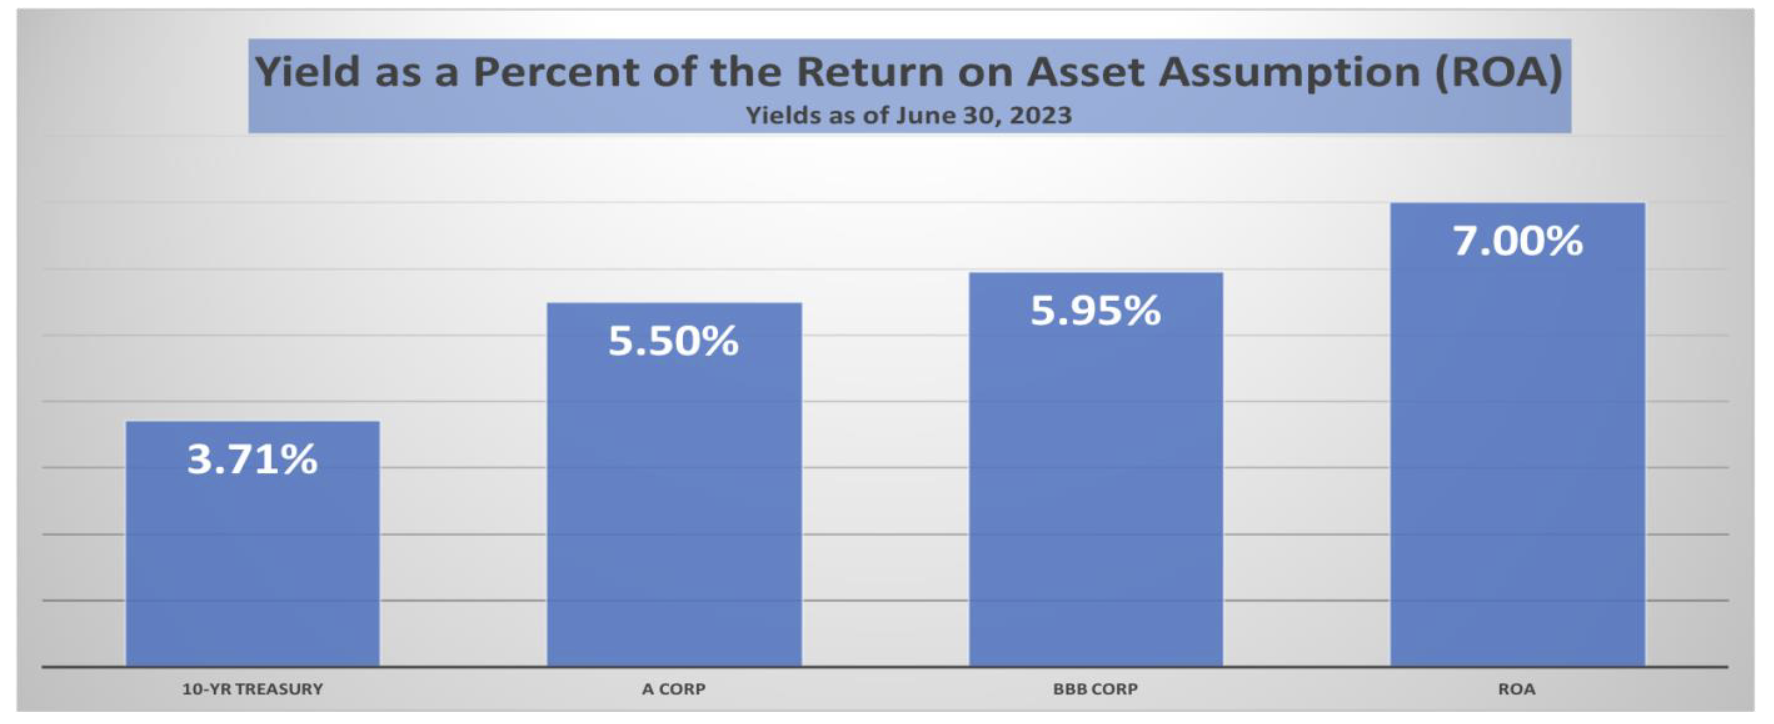
Most Asset Allocations for pensions are based on achieving the ROA. The ROA is an annual forecast of asset returns. Each asset class is assigned a ROA then weighted by the target allocation to get an average or target ROA. Currently, the ROA for most Public pensions is around 7.00%. Yields on A and BBB corporates have risen significantly in the last two years and are now fast approaching the ROA target return. With A and BBB corporate yields at 78.6% to 85.0% of the ROA, a strong argument should be made to increase the allocation to fixed income. The 2023 Milliman Public Funding Survey suggests that the ROA will continue its trend lower. With the Milliman 2024 estimate of a 6.75% ROA, A and BBB corporate bonds would approach 81.5% to 88.2% of the target return. Ryan ALM recommends using bonds for their intrinsic value… the certainty of their cash flows. Cash flow matching liabilities chronologically would be in harmony with the true objective of a pension… to secure the promised benefits in a cost-efficient manner with prudent risk.
Benefits of Higher Bond Allocation to Cash Flow Matching:
Improve Liquidity
Outyield ROA = liability Alpha
Reduce Volatility (risk) of Funded Ratio
Create CORE portfolio as anchor to earning ROA
Reduce costs to fund Benefits + Expenses (B + E)
Buy TIME for performance assets to grow unencumbered
Cash Flow Matching Overview
Cash Flow Matching Pension Objective Fund benefits in a cost-efficient manner with prudent risk Pension Needs Liquidity to fund benefits Reduce Contribution costs Reduce Volatility of Funded Status Strategy Value...
Source: Cash Flow Matching Overview
| Pension Objective | Fund benefits in a cost-efficient manner with prudent risk | ||||||||||||||||
| Pension Needs |
Liquidity to fund benefits Reduce Contribution costs Reduce Volatility of Funded Status |
||||||||||||||||
| Strategy | Cash flow match liability cash flows (benefits + expenses) | ||||||||||||||||
| Value in Bonds |
Certainty of cash flows (only asset class with such value) Maturity selection = yield curve (term structure) Cash flows every month as portfolio |
||||||||||||||||
| Methodology |
Ryan ALM creates a Custom Liability Index (CLI)
Ryan ALM creates Liability Beta Portfolio (LBP)
|
||||||||||||||||
| LBP Benefits |
Fully funds B+E and secures benefits with certainty
Reduces funding costs by 2% per year (1-10 years = 20%)Eliminates cash sweep of growth assets (Alpha assets) Buys time for Alpha assets to grow unencumbered Reduces volatility of funded ratio/status Outyields liabilities creating alpha Enhances funded status and ROA Reduces Contribution costs Mitigates interest rate risk Hedges pension inflation Low fee |
||||||||||||||||
| Note: |
LBP does not change any accounting, actuarial and asset allocation (AA) actions. LBP is a less risky & less costly alternative to active bond management. LBP is a best fit to the true pension objective. |
||||||||||||||||
| Interest Rate Risk (IRR) |
Biggest and dominant risk on bonds present values (PV) Benefits + expenses = future values (FV) B+E are not interest rate sensitive LBP funds Benefits + Expenses LBP mitigates IRR |
||||||||||||||||
| Pension Inflation |
Actuarial projections unique to each pension plan Inflation assumptions =/= CPI |
||||||||||||||||
| Generic Bond Indexes |
Not a proper benchmark Do not represent pension liabilities Liabilities are like snowflakes, unique to each plan sponsor Only a Custom Liability Index could measure/monitor liabilities |
||||||||||||||||
| Value Added |
Ryan ALM offers clients a series of synergistic values:
|
||||||||||||||||
| Awards |
Gold Medal Winner – The U.S. Pension Crisis book of the year Bernstein, Fabozzi, Jacob Levy – Research Paper of the year William F. Sharpe Index Lifetime Achievement Money Management Letter Lifetime Achievement Capital Link – Most Innovative ETF IMN - ETF of the year |
How To Hedge Interest Rate Risk
Pension funds are faced with numerous risk factors. Perhaps, the greatest risk factor is Interest rate risk. If affects assets but especially liabilities. How pensions cope with Interest rate risk...
Source: How To Hedge Interest Rate Risk
Pension funds are faced with numerous risk factors. Perhaps, the greatest risk factor is Interest rate risk. If affects assets but especially liabilities. How pensions cope with Interest rate risk could determine the funded status and solvency of the plan.
The funded ratio of a pension is assets / liabilities based on either market value or actuarial valuations. The funded status is assets - liabilities with the same valuations. This funded ratio/status determines the contribution costs of a plan, amortizations, actuarial gains/losses and perhaps, affects credit ratings. The funded ratio and status are both based on present value calculations and valuations. As a result, how the present value of pension assets are calculated plays a major role In the funded ratio/status situation.
Assets
There are numerous assets that are interest rate sensitive such as: ABS, bank loans, bonds, cash equivalents, CLOs, CMBS, CMOs, derivatives, futures, mortgage-backed securities, municipal bonds, Private Debt, REITs, etc. . Since Interest rates are never static, their volatility affects the funded ratio/status of the pension plan. This could be good or bad but most pensions do not want volatility on these critical calculations. As a result, many pensions, especially corporate plans, invest in hedging strategies to reduce or Immunize this volatility. These strategies can be quite sophisticated but all come at an extra cost and new risk factors.
Derivatives such as interest rate swaps and futures are contracts which have no cash flow certainty or exact funds available to make the liability cash flow payments. They are hedges vs. the liability growth rate. In fact, these strategies introduce more risk: counter party risk, interest rate risk, non-matching risk of assets purchased (usually equities) vs. liabilities and leverage. In addition, interest rate swaps and futures have all of the problems associated with a liability proxy data gathering… as with duration matching. For example, where do you get the average duration of liabilities? Most, if not all, actuarial reports do not provide this calculation. Moreover, they do not provide the projected liability benefit payment schedule which you would need to calculate duration. In addition, actuarial reports are annual reports usually months delinquent so there would be serious delayed information. The duration calculation is at a precise moment in time… like a balance sheet. As time and interest rates change… so will duration. Only A Custom Liability Index (CLI) priced at market rates and based on each pension’s unique liability benefit payment schedule could provide an accurate and current duration profile. Any difference in yield creates a difference in the calculation of duration and liability growth rates.
A common proxy for the average duration of liabilities is to use a generic bond market index… usually the Bloomberg Barclay’s long corporate index. Such a proxy creates several erroneous data issues. This index has no bonds shorter than 10 years and no durations longer than 17 years. This certainly does not represent any pension liability schedule even if the average durations were similar.
Accounting standards and actuarial practices price liabilities as a portfolio of zero-coupon bonds with a single average discount rate based on the present value of this zero-coupon liability portfolio. Note… there are no generic bond indexes that use zero-coupon bonds as their portfolio. Moreover, there are no generic bond indexes that use any of the required pension accounting discount rates… they use market rates! Every pension plan’s liabilities are different and unique to that plan due to different labor force, salaries, mortality, and plan amendments. There is no way any generic bond market index could represent any pension plan liability term structure.
Liabilities
Liabilities are bond like valuations since their present value is calculated the same way you calculate the present value of bonds. Indeed, FASB and GASB accounting rules require that you price liabilities as if they were zero-coupon bonds. This makes liabilities extremely interest rate sensitive. The longer the average life or duration of liabilities the greater the interest rate risk and present value volatility. Since the duration of liabilities changes with interest rates (discount rates) this calculation needs to be refreshed and updated on a frequent and accurate basis. According to ASC 715 accounting rules (formerly FAS 158) liabilities are to be priced as a high-quality zero-coupon bond yield curve. FASB accepts AA corporates as the interest rates in compliance. Since corporate zeroes do not exist in the market-place, such discount rates are hypothetical interest rates. Ryan ALM is one of few vendors who supply the ASC 715 discount rates. Price Waterhouse Coopers (PWC) has been our major client since FAS 158 became effective in 2008 (now ASC 715). Our discount rates are consistently higher than most vendors providing clients with a lower present value of their pension liabilities thereby enhancing the balance sheet.
GASB accounting rules allow for liabilities to be priced at a single discount rate equal to the assumed ROA. Such divergence in discount rates between FASB and GASB creates much confusion and conflicts but don’t disagree as to the fact that liabilities are assumed to be priced as and behave as zero-coupon bonds.
Liabilities are a term structure of projected benefits. This becomes a tough job for actuaries to calculate annually so it takes some time. Usually, actuarial reports come out months after the end of the fiscal year (around six months for Public plans). Asset managers need fresh and continuous data to do their job. For asset/liability management (ALM) monthly or even daily updates are critical. Since duration and interest rates change daily, liabilities are certainly dynamic structures requiring constant attention. Without a Custom Liability Index (CLI) it would be hard, if not impossible, for a plan sponsor, its asset managers and consultant to understand the risk/reward behavior and interest rate sensitivity of their liabilities.
Solution: Cash Flow Match Benefits
The funded ratio/status and performance measurement of assets vs. liabilities are all based on present value measurements. This has led to a tower of babel on what is the proper discount rate, funded status, index benchmark, duration calculation, etc. The solution lies in cash flow matching projected benefits… future value projections. The goal of a pension is to secure benefits in a cost-effective manner. Benefits are future value numbers. They have little, if any, interest rate sensitivity. A $100 million benefit payment in 2030 is $100 million whether interest rates go up or down. It is a static non-interest rate sensitive calculation. So it follows… that the best way to hedge interest rate risk is to hedge future values by cash flow matching projected benefits with bonds. Bonds have been used historically to match benefits (i.e. defeasance, dedication, immunization) since they may be the only asset class with certainty of cash flows or future values.
Since benefit payments are future values (FV) suggests that the future value of assets vs. the future value of liabilities is the most critical evaluation. But most asset classes are difficult to ascertain their future value. Only bonds (and insurance annuities) have a known future value and have historically been used to cash flow match liabilities (i.e. defeasance, dedication, buy-out annuities). To prove my point as to the potential misinformation with using a PV calculation, let’s use a simple example below. Two pensions both at $1.0 billion market value would have the same funded ratio in PV$. But pension B is 100% invested in corporate bonds that out-yield pension A (100% invested in Treasuries) by 150 bps per year. Certainly, plan B has a much greater future value (@ 24% higher) and funded status if we used future values. This suggests that the funded ratio and funded status are not that accurate or even good indicators of the true economic solvency:
| Pension | Composition | YTM | PV | FV |
|---|---|---|---|---|
| A | 100% Treasuries | 2.00% | $1.0 billion | $1.35 billion |
| B | 100% Corporates | 3.50% | $1.0 billion | $1.68 billion |
The point of all this is… that we need to focus more on the FV of assets vs. liabilities. If we value liabilities at market rates, they would have discount rates of AA corporates (FASB method) or even better U.S. Treasury STRIPS (defeasance method). A corporate bond portfolio matched to liabilities that is skewed to A/BBB securities would out-yield liabilities and would enhance the funded status on a future value basis thereby reducing funding costs and also mitigate interest rate risk. This is why “cash flow matching” of liability future values is the most prudent risk and lowest cost methodology to de-risking a pension through asset liability management (ALM). It secures the benefits in a cost-efficient manner while neutralizing interest rate risk.
Pension Quiz
Is it better to have 10% ROA or reduce Funding Costs by 10%? The primary objective of a pension is to secure benefits (Retired Lives) in a cost- efficient manner...
Source: Pension Quiz
Is it better to have 10% ROA or reduce Funding Costs by 10%?
The primary objective of a pension is to secure benefits (Retired Lives) in a cost-efficient manner with prudent risk. The secondary objective is to enhance the funded status by maximizing the efficiency of asset allocation. However, most pensions have the stated objective as a… target absolute % return on assets (ROA).
Achieving a 10% ROA
History has proven that achieving the ROA does not mean you achieved a fully funded plan or even enhanced the funded status such that the $ deficit and contribution costs have been reduced. Simple math can prove this assertion as shown in Exhibit 1 where pension assets achieved the ROA growth target of 8% consistently for last 6 years. Liabilities are assumed to have the same 8% growth rate (actuarial discount rate = ROA). As a result, the funded ratio stays stable at 60% but the funded status $ deficit increases by 59.6% ($40 to 63.44) which would increase contribution costs accordingly. In order for contribution costs to remain stable or go lower, assets would have to match or outgrow liabilities by 5.33% annually (13.33% ROA minimum):
Exhibit 1
Funded Ratio = 60% ($40 Deficit)
Assets and Liabilities grow at ROA = 8%
| Assets | Liabilities | Funded Status/Ratio | ||||
|---|---|---|---|---|---|---|
| Year | Begin | End | Begin | End | $ Deficit | Funded Ratio |
| 1 | $60.00 | $64.80 | $100.00 | $108.00 | $43.20 | 60% |
| 2 | 64.80 | 69.98 | 108.00 | 116.64 | 46.66 | 60% |
| 3 | 69.98 | 75.58 | 116.64 | 125.97 | 50.39 | 60% |
| 4 | 75.58 | 81.63 | 125.97 | 136.05 | 54.42 | 60% |
| 5 | 81.63 | 88.16 | 136.05 | 146.93 | 58.77 | 60% |
| 6 | 88.16 | 95.21 | 146.93 | 158.65 | 63.44 | 60% |
If the actual asset growth rate was 10% instead of 8% (Exhibit 2), assets would grow to $106.29 over six years which creates a 67% funded ratio but a growing deficit of $52.36 or 30.9% greater than the initial $40 underfunding which increases contribution costs accordingly. Even a 70% funded ratio would increase the deficit to $45.91 or 14.78% greater. The pension return objective should be for assets to outgrow liabilities in economic dollars not actuarial dollars… it is relative $ returns that count not an absolute % return (ROA)! It is the economic funded status that counts not the funded ratio! Asset allocation needs to know the economic relative return needed to enhance the economic funded status.
Exhibit 2
Funded Ratio = 60% ($40 Deficit)
Assets grow at 10% but Liabilities grow at ROA = 8%
| Assets | Liabilities | Funded Status/Ratio | ||||
|---|---|---|---|---|---|---|
| Year | Begin | End | Begin | End | $ Deficit | Funded Ratio |
| 1 | $60.00 | $66.00 | $100.00 | $108.00 | $42.00 | 61% |
| 2 | 64.80 | 72.60 | 108.00 | 116.64 | 44.04 | 62% |
| 3 | 69.98 | 79.86 | 116.64 | 125.97 | 46.11 | 63% |
| 4 | 75.58 | 87.85 | 125.97 | 136.05 | 48.19 | 65% |
| 5 | 81.63 | 96.63 | 136.05 | 146.93 | 50.30 | 66% |
| 6 | 88.16 | 106.29 | 146.93 | 158.65 | 52.36 | 67% |
If we use market (economic) values for liabilities (ASC 715 discount rates), liabilities become highly interest rate sensitive… the economic truth. Using ASC 715 (AA corporates as a zero-coupon yield curve) as the discount rate for liabilities, a small increase in interest rates (+60 bp per year) would create negative growth in liabilities! Accordingly, any positive growth in assets would enhance the economic funded ratio and funded status. In just five years a 60% funded ratio could be 91% funded with just 5% asset growth while a 70% funded ratio would be 106% funded… and at no time did assets earn the ROA!
5-year Horizon
Liabilities ASC 715 Discount rate goes from 2.00% to 5.00%
Liabilities Growth Rate = (3.40%) at 12-year duration
| ----- Annual Growth Rate ----- | |||
|---|---|---|---|
| Assets | 5.00% | 6.00% | 7.00% |
| Liabilities | -3.40% | -3.40% | -3.40% |
| Alpha (Annual) | 8.40% | 9.40% | 10.40% |
| Funded Ratio @ 60% ... | 91.0% | 94.5% | 100.1% |
| @ 70% ... | 106.2% | 111.4% | 116.7% |
Achieving a 10% Funding Cost Savings
The primary objective of a pension is to fund liabilities in a cost-effective manner. It is a liability objective with cost considerations. Since 1999, most pensions have been hard hit by spiking contribution costs which were unexpected and not a budget forecast. For many plan sponsors, the contribution cost has risen as much as 5x to 10x from the fiscal 1999 level. Such costs are a product of the size of the funded status deficit where asset $ growth did not match liability $ growth over time. Indeed, it is the relative $ growth of pension assets vs. liability $ growth that is critical… not the absolute % return on pension assets.
The pension objective is best achieved by separating the assets into liquidity (Beta) and growth (Alpha) assets. The job of the liability Beta (liquidity) assets is to secure benefits (Retired Lives) in a cost-efficient manner with prudent risk. This is best accomplished through cash flow matching net liabilities chronologically. Ryan ALM has built a liability cash flow matching product, named the Liability Beta Portfolio™ (LBP), as a cost optimization model that matches and funds the net liability benefit payment schedule (minus contributions) at the lowest cost given the investment policy restrictions of our clients.
Since liabilities are funded initially by contributions, using the LBP model to cash flow match net liabilities chronologically may be able to fund more liabilities than you think. Assume that a 15% bond allocation could cash flow match the next 10 years of net Retired Lives payments chronologically. Based on the Ryan ALM Liability Beta Portfolio™ (LBP) model we show a cost savings of about 8% to 15% on cash flow matching the first 10 years of liabilities versus the ASC 715 discount rates (AA corporate zero-coupon bonds). For every $100 million in bonds used in our LBP model could save about $10 million or 10% in funding cost savings vs. the projected net liabilities. This cost savings is received immediately upon implementation of the Liability Beta Portfolio™ rather than over several years as forecasted returns suggest would happen, if at all. This is a serious cost reduction that reduces the volatility of the funded status and contributions and should be a major consideration of any pension asset allocation as the core portfolio.
Matching liabilities chronologically should also buy time for the growth assets (Alpha assets) to perform and outgrow liabilities without being diluted or unencumbered to partially fund liabilities as is the case so often today. Given time (10 years) most non-bond asset classes tend to outperform bonds. Since liabilities behave like bonds there is a high probability that Alpha assets (i.e. equities) could outperform liability growth over an extended time horizon especially at today’s low yield on bonds (and liabilities).
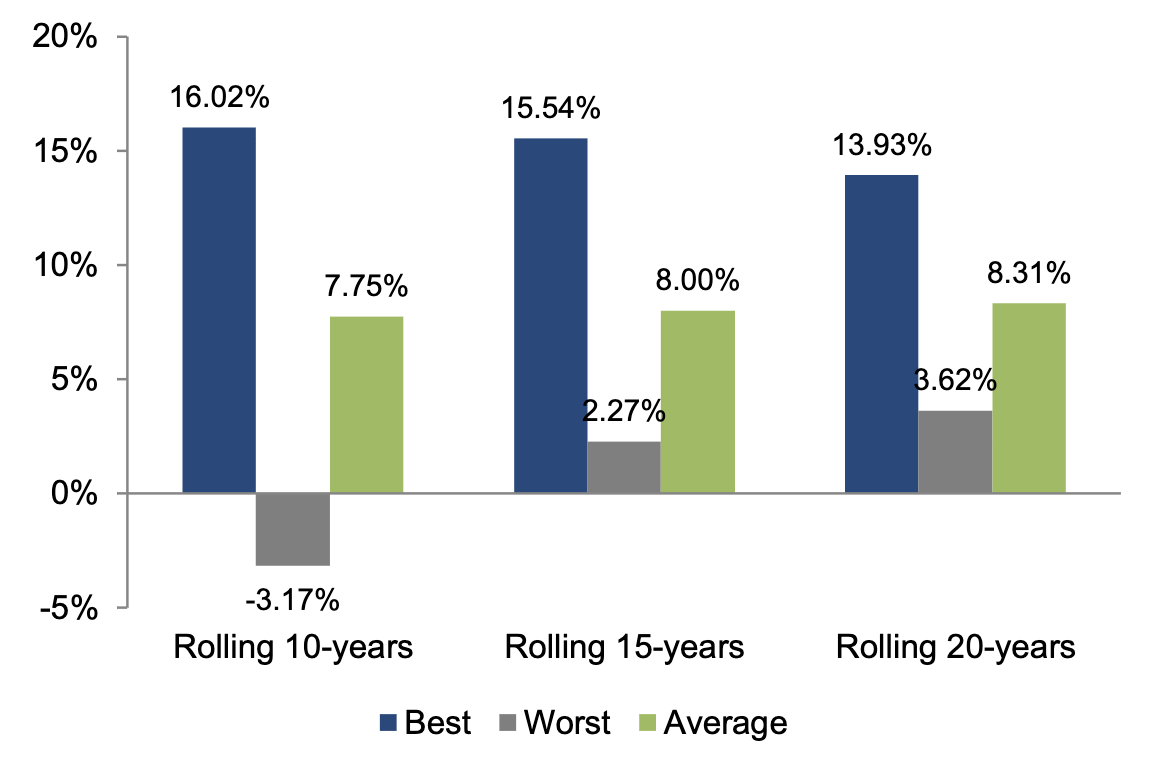
Given time, equities (S&P 500) perform well. The more time you give equities… the better the returns. Below are historical average S&P 500 return measurements for rolling 10-year, 15-year and 20-year periods ending 12/31/19 over a 50-year horizon starting 1969. The table shows an average return of 7.75% for rolling 10-years, 8.00% for rolling 15-years and 8.31% for rolling 20-years. The table below also suggests how difficult it is to average a 10% return for any extended period of time… even 9.00% is not a proven performance attainment:
Best, worst, and average returns
Solution: BUY TIME!
So how do you buy time? The answer is… cash flow match liabilities
How do you buy time? Cash flow match liabilities for the time you need.for the time you need. We recommend funding net Retired Lives out 10-years or more chronologically as the historical equity returns document. Our cash flow matching model (Liability Beta Portfolio™ or LBP) will calculate with precision the cost to fund net liabilities + expenses in a cost-effective manner chronologically.for the time you need. We recommend funding net Retired Lives out 10-years or more chronologically as the historical equity returns document. Our cash flow matching model (Liability Beta Portfolio™ or LBP) will calculate with precision the cost to fund net liabilities + expenses in a cost-effective manner chronologically.
Benefits: Cash Flow Matching
Our LBP also has numerous benefits that enhance the pension plan:
Secures Benefits
Cash flow match monthly Retired Lives benefits chronologically
Reduces Costs
LBP reduces Contribution, Funding and Asset Management Costs:
(LBP Fee = 15 bps… much less than most active bond managers)
Reduces Volatility
Reduces volatility of Contributions and Funded Ratio
Reduces Risk
Risk = Uncertainty of Funding Benefit Payments
(LBP funds benefits with certainty)Projected Benefit Payments are Future Values
(FV have NO Interest Rate Sensitive)
Enhances ROA
LBP should out yield most active management bond portfolios
Buys Time
LBP matches & funds liabilities chronologically
Moves deficit out longer extending the investment horizon
Buys Time for Non-bond assets (Alpha assets) to grow
No dilution of Alpha assets to fund benefits
However, most bond allocations are for active bond management versus a generic index benchmark(s). As the designer of the Lehman bond indexes from my days as the Director of Fixed Income Research at Lehman, I can tell you unequivocally that generic bond indexes look nothing like a projected pension benefit payment schedule. Such a mismatch will distort the cash flows and risk/reward behavior of assets vs. liabilities. The major issues and differences are:
Bond Assets Managed Versus Generic Bond Indexes
Does not fund benefits + expenses
Aggregate Index = low yielding @ 1.42%
Generic bond index =/= plan sponsor’s liabilities
Cash flows do not match plan sponsor’s liabilities
Index skewed to long bonds + Government securities
Performance (value added) = small to none (after fees)
But the worst difference and discrepancy is… all about cash flows. Active bond management is usually focused on outperforming the returns of a generic bond index benchmark. As a result, cash flows are not a consideration. But no matter what generic bond index is chosen; the fixed income assets cannot produce enough income cash flow to fund benefits + expenses. As a result, bonds will require help from performance (Alpha) assets to fund benefits + expenses. This will create dilution and disruption of the growth rate of such performance assets. With the Liability Beta Portfolio™ in place as the core portfolio to fund the shorter Retired Lives net liabilities (1-10 years), the Alpha assets are now free to grow long-term without being diluted or unencumbered to pay any benefits. The example below shows the cash flow difference of bonds managed to a generic index versus cash flow matching to liabilities:
It’s All about Cash Flows!
Bond allocation = $150 million
Liabilities (Net Benefits + Expenses) = $20 million per year
Bond management vs. generic bond index
YTM = 2.50%
Income Cash flow = $3.75 million annual ($2.50% x $150m)
Annual cash flow shortfall= $16.25 million ($20m - $3.75m)
Requires dilution of Alpha assets cash flow to fully fund liabilities
Cash Flow Matching next 10 years
YTM = 3.50% (skewed to A/BBB corporate bonds)
Cash flow = $20 million annual (fully funds liabilities)
(Cash flow includes principal + income + income reinvested)
No dilution of Alpha assets (allowed to grow unencumbered)
Observations:
Generic bond indexes cash flows look nothing like the projected benefit payment schedule of a pension
This leads to mismatch of cash flows and risk/reward behaviors … serious issue over time
Alpha assets need time to perform without any dilution of their cash flows to pay benefits
Cash flow matching (Beta assets) matches plus funds benefit payments chronologically
Cash flow matching will out yield current bond managers and enhance ROA
Cash flow matching buys time for Alpha assets to grow unencumbered
Let the performance (Alpha) assets perform (grow) as the liquidity (Beta) assets provide cash flow sufficient to fund net benefits plus expenses. Pension consultants and plan sponsors should consider installing an LBP as the core portfolio in asset allocation. The best value in bonds is the certainty of their cash flows. Bonds are usually not considered performance assets especially vs. pension liabilities which behave like bonds. As the Alpha assets perform vs. liability growth, enhancing the funded ratio, such excess returns could be transferred over to the Liability Beta Portfolio™ (LBP) to fund and de-risk more liabilities… Portable Alpha. Had this Portable Alpha discipline been in place during the 1990s when funded ratios grew to their highest historical levels with true surpluses… there would be no U.S. pension crisis today!
Conclusion (Logic)
So, is it better to have a 10% cost savings that is immediate and certain with numerous benefits itemized in this report? Or is it better to have an uncertain 10% ROA in the future that may or may not enhance funding (could increase the deficit)?
10% cost savings = $100 million reduced funding costs per $1 billion
10% ROA = 60% funded ratio on $1b = $400m deficit that grows to $522.60m in 6 years or 30.7% higher contribution costs = $122.6m.
Compare: $122.6m more in costs vs. $100m cost savings!!!
I think the facts speak clearly that… cost savings is the better goal and better fit with the primary objective of a pension… but you can have both:
To achieve the primary and secondary pension objective:
Primary = cash flow match net Retired Lives chronologically (Beta assets)
Secondary = have asset growth > liability growth not % ROA (Alpha assets)
Pension Alert: Spread between ROA and Bonds Narrowest in 20+ Years
Most Asset Allocations for pensions are based on achieving the ROA. The ROA is an annual forecast of asset returns. Each asset class is assigned a ROA then weighted by...
Source: Pension Alert: Spread between ROA and Bonds Narrowest in 20+ Years
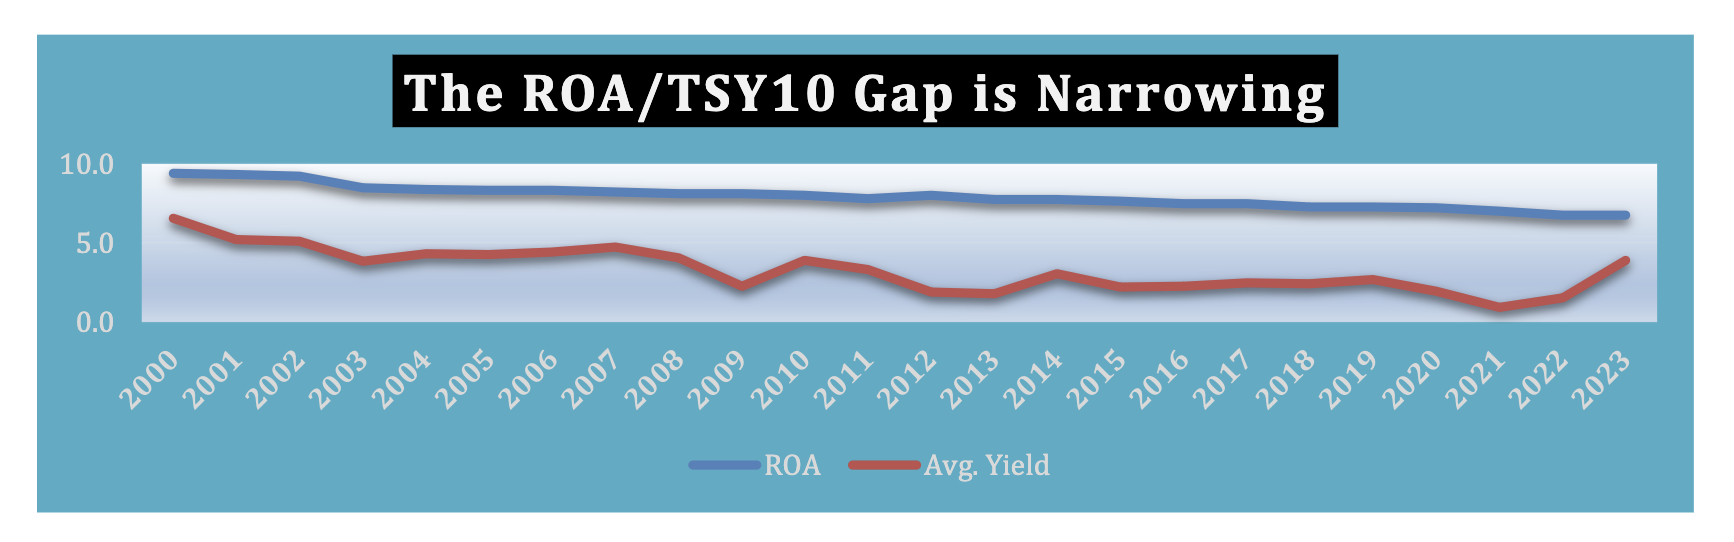
Most Asset Allocations for pensions are based on achieving the ROA. The ROA is an annual forecast of asset returns. Each asset class is assigned a ROA then weighted by the target allocation to get an average or target ROA. Currently, the ROA for most Public pensions is around 6.75%. This is in sharp contrast to the history of reported discount rates (ROA) for funding purposes as reported in the Milliman Public Funding Surveys.
| Year | ROA (%) | Year | ROA (%) | Year | ROA (%) | Year | ROA (%) | Year | ROA (%) |
|---|---|---|---|---|---|---|---|---|---|
| 2000 | 9.4 | 2005 | 8.3 | 2010 | 8.0 | 2015 | 7.7 | 2020 | 7.2 |
| 2001 | 9.3 | 2006 | 8.3 | 2011 | 7.8 | 2016 | 7.5 | 2021 | 7.0 |
| 2002 | 9.2 | 2007 | 8.2 | 2012 | 8.0 | 2017 | 7.5 | 2022 | 6.75E |
| 2003 | 8.5 | 2008 | 8.1 | 2013 | 7.8 | 2018 | 7.3 | 2023 | 6.75E |
| 2004 | 8.4 | 2009 | 8.1 | 2014 | 7.8 | 2019 | 7.3 |
Sources: Milliman Public Funding Surveys
Ryan ALM estimates for 2022 + 2023
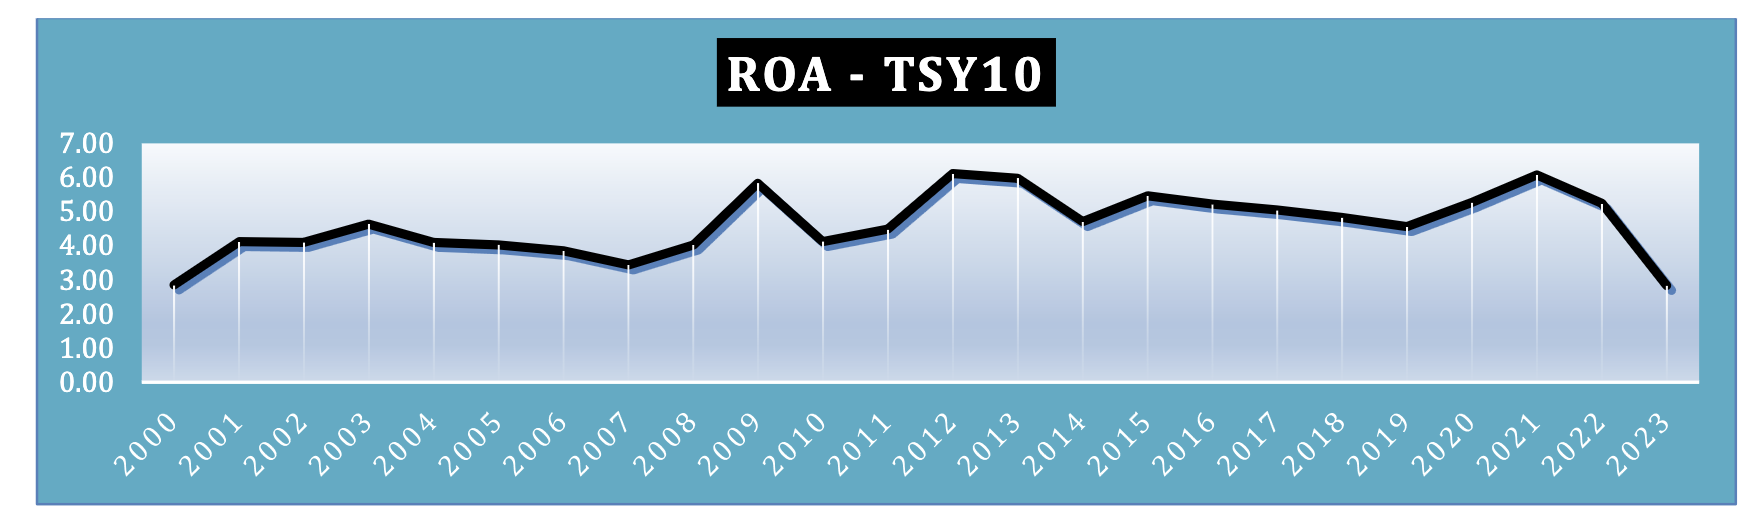
As the Milliman Surveys show, the reported ROAs as discount rates for Public pension liabilities has trended downward from a high of 9.40% in 2000 to somewhere around 6.75% today. Corporate pensions are under ASC 715 discount rates (AA corporate zero-coupon yield curve) and have been reflective of market rates which are consistently much lower than the ROA discount rates. Plotting the ROA discount rates for Public pensions versus the history of 10-year Treasury rates (source: Ryan Treasury Indexes) shows that the yield difference is now at a 22-year low of around 283 basis points (as of 12/31/22). This trend would support a greater allocation to fixed income.
Ryan ALM Advisers uses and promotes A and BBB corporate bonds to cash flow match and defease clients projected liabilities. As a result, the yield spread versus the ROA gets even narrower. The current yield spreads for 10-year corporate bonds versus the 10-year Treasury are:
AA +56 bps
A +75 bps
BBB +114 bps
Using an average yield spread versus the 10-year Treasury for A/BBB corporate bonds = 95 basis points would narrow the ROA – Corporate Bond Yield Spread to 187 basis points. This suggests that fixed income can provide 72% of the target ROA. More importantly, using A/BBB corporate bond portfolio would outyield the BB Aggregate index (bond ROA) by around 75-100 basis points. The BB index YTW levels prove this point:
12/31/22 1/17/23
BB Aggregate = 4.68% 4.32%
BB Corporates = 5.42% 5.03%
Benefits of Higher Bond Allocation to Cash Flow Matching:
Improve Liquidity
Reduce Volatility (risk)
Outyield Index Benchmark and bond ROA
Create CORE portfolio as anchor to earning ROA
Reduce costs to fund Benefits + Expenses (B + E)
Buy TIME for performance assets to grow unencumbered
Greatest Asset of a Pension… TIME!
I recently spoke at the FPPTA conference in Orlando on pension risk management. One of the speakers was Mike Welker, CEO of AndCo Consulting, who I thought had the most...
Source: Greatest Asset of a Pension… TIME!
I recently spoke at the FPPTA conference in Orlando on pension risk management. One of the speakers was Mike Welker, CEO of AndCo Consulting, who I thought had the most incisive comment of the conference. Mike said,“the greatest asset of a pension is time.” He was referencing that pensions have a long-time horizon to work in… perhaps, perpetuity. With such a long horizon, short-term distractions and corrections should not make a pension detour from its long-term goal and strategy. Mike is very right.
Ryan ALM believes that the best way to buy time is to cash flow match a pension plan’s liabilities chronologically. Almost any performance return study on asset classes shows that given time most, if not all, asset classes perform in line with their return and risk expectations. We’ve also observed that pension plans generally sweep cash from all asset classes each month to fund current benefits and expenses (B + E). We urge plan sponsors not to provide liquidity in this way, as S&P 500 data suggests that 47% of the S&P 500 index returns come from dividends and the reinvestment of dividends over 10-year rolling periods since 1940.
We urge plan sponsors and their consultants to separate liquidity assets from growth assets. Let bonds be the liquidity assets. Let bonds fund B + E chronologically for as long as the time you need for the growth assets to grow unencumbered. Based on S&P data, equities outperform bonds 82% of the time on a rolling 10-year basis, which seems like a proper time horizon for a cash flow matching strategy. Buying time should be a major strategy for pension plans and its liquidity needs.
Cash Flow Matching
Cash flow matching is a very old and well tested fixed income strategy. It used to be called Dedication in the 1970-1990s. It is an accurate and tedious process to build a bond portfolio whose cash flows (principal + interest) will cash flow match the liability cash flows (B + E) monthly. It is a future value (FV) matching process not present value (PV), which differentiates it from Immunization and duration matching strategies that are subject to great volatility and uncertainty of cash flows since they are focused on present value matching. Interest rates change every day across the yield curve and term structure of liabilities making PV matching mission impossible. The greatest value of bonds is the certainty of their cash flows (FV). Liability cash flows tend to be quite certain as well, especially for Retired Lives. That is why bonds have been used historically to fund liability cash flows. Today it is referred to as cash flow driven investing (CDI) especially in Europe and Canada. Ryan ALM believes that the value in bonds is the certainty of their cash flows. We do not view bonds as performance or growth assets. We see bonds as the liquidity assets!
Buy Time!
By cash flow matching B + E for the time you need
Let bonds be the liquidity assets and fund B + E chronologically
Let the performance assets grow unencumbered for the time you need (7-10 years)
The Pension ROA is Plural…ROAs
The pension return on assets (ROA) assumption is a critical calculation since it affects both assets (asset allocation) and liabilities (discount rate). Most plan sponsors and their consultants focus on...
Source: The Pension ROA is Plural…ROAs
The pension return on assets (ROA) assumption is a critical calculation since it affects both assets (asset allocation) and liabilities (discount rate). Most plan sponsors and their consultants focus on the ROA as the assets hurdle rate. Asset allocation models use the ROA as the target return. Public and multiemployer pension plans tend to also use the ROA as the liability discount rate.
Asset Allocation
The ROA is usually calculated by first looking at the average historical returns of the index benchmark for each allowable asset class except bonds and cash where the current yield is used. Each asset class is then weighted to come up with the ROA calculation for the total pension fund. The ROA has to be verified by auditors and/or actuaries that such return assumptions used for each asset class are realistic. The range of return assumptions usually stretch from a high of 10% to 12% for Private Equity and Alternatives to a low of 1% for cash and 3% for fixed income.
As a result, each asset class is asked to earn the ROA assigned to them by using their index benchmark as the target return proxy. They are NOT required to earn the pension fund ROA assumption (@ 7% today). This is an important fact to remember in asset allocation. We at Ryan ALM often hear the criticism and question… how can we invest in 3% bonds to earn our ROA (of 7%)? The answer is bonds do NOT need to earn the pension ROA… just their assigned ROA in the asset allocation model.
Better yet, the ROA is usually calculated annually. Interest rates have risen significantly in 2022 allowing current bonds to easily outyield the ROA (even the 1-year Treasury Bill outyields the bond ROA). Since the asset allocation model traditionally uses the Bloomberg Barclay (BB) Aggregate as the fixed income index benchmark (initially the Lehman Aggregate I designed as the head of Fixed Income Research in the late 1970s and early 1980s). This index is heavily skewed to low yielding Government securities (1.77% as of December 31, 2021 and 2.92% on March 31, 2022). If you buy a fixed income portfolio that outyields the BB Aggregate with similar or shorter duration, you are in a good position to earn the ROA assigned to fixed income. Remember… the asset allocation model uses yields not returns for the fixed income ROA. In fact, if you could buy a one-year bond at the yield of the BB Aggregate… you would achieve your annual ROA objective!
But bonds can do better… much better:
Cash Flow Matching – if bonds were used to cash flow match and fund net liabilities (after contributions) chronologically they would produce the liquidity needed to fully fund such net liabilities. Cash flow matching works best with longer coupon bonds where you use semi-annual interest income to partially fund shorter liabilities. A 10-year bond has 20 interest cash flows + one principal cash flow all priced at a 10-year yield. This would eliminate the need to do a cash sweep of other asset classes which is a common liquidity procedure. According to S&P data, the S&P 500 has 48% of its historical returns from dividends and reinvestment since 1940 on a 10-year rolling period basis. Wouldn’t you want to reinvest dividends back into growth assets rather than spend it on funding benefits + expenses? By using bonds as the liquidity assets, the growth assets are left unencumbered to grow. The longer the cash flow matching period, the more time the Alpha assets have to compound their growth. This could significantly enhance the ROA.
Yield on Bonds – As described previously, the ROA forecast for fixed income is based on the current yield of its index benchmark. The Bloomberg Barclay Aggregate is most favored as the bond index benchmark. The Aggregate is a very large, diversified and low yielding portfolio of bonds with the following summary statistics as of December 31, 2021:
| # of issues | 9,982 | Treasury | 39.76% | AAA | 68.92% |
| YTM | 1.77% | Agency | 4.04% | AA | 2.92% |
| Duration | 6.58 yrs. | Mtg. Backed | 29.91% | A | 11.16% |
| Avg. Maturity | 8.78 yrs. | Corporates | 26.29% | BBB | 15.38% |
As a result, most asset allocation models would have a ROA for bonds of about 2.00%. If you can build a bond portfolio that outyields the Aggregate index with similar or shorter duration, by definition, it should enhance the ROA for total assets. Ryan ALM Advisers, LLC has created a cash flow matching product we call the Liability Beta Portfolio™ (LBP). The LBP is a cost optimization model that cash flow matches liability cash flows chronologically at the lowest cost from a corporate bond portfolio skewed to A/BBB bonds.
Based on the actuarial projections of each client we initially build a Custom Liability Index (CLI) to calculate net liabilities ((benefits + expenses) – contributions) chronologically. The CLI provides all the data needed for the LBP to function efficiently. Based on the allocation to the LBP will determine how far out the LBP can fully fund net liabilities. Usually, a 15% allocation to the LBP can fund 1-7 or 1-10 years of net liabilities. Usually, the longer the term structure of the LBP, the higher the yield. The LBP will outyield the Aggregate index by over 50 bps (1-5 years) to over 100 bps (1-10 years) based on the LBP term structure. If the LBP outyields the AGG index by 50 to 100 bps, asset allocation can afford to overweight the bond allocation and still meet the target ROA for total assets. A 15% allocation to an LBP yield of 5.00% is 75 bps value added to the ROA while 15% at BB Aggregate yield of 3.00% is only 45 bps. Said differently, you would need a 25% allocation to a bond total return focus versus the Aggregate yielding 3% today to equal the same ROA value as a 15% allocation at a LBP yield of 5.00%.
3. Higher Interest Rates – bonds are interest rate sensitive as to their market value (present value). Rising US interest rates may or should cause negative returns. However, cash flow matching is focused on funding B + E (Benefits + Expenses) which are future values. Future values are not interest rate sensitive. Bonds are the only asset class with the certainty of cash flows (future values). That is why bonds have always been used as the methodology for defeasance (cash flow matching) of liabilities. Moreover, if interest rates trend upward any reinvestment of cash flow can buy future value at a lower cost. As a result, cash flow matching sees higher interest rates as an opportunity to reduce funding costs.
4.Cash – many pension plans have a cash allocation of around 1% to 3%. Cash is usually the lowest yielding asset. Since the LBP becomes the liquidity assets to fully fund benefits + expenses chronologically, there is little need for cash to fund B+E. Cash might only be needed for capital calls on Private Equity and other Alternative Investments. The LBP should significantly increase the yield margin versus cash since the LBP is using coupon income from all maturities of the LBP and is skewed to A/BBB corporate bonds. With the LBP fully funding B+E, the cash allocation can be reduced to around 1%. Replacing most of the cash allocation to fund B+E with the LBP allocation is another ROA enhancement… it all adds up.
How Bonds Can Enhance the ROA
Given the volatility and uncertainty of the financial markets, bonds can provide Pension Plan Sponsors a strategy to mitigate some of that volatility. Bonds, through the certainty of their cash...
Source: How Bonds Can Enhance the ROA
Given the volatility and uncertainty of the financial markets, bonds can provide Pension Plan Sponsors a strategy to mitigate some of that volatility. Bonds, through the certainty of their cash flows, prove to be a very effective tool. Most pensions focus on earning the return on asset (ROA) assumption as the goal of asset allocation. Because bonds yield less today than the ROA (7.00% average) the asset allocation to bonds tends to be lower than historic norms. But there exists a bond allocation that could enhance the probability of achieving the ROA. Here’s how:
Cash Flow Matching – if bonds were used to cash flow match and fund net liabilities (after contributions) chronologically they would produce the liquidity needed to fully fund such net liabilities. Cash flow matching works best with longer coupon bonds where you use semi-annual interest income to partially fund liabilities. A 10-year bond has 20 interest cash flows + one principal cash flowall priced at a 10-year yield. Having this liquidity would eliminate the need to do a cash sweep from other asset classes which is a common liquidity procedure. According to Guinness Global, the S&P 500 has 47% of its historical returns from dividends and reinvestment since 1940 on a 10-year rolling period basis. Wouldn’t you want to reinvest dividends back into growth assets rather than spend it on funding benefits + expenses? By using bonds as the liquidity assets, the growth assets are left unencumbered to grow. The longer the cash flow matching period, the more time the growth assets have to compound their growth. This strategy and practice could significantly enhance the ROA.
Yield on Bonds – the asset allocation models forecast the return of each asset class in the model, then weight each asset class to get the derived ROA for total assets. The ROA for most asset classes is based on the historical returns of each asset class index benchmark except for bonds. The currentyield on the bond index benchmark(s) is usually used as the forecast for bond returns. The Bloomberg Barclay Aggregate is most favored as the bond index benchmark. This index was designed at Lehman Bros. by Ron Ryan when he was the head of Fixed Income Research & Strategy from 1977 to 1983. The Aggregate is a very large and diversified portfolio of bonds with the following summary statistics as of March 31, 2025:
| # of issues | 13,770 | Treasury | 44.79% | AAA | 3.06% |
| YTM | 4.51% | Agency | 1.29% | AA | 47.86% |
| Duration | 6.08 yrs. | Mtg. Backed | 24.85% | A | 11.38% |
| Avg. Maturity | 8.38 yrs. | Corporates | 24.06% | BBB | 11.43% |
| NR | 25.60% |
As a result, most asset allocation models would have a ROA for bonds of about 4.50%. If you can build a bond portfolio that outyields the Aggregate index, by definition, it should enhance the ROA for total assets. Ryan ALM Advisers, LLC has created a cash flow matching product we call the Liability Beta Portfolio™ (LBP). The LBP is a cost optimization model that cash flow matches liability cash flows chronologically at the lowest cost from a corporate bond portfolio skewed to A/BBB bonds. Based on the actuarial projections of each client we initially build a Custom Liability Index (CLI) to calculate net liabilities ((benefits + expenses) – contributions) chronologically. The CLI provides all the data needed for the LBP to function efficiently. Based on the allocation to the LBP will determine how far out the LBP can fully fund net liabilities. Usually, a 15% allocation to the LBP can fund 1-7 or even 1-10 years of net liabilities. The longer the term structure of the LBP, the higher the yield. The LBP will roughly outyield the Aggregate index by 50 bps (1-5 years) to over 100 bps (1-10 years) based on the LBP term structure. If the LBP outyields the AGG index by 50 to 100 bps, asset allocation can afford to overweight the bond allocation and still meet the target ROA for total assets. A 15% allocation to LBP is 7.5 to 15 bps value added to the ROA.
3.Cash – many pension plans have a cash allocation of around 2%+. Cash is usually the lowest yielding asset. Since the LBP becomes the liquidity assets to fully fund benefits + expenses chronologically, there is little need for cash to fund B+E. Cash might only be needed for capital calls on Private Equity and Alternative Investments. The LBP should significantly increase the yield margin versus cash since the LBP is using A/BBB+ coupon income from all maturities of the LBP. With the LBP fully funding B+E, the cash allocation can be reduced to <1%. Replacing most of the cash allocation to fund B+E with the LBP allocation is another ROA enhancement… it all adds up.
The Risk/Reward of Bonds
Unlike any other asset class, fixed income (bonds) has two risk/reward values: Total Return Certain Cash Flows Total Return Value The total return value in bonds is the converse of...
Source: The Risk/Reward of Bonds
Unlike any other asset class, fixed income (bonds) has two risk/reward values:
Total Return
Certain Cash Flows
Total Return Value
The total return value in bonds is the converse of interest rate movements. When rates go down, as they have from 1981 to 2021, they produce price appreciation and higher total returns. And the opposite happens (negative price returns) when rates go up as they did from 1953 to 1981.
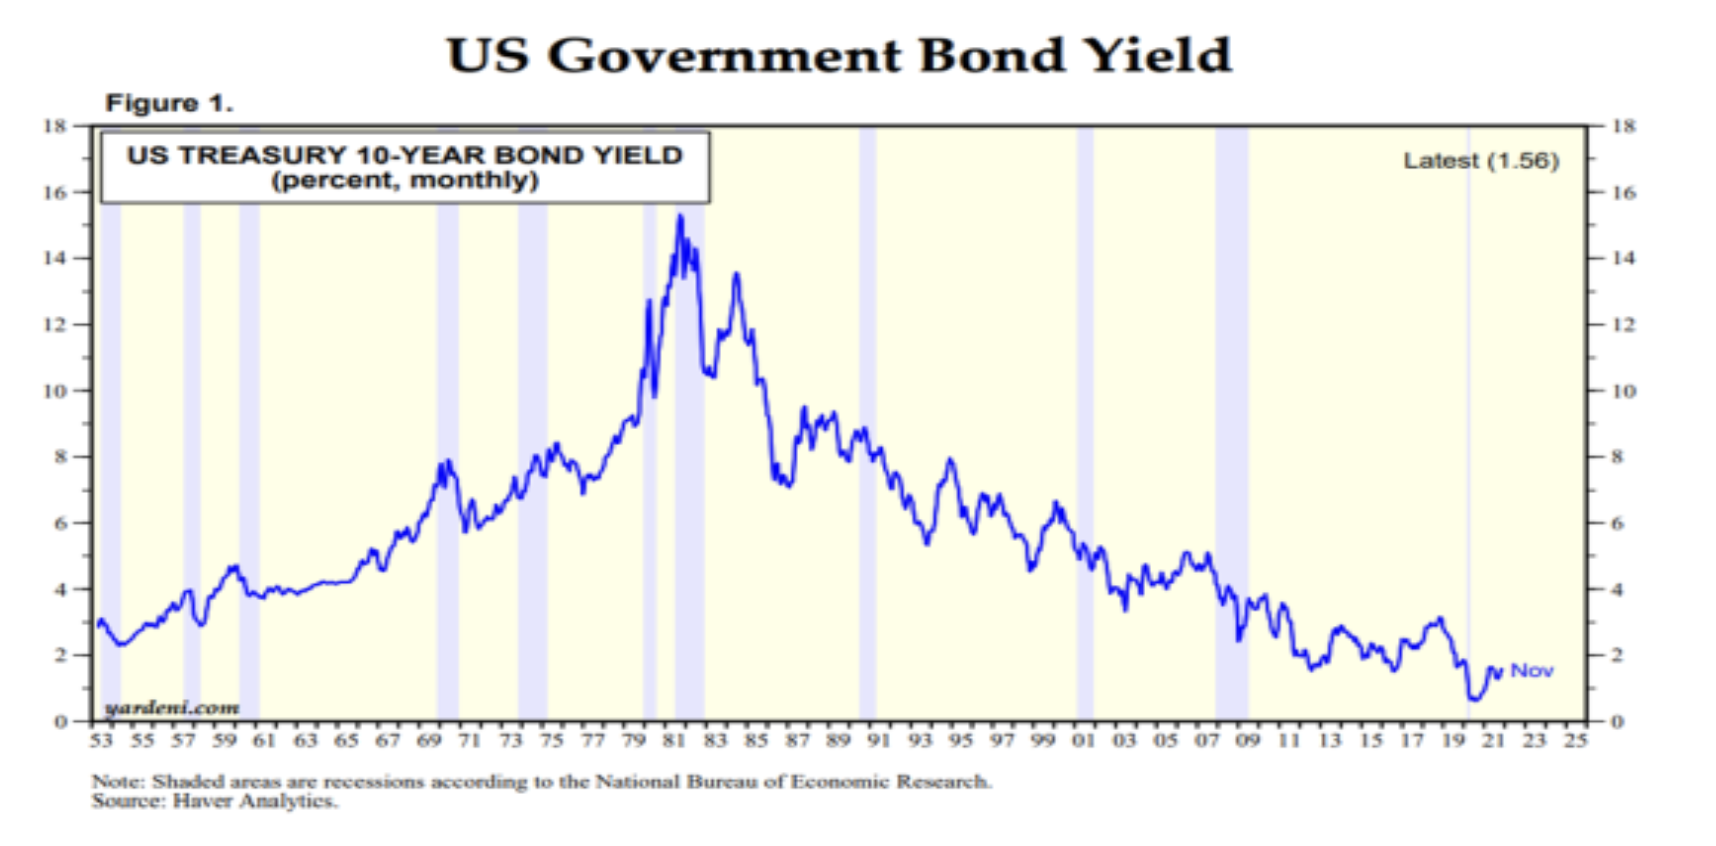
Since the start of 2022, interest rates have trended upward causing negative bond returns (BB Aggregate Index -3.25% YTD thru 02/28/22). Given the current inflation rate of over 7.0% on the CPI and over 9.0% for the PPI, coupled with the expectation that the Fed will raise short rates several times this year… this interest rate trend to higher rates should continue. As a result, pensions should expect negative fixed income returns this year and for the foreseeable future.
Certain Cash Flow Value
If you buy bonds for their intrinsic value (certainty of cash flows) you will immunize or mitigate interest rate risk! Since cash flows are future values, they are not affected by interest rate movements.Moreover, any excess cash flow reinvested will be able to buy new cash flows at reduced costs. This is truly the value in bonds and we strongly recommend that pensions use bonds as their liquidity or Beta assets. Let the performance or Alpha assets be the non-bond assets. Use bonds to cash flow match pension benefits and expenses chronologically. This synergy of Beta and Alpha assets should secure benefits, reduce funding costs, and buy time for the Alpha assets to grow unencumbered.
Cash flow matching by any name (defeasance, dedication, immunization) may be the oldest fixed-income strategy. It should be the core portfolio of a pension and the fixed income strategy chosen by pensions today given the likelihood of higher interest rates. Cash flow matching will secure benefits in a cost-efficient manner. The Ryan ALM cash flow matching product (Liability Beta Portfolio™) will reduce funding costs by about 1% per year of matching (i.e. 1-10 years = 10% funding cost reduction).
With the stock market struggling this year (S&P 500 -10.7% YTD thru 03/07/22), a cash flow matching bond allocation will buy time for the equity allocation to recover without any dilution to fund benefits and expenses. Let bonds be the liquidity assets to fund benefits + expenses. Let the growth assets grow unencumbered without any dilution. History tells us that 48% of the S&P 500 returns on a rolling 10-year basis come from dividends reinvested.
NIRS Innovative Pension Funding Strategies
The NIRS pension objectives for this paper are: Reduce contribution volatility Promote intergenerational equity Keep plan on sound funding trajectory Cash Flows (Future Values versus Present Values) Pensions are all...
Source: NIRS Innovative Pension Funding Strategies
The NIRS pension objectives for this paper are:
Reduce contribution volatility
Promote intergenerational equity
Keep plan on sound funding trajectory
Cash Flows (Future Values versus Present Values)
Pensions are all about cash flows: asset cash flows versus liability cash flows. It is the future value of these cash flows that are the most meaningful and need to be monitored. Asset cash flows are pension assets (A) to grow at some ROA forecasted rate + projected contributions (C). Liability cash flows are projected benefit payments (B) + projected administrative expenses (E). The formula of: (A + C) – (B + E) is what dictates the soundness and solvency of any pension. However, funded ratios and status are based on the present value of A/B or A – B. Contributions and expenses are not included in the funded ratio/status. Contributions are the first source to fund B + E. Accordingly, assets fund net liabilities not gross. This is the first innovative funding strategy: subtract contributions from B + E to calculate net liabilities. Have assets focus on fully funding net liabilities. Indeed, GASB requires an asset exhaustion test (AET) as a test of solvency which takes cumulative projected A + C minus projected B + E on an annual basis to determine how far out is the plan solvent. The AET is truly the battlefield that the pension asset/liability game is played on and should play a major role in asset allocation.
Present values may help us understand if we are on track like a scoreboard but can be very misleading. Take for example, two portfolios: one is 100% in Treasuries yielding 1.75% and the second portfolio is 100% in corporate bonds yielding 2.50%. They have the same present values, but their future values are much different by as much as 20% to 30% depending on maturities. They have the same funded ratio and status, but they are certainly different in pension solvency. The same problem exists with asset smoothing and actuarial valuations. Only a market valuation will tell you the true or accurate economic value. Imagine your bank telling you that they cannot provide your current balance but only the five-year average balance. Would you be comfortable writing a check on that information? Asset liability management (ALM) requires accurate and frequent information in order to be successful.
Return on Asset Assumption (ROA)
Assets need to know what they are funding… net not gross liabilities. The AET can be modified to calculate the ROA needed for assets to fully fund net liabilities. This is the second innovative funding strategy: calculate the ROA based on the AET and not asset allocation. Currently, the ROA is calculated based on what asset allocation tells us is a high probability of achieving a target return given a certain asset allocation. This in no way tells us if this ROA is capable of achieving accurate full funding, which is the true goal of the assets. The ROA may be too high creating surpluses and higher contribution costs (too often the result). The AET can be used to calculate what ROA will fully fund residual net liabilities. This accurately determined ROA will now be the hurdle rate for asset allocation.
Assure Plan Remains on Sound Funding Trajectory
It is the future value of A + C versus B + E that counts. That is what the AET focuses on and what assets should focus on. Since we only know the future value of bonds with certainty then bonds should be the core or Beta portfolio. This is the third innovative funding strategy: install a Beta portfolio to cash flow match net liabilities chronologically. The Beta assets are the liquidity assets to fund B + E chronologically and buy time for the Alpha or growth assets to grow unencumbered. Asset allocation should initially focus on the weighting of Beta + Alpha assets that produce the highest probability of fully funding B + E net of C. The question of how much is allocated to the Beta assets is based on the how well funded the plan is. The higher the funded ratio, the greater the allocation to Beta assets. Logically, you want the Beta assets to fund the next 10-years since history tells us that the alpha assets need time to perform and grow. This will allow the Alpha assets to reinvest their dividends and income streams. Historically, about 48% of the S&P 500 growth on a 10-year rolling basis since 1950 comes from dividends and reinvestment.
This is not how asset allocation has worked for decades. Instead, asset allocation is based on achieving a target ROA which favors a high allocation to riskier (Alpha) assets no matter what the funded status is. Two plans, one at 40% funded and the other at 80% funded should have distinctly different asset allocations. But if they have the same ROA, they will have the same or similar asset allocations. This was the asset allocation mistake made in the 1990s when public pension plans had surpluses. Why didn’t they secure B + E and the surplus with a high allocation to Beta assets that would have cash flow matched B + E for many years? Instead, they reduced their allocation to bonds to achieve a ROA target return as interest rates were going down in a secular trend over 38 years. The equity correction of 2000-02 sent funded ratios into deep deficits and spiking contribution costs which public pensions have not yet cured.
Reduce Contribution Cost Volatility
Cash flow matching (CDI) with bonds reduces contribution cost volatility by definition. It will fully fund B + E chronologically thereby reducing contribution cost volatility in the area it is funding (i.e., 1-10 years). CDI is based on matching and funding future values not present values. This eliminates the actuarial noise from actuarial valuations. It also mitigates interest rate risk which is the dominant risk factor in bonds. The future value of B + E is not very volatile especially on shorter projections (i.e., 1-10 years). Moreover, CDI will rebalance whenever actuarial projections change to always be cash flow matched to projected B + E. It also assures that the pension plan remains on a strong fiscal path. The certainty of their cash flows is the value of bonds and why bonds have always been used for cash flow matching, defeasance, dedication and immunization. A cash flow matching portfolio should be the anchor or core portfolio for prudent pension ALM.
Intergenerational Equity
The AET will calculate the residual or remaining assets based on fully funding B + E after C. As a result, you want AET to show an increase in assets or, at least, show the initial assets as the remainder so intergenerational equity has improved its asset position or no dilution of assets. The AET is certainly the best measurement for intergenerational equity and should be monitored annually.
Hypothetical Pension Plan
Applying our innovative funding strategies to the NIRS hypothetical pension plan, we first calculated net liabilities (B + E) – C by using the projected B + E provided by NIRS and taking contributions (normal cost) of $184.75 million and growing it at 3% for payroll inflation which creates a constant 12% of payroll contribution cost. We ran three asset exhaustion test (AET) versions (see link _____________________):
Keeping Contributions as a constant 12% of payroll with 3% inflation grows contribution costs to exceed B + E by 1/01/64. As a result, a ROA of less than 3% will fully fund all projected B + E thru 12/31/99.
Removing Contributions after 1/01/64 (crossover point where C > B + E) would result in a ROA of 4.63% to fully fund all projected B + E thru 12/31/99.
Freezing Contribution costs at the initial amount would result in a ROA of 6.19% to fully fund all projected B + E thru 12/31/99.
The major point of this exercise is to show and prove that the ROA is not a calculated number based on the funded status. If the mission of pension assets is to fully fund B + E in a cost-efficient manner with prudent risk, then assets need to know the correct ROA needed to accomplish this mission. But that is not what happens today with the ROA and asset allocation. A rounded ROA hurdle rate is commonly used based on the asset allocation model with no regards to the funded status. As a result, a surplus funded status and a significant deficit funded status could have the same ROA if that they had the same or similar asset allocation. This is not logical or in the best interest of the plan solvency. Again, my example of what happened in the 1990s which led to spiking contribution costs in the early 2000s and beyond should never be repeated.
Today, most public plans have seen an improvement in their funded status but little or no change in their asset allocation. To be true to the pension objective, asset allocation needs to be responsive to the economic funded status based on valuing assets and liabilities on market valuations not actuarial valuations. We ran a Custom Liability Index (CLI) to compare and calculate the present value of B + E before and after C based on both a 7% ROA and an ASC 715 discount rate of 2.61%. Here are the calculations:
Custom Liability Index
| Assets | $7,665,500,000 | $7,665,500,000 |
| Gross Liabilities (w/o Contributions) | $40,998,000,000 | $40,998,000,000 |
| PV of Gross CLI (w/o Contributions) | $9,259,823,437 | $19,351,264,070 |
| Funded Ratio | 82.78% | 39.61% |
| PV of Net CLI (C @ 3% growth to 1/1/64) | $5,349,624,369 | $11,215,430,808 |
| Net Funded Ratio (with C) | 143.29% | 68.35% |
Noticeably, there is a significant difference in PV based on the two discount rates (ROA vs. ASC 715). Which one provides the best calculation of the true economic funded ratio/status? Which one should asset allocation be focused on? Certainly, the ASC 715 is based on reality… current market rates. FASB accounting rules clearly state that the discount rate should be a rate that can settle the liabilities… a rate you can buy to defease liabilities. The ROA discount rate is eliminated here since it is a rate that you can NOT buy.
Cash flow matching (CDI) with bonds focuses on future values and eliminates this confusion over discount rates and the correct present value of liabilities and funded ratio/status. Our third innovative funding strategy is to install CDI as the core portfolio or liquidity assets to fully fund B + E (net after contributions) for as far out as makes sense. Logically, the CDI allocation should allow for the asset allocation to achieve the new calculated ROA. Based on the AETs we ran, it looks like a 4.63% ROA is the proper hurdle rate if C are used to initially fund B + E up to 1/01/64 leaving net liabilities to be funded by the assets. This would suggest that 47% invested in CDI yielding 2.00% + and 53% invested in residual assets earning 7.00% would earn the 4.63% hurdle rate. This is the prudent approach to a calculated ROA and a responsive asset allocation to fully funding (B + E) – C. It is also a far more conservative asset allocation than that of most plans that should lead to significantly reduced volatility of returns, contribution expenses, and the plan’s funded status while keeping the plan on a sound funding trajectory.
Resume
Ronald J. Ryan, CFA
——
CEO and founder of Ryan ALM, Inc. in 2004. Ryan ALM provides a turnkey system for pensions that reduces cost and risk based on three synergistic and proprietary models:
ASC 715 Discount Rates
Custom Liability Index (CLI)
Liability Beta Portfolio™ (LBP)
The CLI and LBP cash flow matching model are both unique in the pension industry. The index division of Ryan ALM also provides custom indexes for ETFs.
Prior to creating Ryan ALM, Mr. Ryan founded Ryan Labs, Inc. in 1988 which became one of the largest Enhanced Bond Index Fund managers in America. In 1982, he founded the Ryan Financial Strategy Group (RFSG) which was a fixed income quantitative firm focused on helping bond managers outperform bond Indexes. At RFSG, he and his team created many unique financial models and index innovations. Mr. Ryan is the former Director of fixed income research at Lehman Bros. Kuhn Loeb from 1977–1982 where he designed most of the popular Lehman bond indexes.Prior to Lehman, he was the head of fixed income for the First in Dallas from 1973-1977, the largest bank holding company in Texas. From 1966-1973 he was a security analyst at Pan-American Life Insurance company, the largest institutional investor in Louisiana.
Mr. Ryan has a CFA degree, and a MBA and BBA from Loyola University.