
Ryan ALM
White Papers
Browse
The Pension Crisis of 2000-02
In my 2013 book “The U.S. Pension Crisis” I detailed the causes of the 2000-02 pension crisis where funded ratios deteriorated significantly from a surplus position in the 1990s. This...
Source: The Pension Crisis of 2000-02
In my 2013 book “The U.S. Pension Crisis” I detailed the causes of the 2000-02 pension crisis where funded ratios deteriorated significantly from a surplus position in the 1990s. This created a spike in contribution costs for many years which I labeled as the U.S. pension crisis… it was actually a contribution cost crisis. Contribution costs for many pensions rose quickly by 5x to 10x or even more in a short period of time. This led many cities and states into a budget shock and some even filed for bankruptcy (i.e. Detroit, Harrisburg, Jefferson County, Stockton).
The major cause of this dilemma, I reasoned, was the asset allocation objective of achieving a ROA (about 8.00% then). This was in sharp contrast and conflict with the true pension objective… to fund benefits (liabilities) in a cost-effective manner with prudent risk.
With funded ratios in a surplus position in the late 1990s. most pension plans could have defeased their liabilities with a bond allocation that used a cash flow matching (CFM) strategy. This CFM strategy would have secured benefit payments and kept contribution costs very low. This used to be called Dedication in the 1970s and 1980s and was a widespread strategy then. CFM gives certainty that the asset cash flows will fully fund the liability cash flows at the lowest cost to the plan sponsor. But because interest rates were well below the ROA of 8.0% in the late 1990s, asset allocation models heavily skewed their weights to equities and other non-bond risky assets to try to earn this 8.0% ROA hurdle rate.
When the equity correction hit in 2000 it was quite severe for pensions. Not only did the equity assets have negative growth but due to a secular decline in interest rates from 1982 this translated into high pension liability growth since they behave like bonds. According to Federal Reserve calculations, the average asset growth for public pensions underperformed the average liability growth by about 73% in the period 2000-02 as follows:
| Assets | Liabilities | Difference | Cumulative | |
|---|---|---|---|---|
| 2000 | -2.50% | 25.96% | -28.46% | -28.46% |
| 2001 | -5.40% | 3.08% | -8.48% | -37.60 |
| 2002 | -11.41% | 19.47% | -30.88% | -73.40% |
2000AssetsLiabilitiesDifferenceCumulative2000-2.50%25.96%-28.46%-28.46%2001-5.40%3.08%- 8.48%-37.602002-11.41%19.47%-30.88%-73.40%
This underperformance caused pension funded ratios to go from a nice surplus to a deep deficit creating the spike in contribution costs. According to the Federal Reserve System data the average funded ratio for state pension funds was 58.9% as of 2002 from a surplus position in 1999.
for their asset allocation models. According to the 2024 Milliman study the average asset allocation for public pensions is skewed to equities at 76% with bonds at 21% down from 24% 10 years ago.
Given the performance of equities in recent years, we may be nearing a correction similar to 2000-02 based on some key criteria:
Reversion to the Mean
This is a common and logical concept. The S&P 500 has a mean return of 9.75% for 20 years and 9.90% for 30 years with dividends. The last 5 years has a mean return of 11.33% and 10 years = 12.39%. This suggests a possible negative growth for the near future to revert to the mean.
P/E Multiple
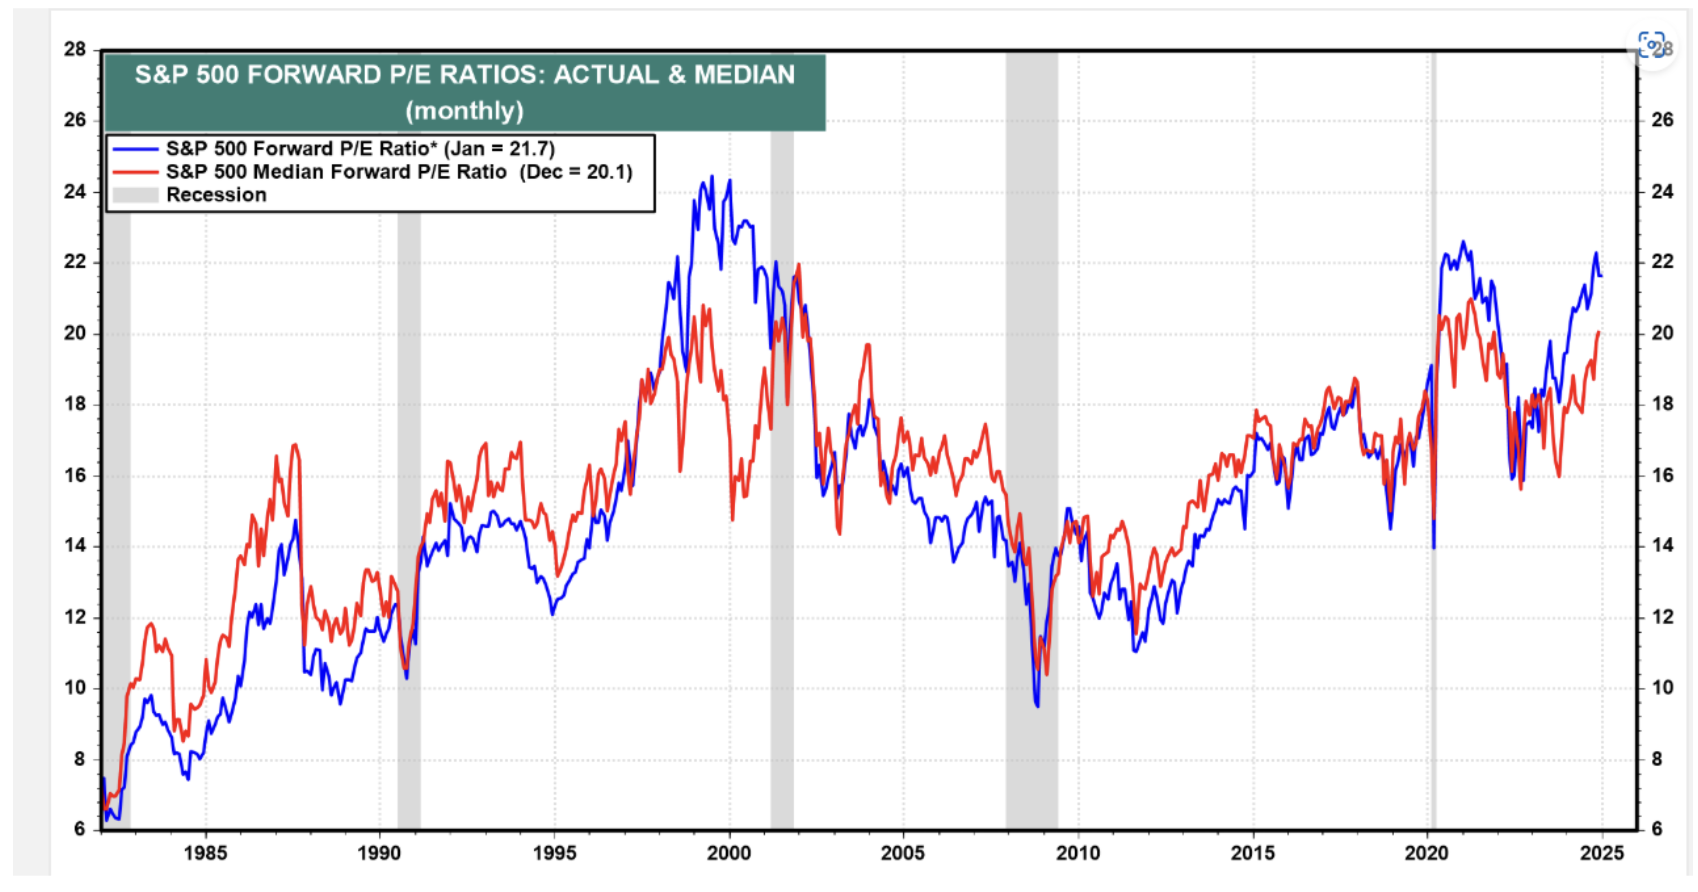
Valuation is another key determinant. Based on forward earnings, the current forward P/E for the S&P 500 is around 24.26x today. The graph below by Yardeni shows it at 21.7x on Jan. 23. The point here is that the forward P/E today is above the median P/E of 20.1x and is near a 25 year high which happened in 2000.
Déjà Vu
Pensions need to protect and enhance their funded status. They cannot afford volatility in the funded ratio and contribution costs. Now is the time to address asset allocation by shifting assets to a cash flow matching strategy. We recommend a minimum of defeasing the 1-10 year liability cash flows. This would buy time for the risky assets to grow unencumbered and recover from any correction. It also eliminates the need for a cash sweep that reduces the ROA of stocks significantly.