
Ryan ALM
White Papers
When is a Pension Fully Funded?
The Funded Ratio tends to be the acid test and benchmark for funded status… but is it? We have written several research white papers (www. RyanALM/Research/White Papers) about the glaring...
Source: When is a Pension Fully Funded?
The Funded Ratio tends to be the acid test and benchmark for funded status… but is it? We have written several research white papers (www. RyanALM/Research/White Papers) about the glaring issues with the Funded Ratio. Here are just a few of the inconsistencies with the Funded Ratio:
Actuarial Value versus Market Value
The Funded Ratio (FR) of a pension is usually based on the actuarial value of assets / actuarial value of liabilities. The Funded Status (FS) is the actuarial value of assets – actuarial value of liabilities. Actuarial values are different than market values… sometimes quite different. Market values are the better measurement of economic reality since you can’t spend actuarial dollars. As a result, this valuation difference can seriously distort the FR and FS calculation.
Present Value versus Future Value
Notably, the FR and FS are present value calculations. But pension liability cash flows (benefits + expenses (B+E)) are future value (FV) projections. Since the FV of most assets is not known this becomes a true pension conundrum. Bonds are the only asset class with a known and certain future value. That is why bonds have been the chosen asset class for defeasance, immunization and cash flow matching for several decades. The disconnect between PVs and FVs haunts pensions. The true objective of a pension is to secure and fully fund liability cash flows in a cost-efficient manner with prudent risk. As a result, the objective should be for asset cash flows to match and fully fund liability cash flows.So, when is a pension fully funded... when asset cash flows (future values) fully fund liability cash flows (future values). This is best accomplished thru cash flow matching and is best measured by the Asset Exhaustion Test.
Contributions = MIA
The FR and FS both ignore contributions as an asset. The truth is that contributions are future assets and should be a high consideration in any asset liability management (ALM). We recommend using the Ryan ALM modified Asset Exhaustion Test (AET) as the best way to measure the solvency and funding status of a pension. We take asset cash flows (based on a ROA) and compare them to NET liability cash flows (benefits + expenses – contributions) to understand if assets can fully fund the liability cash flows. We use a matrix of ROAs to determine what ROA is the best fit. This calculated ROA is in sharp contrast to the current ROA that is based on an asset allocation model that ignores the FR and FS. It is common that a pension plan with a 60% funded ratio and another funded at 90% have the same or similar ROA. How is this possible? Shouldn’t the 60% funded plan need assets to work harder? Yes, but that does not have anything to do with the current ROA calculation. Whatever shortfall there is in asset cash flows to fund liability cash flows (B+E) must be paid by higher contributions… this is not in the best interests of a pension plan and the sponsor’s budget. Clearly, the current ROA is not a calculated return based on the FR and FS that will guarantee a fully funded
status if achieved long-term… nor will it guarantee that contributions will go down. This has been a sad and costly trend for the last 25+ years.
Discount Rates
A most troubling issue is what discount rate to use. FASB and GASB tend to disagree on this.
FASB = high quality AA corporate zero-coupon yield curve
GASB = ROA
Since the ROA is a much higher rate (usually 100 to 200 bps) then liabilities would be priced at a much lower PV (12% to 24%). This would enhance the FR by 8% to 22%. Market rates are best in determining the market or economic value of liabilities. FASB 144 says it well:
“The objective of selecting assumed discount rates is to measure the single amount that, if invested at the measurement date in a portfolio of high-quality debt instruments, would provide the necessary future cash flows to pay the pension benefits when due. Notionally, that single amount, the projected benefit obligation, would equal the current market value of a portfolio of high-quality zero coupon bonds whose maturity dates and amounts would be the same as the timing and amount of the expected future benefit payments. The determination of the assumed discount rate is separate from the determination of the expected rate of return on plan assets”
Ryan ALM Solutions:
Custom Liability Index (CLI): The first step in prudent pension management is to calculate the liability cash flows that assets must fund. This should be a net liability cash flow (benefits + expenses – contributions). Until liabilities are monitored and priced as a Custom Liability Index (CLI) the asset side is in jeopardy of managing to the wrong objectives (i.e. ROA and generic market indexes). Only a CLI best represents the unique liability cash flows of a plan sponsor. Just like snowflakes, no two pension liability schedules are alike due to different labor forces, salaries, mortality and plan amendments. How could a static ROA or genericmarket indexes ever properly represent the risk/reward behavior of such a diverse array of pension liabilities? Once the CLI is installed, the pension can now know the true economic Funded Ratio and Funded Status which should dictate the appropriate Asset Allocation, Asset Management and Performance Measurement.
Asset Exhaustion Test (AET): GASB requires a test of solvency (AET) to document that the asset cash flows (at the ROA) will fully fund the net liability cash flows (benefits + expenses – contributions). GASB correctly understands that assets are funding net liabilities after contributions… and that contributions are future assets. This net liability is rarely focused on by the asset side in asset allocation. Ryan ALM enhances the asset exhaustion test by calculating the ROA that will fully fund net liability cash flows. Usually, we find that a lower ROA can accomplish this goal and is a better fit than the current ROA. This would suggest a more conservative asset allocation and a heavier allocation to fixed income to defease liability cash flows chronologically. This is a common and serious issue. This calculated ROA should be the asset allocation model focus. We urge all pensions to incorporate this modified AET before acting on asset allocation.
Liability Beta Portfolio™ (LBP):The intrinsic value in bonds is the certainty of its cash flows. That is why bonds have been used for decades to defease liability cash flows. The core or Beta portfolio for a pension should be in investment grade bonds that cash flow match and fully fund liabilities chronologically thereby buying time for the growth (Alpha) assets to outgrow liabilities and erase the deficit. The proper Beta portfolio for any liability objective should be… a Liability Beta Portfolio™. Ryan ALM has developed a LBP which will cash flow match liabilities chronologically and reduce funding costs by about 2% per year (1-10 years = 20%) as well as reduce the volatility of the Funded Status and contribution costs. The LBP should be the core portfolio of any pension and replace active fixed income management. By matching and funding liabilities chronologically, the LBP buys time for the growth or Alpha assets (non-bonds) to perform. By working in harmony with the Alpha assets the plan can gradually enhance its funded status and reduce contribution costs.
Liability Alpha Assets: The non-bond assets should be managed vs. the CLI to exceed liability growth (earn liability Alpha) and enhance the economic Funded Status. The goal here is outgrow liabilities in $s (relative returns) by enough to erase the deficit over a time horizon equal to the average life (duration) of liabilities (calculated by the CLI). As the Alpha assets achieve the required annual Alpha, any excess returns vs. liability growth should be ported over to the Liability Beta Portfolio™ to secure the victory. Had this been in place during the decade of the 1990s when pensions had surpluses… there would be no pension deficits today.
Ryan ALM, Inc. Celebrates 20th Anniversary
Ryan ALM, Inc. Celebrates 20 th Anniversary Mission: Protecting and Preserving Pensions Ryan ALM, Inc. was incorporated in Delaware on June 15, 2004. Ronald J, Ryan, founder, says that “we...
Source: Ryan ALM, Inc. Celebrates 20th Anniversary
Ryan ALM, Inc. Celebrates 20th Anniversary Mission: Protecting and Preserving Pensions
Ryan ALM, Inc. was incorporated in Delaware on June 15, 2004. Ronald J, Ryan, founder, says that “we created our company to be dedicated to asset liability management (ALM) as our name suggests. We are quite proud of our progress and achievements in ALM. We have built a turnkey system of products that are quite unique in the ALM industry that we treat as assets shown on our balance sheet, to include:
Custom Liability Index (CLI) – assets need to know what they are funding. Usually, it is monthly net liabilities (benefits + expenses – contributions). Such net liabilities are based on actuarial projections even though actuaries do not calculate net liabilities. The CLI is the proper benchmark for all LDI and ALM objectives. The CLI performs numerous calculations including present values, duration, growth rates, interest rate sensitivity, YTM, etc.
ASC 715 Discount Rates – Ryan ALM is one of few vendors providing ASC 715 discount rates in conformity to FASB. We produce four unique yield curves of AA zero-coupon corporate bonds. Usually, our discount rates are higher than our competitors providing for lower liability valuations and enhanced balance sheets.
Liability Beta Portfolio™ (LBP) – our asset management division, Ryan ALM Advisers, LLC, is entirely focused on cash flow matching as our only ALM product we call LBP. We feel strongly that our LBP provides the most benefits in harmony with the true pension objective of funding liabilities in a cost-efficient manner with prudent risk. Our LBP matches and funds monthly liability cash flows with certainty while reducing funding costs by 2% per year (20% on 1-10 year liabilities). Our LBP will outyield the CLI and enhance the ROA for bonds.
Performance Attribution Report (PAR) – given our CLI, we can calculate the relative risk/reward behavior of assets (as measured by our LBP) versus liabilities (as measured by the CLI). PAR calculates 14 risk/reward measurements including two graphs to clearly show the value added (or lost) of assets versus liabilities. This should be critical information for consultants and plan sponsors to understand how well the plan is being funded.
Asset Exhaustion Test (AET) – assets need to know the hurdle rate or ROA needed to fully fund net liabilities. The current ROA most pensions use is not an accurate calculation of a hurdle rate. Our AET clearly shows the annual difference of asset cash flows versus liability cash flows. We calculate a matrix of ROAs to arrive at the most applicable target ROA. Usually our calculated ROA (AET) is much different and lower than the current ROA since we focus on net liabilities not gross liabilities which reduces the liability cash flows assets need to fund (perhaps significantly).
We are very proud of our synergistic system and thankful for our team of experts with over 168 years of experience. Ryan ALM remains dedicated to achieving the true pension objective of funding liabilities with low cost and low risk.”
Ryan ALM Pension Monitor YTD 2023
YTD2023 Ryan ALM Pension Monitor (Through June 30, 2023) Pension plan liabilities need to be measured and monitored regularly. Without knowledge of plan liabilities, the allocation of plan assets cannot...
Source: Ryan ALM Pension Monitor YTD 2023
(Through June 30, 2023)
Pension plan liabilities need to be measured and monitored regularly. Without knowledge of plan liabilities, the allocation of plan assets cannot be done efficiently or appropriately. The funded ratio/status of pension plans are present value calculations. Each type of plan is governed by accounting rules and actuarial practices, which determine the discount rate used to calculate the present value of liabilities. Single employer corporate plans are under ASC 715 (FASB) discount rates (AA corporate zero-coupon yield curve); multiemployer plans and public plans use the ROA (return on asset assumption) as the liability discount rate. The difference in liability growth between these plans can be quite significant (see 2022’s differential of 31.5%), which will affect funded status and contribution levels.
The table below compares these different liability growth rates (based on a 12-year average duration) versus the asset growth rate based on the P&I asset allocation survey of the top 1,000 plans which is updated annually.
| ASSET ALLOCATION | YTD 2023 Return | Corporate | Public | Union |
|---|---|---|---|---|
|
Domestic Stock International Stock Global Equity Domestic Fixed Income Global Fixed Income Cash Private Equity Real Estate Equity* Other |
16.9% 12.2% 14.3% 2.1% 1.7% 2.3% 5.8% -5.4% 3.6% |
11.1% 6.1% 6.3% 44.4% 0.9% 2.2% 12.4% 5.5% 11.1% |
22.1% 13.4% 4.5% 19.4% 1.6% 1.6% 15.1% 11.6% 10.7% |
18.7% 9.1% 13.6% 28.9% 0.0% 0.7% 10.7% 9.4% 8.9% |
| TOTAL ASSETS Growth Rate | 5.3% | 7.1% | 7.3% | |
| LIABILITIES Growth Rate** | 4.2% | 3.6% | 3.6% | |
| Asset Growth – Liability Growth | 1.1% | 3.5% | 3.7% |
Index Benchmarks: Domestic Stock = S&P 500; Int’l Stock = EAFE, Global Equity = All Country World; Domestic Fixed Income = BB Aggregate; Global Fixed Income = FTSE World Gov’t (unhedged); Cash = Ryan ALM Cash Index; Private Equity =10-year return for the R2500 + 2%; *Real estate Equity =NFI-DP Index (one month lag); Alternative Investments and Other = CPI-U & 3%.
** Liabilities (corporate) = Ryan ALM ASC 715 discount rate and Liabilities (Public, Multiemployer) = 7.25% ROA
The graph below shows the contrasting annual differences of asset versus liability growth for corporate and public plans since 2015. The impact of different accounting rules (FASB vs. GASB) can create confusion, as reflected in the chart below.
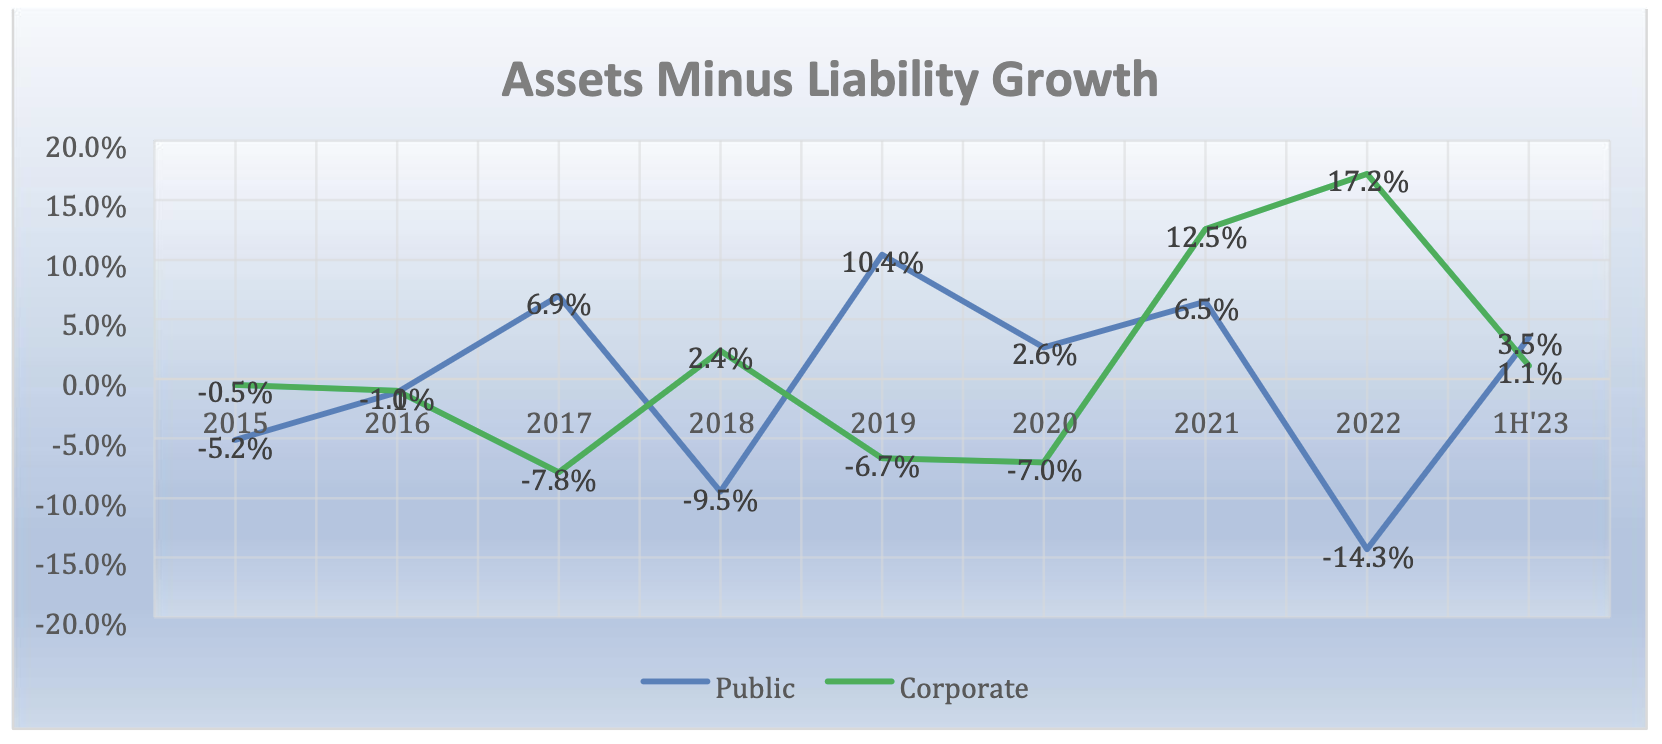
Footnote: The measurement of asset growth to liability growth is an annual calculation beginning on December 31, 2015. For periods shorter than 1-year, the observation is a YTD calculation.
With regard to the first half of 2023, Corporate funding underperformed Public funding as declining interest rates YTD had a slightly greater impact on the present value of a plan’s future benefits. In addition, the much higher exposure to US fixed income within corporate pension plans (44.4%) versus both public (19.4%) and multiemployer (28.9%) and the far less exposure to US equities (11.1%) versus publics (24.4%) and multiemployer (21.8%) had a meaningful impact on the average total return for those plan types.
How To Hedge Interest Rate Risk
Pension funds are faced with numerous risk factors. Perhaps, the greatest risk factor is Interest rate risk. If affects assets but especially liabilities. How pensions cope with Interest rate risk...
Source: How To Hedge Interest Rate Risk
Pension funds are faced with numerous risk factors. Perhaps, the greatest risk factor is Interest rate risk. If affects assets but especially liabilities. How pensions cope with Interest rate risk could determine the funded status and solvency of the plan.
The funded ratio of a pension is assets / liabilities based on either market value or actuarial valuations. The funded status is assets - liabilities with the same valuations. This funded ratio/status determines the contribution costs of a plan, amortizations, actuarial gains/losses and perhaps, affects credit ratings. The funded ratio and status are both based on present value calculations and valuations. As a result, how the present value of pension assets are calculated plays a major role In the funded ratio/status situation.
Assets
There are numerous assets that are interest rate sensitive such as: ABS, bank loans, bonds, cash equivalents, CLOs, CMBS, CMOs, derivatives, futures, mortgage-backed securities, municipal bonds, Private Debt, REITs, etc. . Since Interest rates are never static, their volatility affects the funded ratio/status of the pension plan. This could be good or bad but most pensions do not want volatility on these critical calculations. As a result, many pensions, especially corporate plans, invest in hedging strategies to reduce or Immunize this volatility. These strategies can be quite sophisticated but all come at an extra cost and new risk factors.
Derivatives such as interest rate swaps and futures are contracts which have no cash flow certainty or exact funds available to make the liability cash flow payments. They are hedges vs. the liability growth rate. In fact, these strategies introduce more risk: counter party risk, interest rate risk, non-matching risk of assets purchased (usually equities) vs. liabilities and leverage. In addition, interest rate swaps and futures have all of the problems associated with a liability proxy data gathering… as with duration matching. For example, where do you get the average duration of liabilities? Most, if not all, actuarial reports do not provide this calculation. Moreover, they do not provide the projected liability benefit payment schedule which you would need to calculate duration. In addition, actuarial reports are annual reports usually months delinquent so there would be serious delayed information. The duration calculation is at a precise moment in time… like a balance sheet. As time and interest rates change… so will duration. Only A Custom Liability Index (CLI) priced at market rates and based on each pension’s unique liability benefit payment schedule could provide an accurate and current duration profile. Any difference in yield creates a difference in the calculation of duration and liability growth rates.
A common proxy for the average duration of liabilities is to use a generic bond market index… usually the Bloomberg Barclay’s long corporate index. Such a proxy creates several erroneous data issues. This index has no bonds shorter than 10 years and no durations longer than 17 years. This certainly does not represent any pension liability schedule even if the average durations were similar.
Accounting standards and actuarial practices price liabilities as a portfolio of zero-coupon bonds with a single average discount rate based on the present value of this zero-coupon liability portfolio. Note… there are no generic bond indexes that use zero-coupon bonds as their portfolio. Moreover, there are no generic bond indexes that use any of the required pension accounting discount rates… they use market rates! Every pension plan’s liabilities are different and unique to that plan due to different labor force, salaries, mortality, and plan amendments. There is no way any generic bond market index could represent any pension plan liability term structure.
Liabilities
Liabilities are bond like valuations since their present value is calculated the same way you calculate the present value of bonds. Indeed, FASB and GASB accounting rules require that you price liabilities as if they were zero-coupon bonds. This makes liabilities extremely interest rate sensitive. The longer the average life or duration of liabilities the greater the interest rate risk and present value volatility. Since the duration of liabilities changes with interest rates (discount rates) this calculation needs to be refreshed and updated on a frequent and accurate basis. According to ASC 715 accounting rules (formerly FAS 158) liabilities are to be priced as a high-quality zero-coupon bond yield curve. FASB accepts AA corporates as the interest rates in compliance. Since corporate zeroes do not exist in the market-place, such discount rates are hypothetical interest rates. Ryan ALM is one of few vendors who supply the ASC 715 discount rates. Price Waterhouse Coopers (PWC) has been our major client since FAS 158 became effective in 2008 (now ASC 715). Our discount rates are consistently higher than most vendors providing clients with a lower present value of their pension liabilities thereby enhancing the balance sheet.
GASB accounting rules allow for liabilities to be priced at a single discount rate equal to the assumed ROA. Such divergence in discount rates between FASB and GASB creates much confusion and conflicts but don’t disagree as to the fact that liabilities are assumed to be priced as and behave as zero-coupon bonds.
Liabilities are a term structure of projected benefits. This becomes a tough job for actuaries to calculate annually so it takes some time. Usually, actuarial reports come out months after the end of the fiscal year (around six months for Public plans). Asset managers need fresh and continuous data to do their job. For asset/liability management (ALM) monthly or even daily updates are critical. Since duration and interest rates change daily, liabilities are certainly dynamic structures requiring constant attention. Without a Custom Liability Index (CLI) it would be hard, if not impossible, for a plan sponsor, its asset managers and consultant to understand the risk/reward behavior and interest rate sensitivity of their liabilities.
Solution: Cash Flow Match Benefits
The funded ratio/status and performance measurement of assets vs. liabilities are all based on present value measurements. This has led to a tower of babel on what is the proper discount rate, funded status, index benchmark, duration calculation, etc. The solution lies in cash flow matching projected benefits… future value projections. The goal of a pension is to secure benefits in a cost-effective manner. Benefits are future value numbers. They have little, if any, interest rate sensitivity. A $100 million benefit payment in 2030 is $100 million whether interest rates go up or down. It is a static non-interest rate sensitive calculation. So it follows… that the best way to hedge interest rate risk is to hedge future values by cash flow matching projected benefits with bonds. Bonds have been used historically to match benefits (i.e. defeasance, dedication, immunization) since they may be the only asset class with certainty of cash flows or future values.
Since benefit payments are future values (FV) suggests that the future value of assets vs. the future value of liabilities is the most critical evaluation. But most asset classes are difficult to ascertain their future value. Only bonds (and insurance annuities) have a known future value and have historically been used to cash flow match liabilities (i.e. defeasance, dedication, buy-out annuities). To prove my point as to the potential misinformation with using a PV calculation, let’s use a simple example below. Two pensions both at $1.0 billion market value would have the same funded ratio in PV$. But pension B is 100% invested in corporate bonds that out-yield pension A (100% invested in Treasuries) by 150 bps per year. Certainly, plan B has a much greater future value (@ 24% higher) and funded status if we used future values. This suggests that the funded ratio and funded status are not that accurate or even good indicators of the true economic solvency:
| Pension | Composition | YTM | PV | FV |
|---|---|---|---|---|
| A | 100% Treasuries | 2.00% | $1.0 billion | $1.35 billion |
| B | 100% Corporates | 3.50% | $1.0 billion | $1.68 billion |
The point of all this is… that we need to focus more on the FV of assets vs. liabilities. If we value liabilities at market rates, they would have discount rates of AA corporates (FASB method) or even better U.S. Treasury STRIPS (defeasance method). A corporate bond portfolio matched to liabilities that is skewed to A/BBB securities would out-yield liabilities and would enhance the funded status on a future value basis thereby reducing funding costs and also mitigate interest rate risk. This is why “cash flow matching” of liability future values is the most prudent risk and lowest cost methodology to de-risking a pension through asset liability management (ALM). It secures the benefits in a cost-efficient manner while neutralizing interest rate risk.
Ryan ALM Pension Monitor 4Q’22
4Q 2022 Ryan ALM Pension Monitor (Through December 31, 2022) Pension plan liabilities need to be measured and monitored regularly. Without knowledge of plan liabilities, the allocation of plan assets...
Source: Ryan ALM Pension Monitor 4Q’22
(Through December 31, 2022)
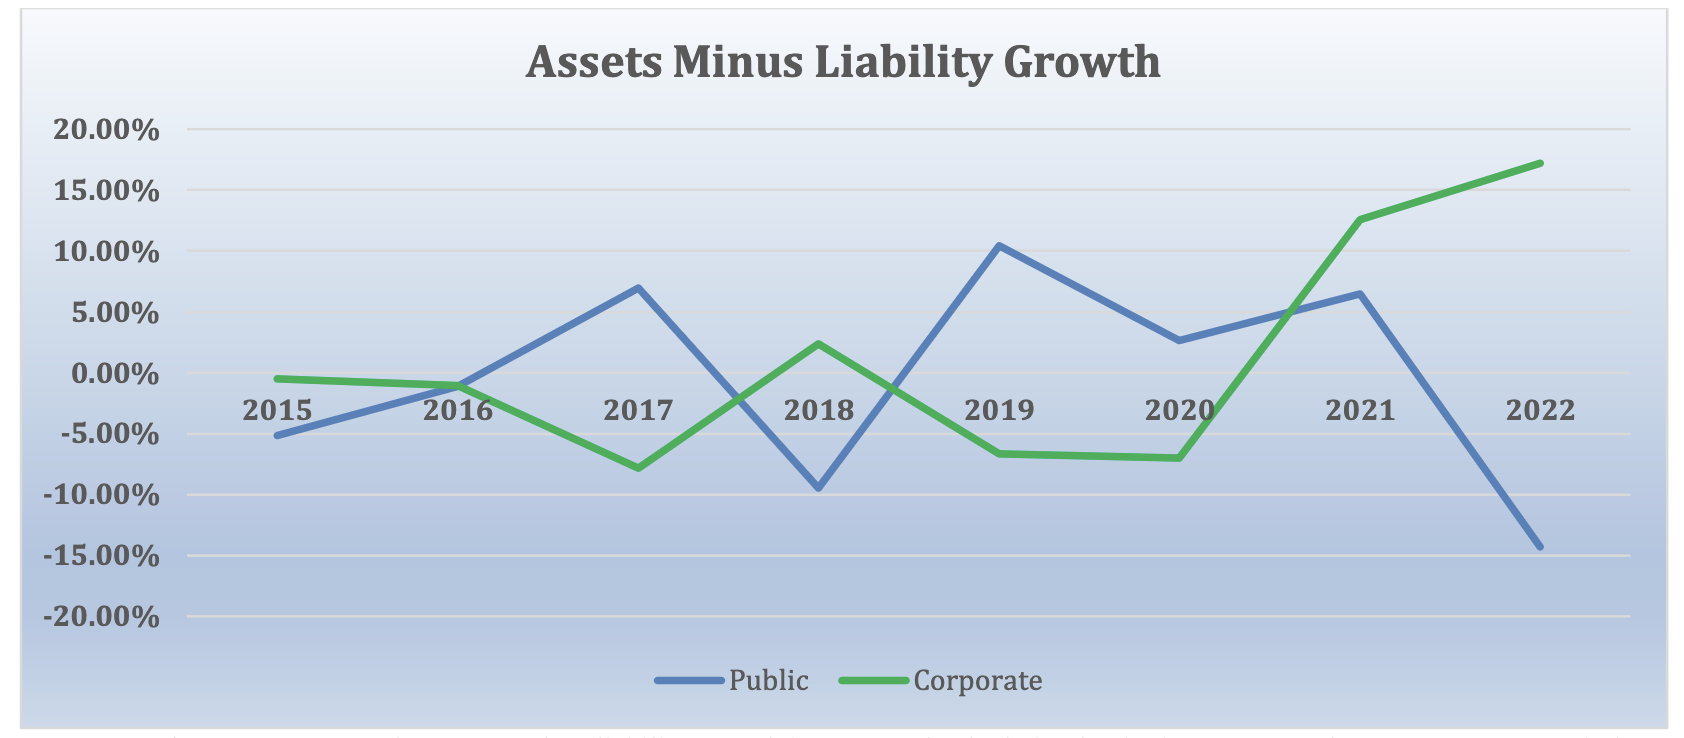
Pension plan liabilities need to be measured and monitored regularly. Without knowledge of plan liabilities, the allocation of plan assets cannot be done efficiently or appropriately. The funded ratio/status of pension plans are present value calculations. Each type of plan is governed by accounting rules and actuarial practices, which determine the discount rate used to calculate the present value of liabilities. Single employer corporate plans are under ASC 715 (FASB) discount rates (AA corporate zero-coupon yield curve); multiemployer plans and public plans use the ROA (return on asset assumption) as the liability discount rate. The difference in liability growth between these plans can be quite significant (see 2022), which will affect funded status and contribution levels.
The table below compares these different liability growth rates (based on a 12-year average duration) versus the asset growth rate based on the P&I asset allocation survey of the top 1,000 plans which is updated each year. The graph below shows the contrasting annual differences of asset versus liability growth for corporate and public plans since 2015. The impact of different accounting rules is massive, and none greater than this year.
| ASSET ALLOCATION | YTD Return | Corporate | Public | Union |
|---|---|---|---|---|
|
Domestic Stock International Stock Global Equity Domestic Fixed Income Global Fixed Income Cash Private Equity Real Estate Equity* Other |
-18.1% -14.0% -18.0% -13.0% -18.3% 1.1% 12.0% 10.8% 10.3% |
11.1% 6.5% 10.4% 46.7% 1.3% 2.0% 8.5% 4.1% 9.4% |
24.4% 16.3% 5.3% 20.2% 1.7% 2.0% 12.7% 7.9% 9.5% |
24.7% 8.6% 11.4% 28.0% 0.9% 0.6% 8.2% 9.3% 8.3% |
| TOTAL ASSETS Growth Rate | -8.7% | -7.2% | -8.7% | |
| LIABILITIES Growth Rate | -26.6% | 7.0% | 7.3% | |
| Asset Growth – Liability Growth | 17.9% | -14.2% | -16.0% |
Index Benchmarks: Domestic Stock = S&P 500; Int’l Stock = EAFE, Global Equity = All Country World; Domestic Fixed Income = BB Aggregate; Global Fixed Income = FTSE World Gov’t (unhedged); Cash = Ryan ALM Cash Index; Private Equity =10-year return for the R2500 + 2%; *Real estate Equity =NFI-DP Index (delayed one month); Alternative Investments and Other = CPI-U & 3%.
Footnote: The measurement of asset growth to liability growth is an annual calculation beginning on December 31, 2015. For periods shorter than 1-year, the observation is a YTD calculation.
The question that must be asked: If two pension systems (one public and the other private) have similar asset allocations and are investing in the same markets, how is it possible that they have such meaningful differences in outcomes? These differences, caused by different reporting requirements, may distort contributions and funded status, and may influence benefit decisions unnecessarily.
Ryan ALM Pension Monitor 3Q’22
3Q 2022 Ryan ALM Pension Monitor (Through September 30, 2022) Pension plan liabilities need to be measured and monitored regularly. Without knowledge of plan liabilities, the allocation of plan assets...
Source: Ryan ALM Pension Monitor 3Q’22
(Through September 30, 2022)
Pension plan liabilities need to be measured and monitored regularly. Without knowledge of plan liabilities, the allocation of plan assets cannot be done efficiently or appropriately.
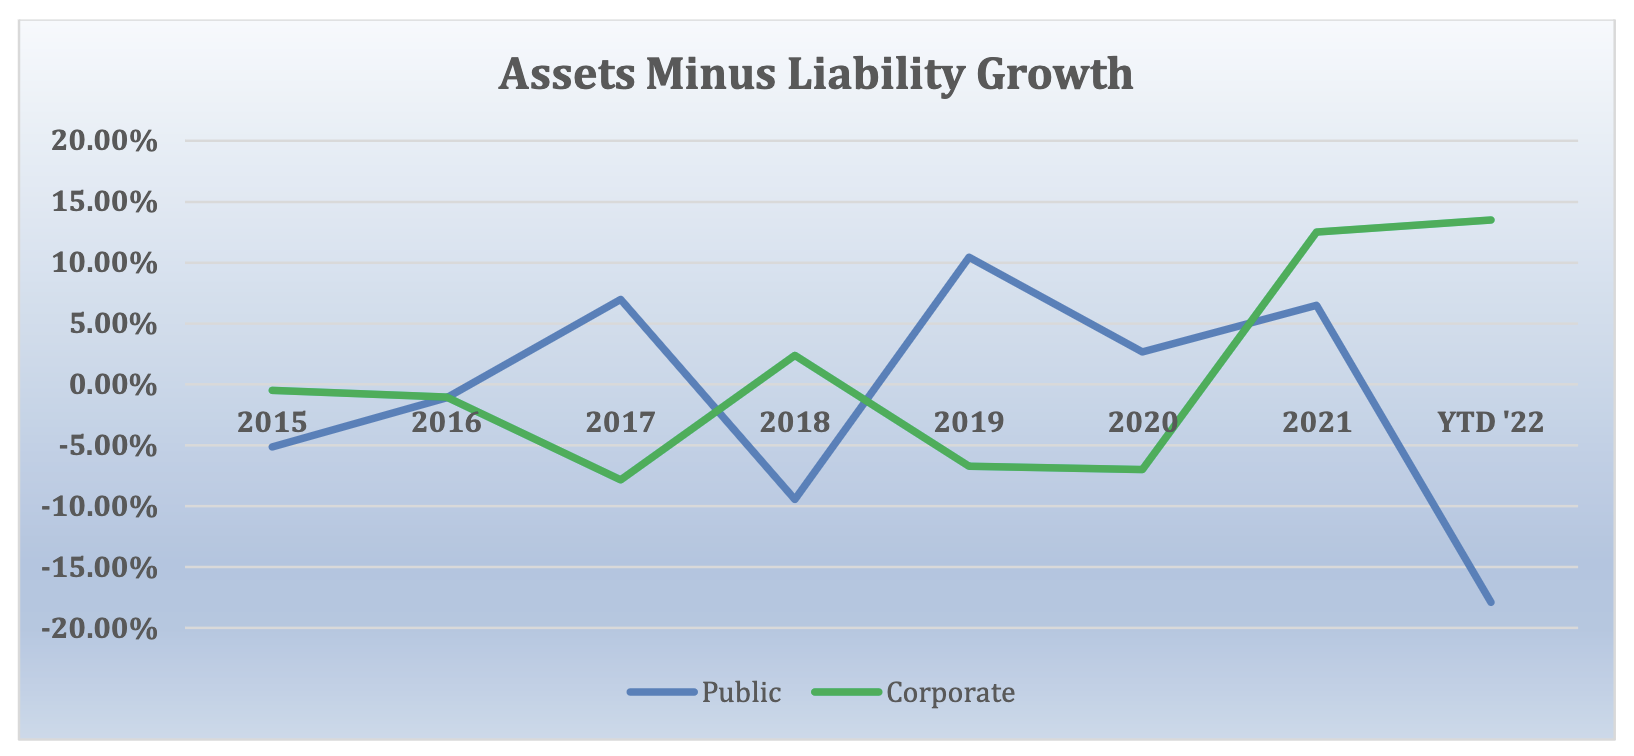
The funded ratio/status of pension plans are present value calculations. Each type of plan is governed by accounting rules and actuarial practices, which determine the discount rate used to calculate the present value of liabilities. Single employer corporate plans are under ASC 715 (FASB) discount rates (AA corporate zero-coupon yield curve); multiemployer plans and public plans use the ROA (return on asset assumption) as the liability discount rate. The difference in liability growth between these plans can be quite significant, which will affect funded status and contribution levels. The table below compares these different liability growth rates (based on a 12-year average duration) versus the asset growth rate using the P&I asset allocation survey of the top 1,000 plans which is updated each year. The graph below shows the contrasting annual differences of asset versus liability growth for corporate and public plans since 2015. The impact of different accounting rules is massive, especially during 2022’s rising rate environment.
| ASSET ALLOCATION | YTD Return | Corporate | Public | Union |
|---|---|---|---|---|
|
Domestic Stock International Stock Global Equity Domestic Fixed Income Global Fixed Income Cash Private Equity Real Estate Equity* Other |
-23.9% -27.1% -25.3% -14.6% -21.3% 0.2% 11.6% 8.6% 9.1% |
11.1% 6.5% 10.4% 46.7% 1.3% 2.0% 8.5% 4.1% 9.4% |
24.4% 16.3% 5.3% 20.2% 1.7% 2.0% 12.7% 7.9% 9.5% |
24.7% 8.6% 11.4% 28.0% 0.9% 0.6% 8.2% 9.3% 8.3% |
| TOTAL ASSETS Growth Rate | -12.0% | -11.9% | -12.9% | |
| LIABILITIES Growth Rate* | -25.9% | 5.6% | 5.6% | |
| Asset Growth – Liability Growth | 13.9% | -17.5% | -18.5% |
Index Benchmarks: Domestic Stock = S&P 500; Int’l Stock = EAFE, Global Equity = All Country World; Domestic Fixed Income = BB Aggregate; Global Fixed Income = FTSE World Gov’t (unhedged); Cash = 3 mo. T-Bill; Private Equity =10-year return for the R2500 + 2%; *Real estate Equity =NFI-DP Index (delayed one month); Alternative Investments and Other = CPI-U & 3%.
*Liabilities = Ryan ALM Custom Liability Indexes (CLI)
Footnote: The measurement of asset growth to liability growth is an annual calculation beginning on December 31, 2015. For periods shorter than 1-year, the observation is a YTD calculation.
Ryan ALM Pension Monitor 2Q
Ryan ALM Pension Monitor (Through June 30, 2021) Pension plan liabilities need to be measured and monitored regularly. Without knowledge of plan liabilities, the allocation of plan assets cannot be...
Source: Ryan ALM Pension Monitor 2Q
Ryan ALM Pension Monitor
(Through June 30, 2021)
Pension plan liabilities need to be measured and monitored regularly. Without knowledge of plan liabilities, the allocation of plan assets cannot be done appropriately.
The funded ratio/status of pension plans are present value calculations. Each type of plan is governed by accounting rules and actuarial practices, which determine the discount rate used to calculate the present value of liabilities. Single employer corporate plans are under ASC 715 (FASB) discount rates (AA corporate zero-coupon yield curve); multiemployer plans and public plans use the ROA (return on asset assumption) as the liability discount rate. The difference in liability growth between these plans can be quite significant, which will affect funded status and contribution levels.
The table below compares these different liability growth rates (based on 12-year average duration) versus the asset growth rate based on the P&I asset allocation survey of the top 1,000 plans. The graph below shows the contrasting annual differences of asset versus liability growth for corporate and public plans since 2015.
| ASSET ALLOCATION | YTD Return | Corporate | Public | Union |
|---|---|---|---|---|
|
Domestic Stock International Stock Global Equity Domestic Fixed Income Global Fixed Income Cash Private Equity Real Estate Equity* Other |
-20.0% -19.2% -20.5% -10.4% -14.8% -0.1% 6.2% 6.9% 6.2% |
11.1% 6.5% 10.4% 46.7% 1.3% 2.0% 8.5% 4.1% 9.4% |
24.4% 16.3% 5.3% 20.2% 1.7% 2.0% 12.7% 7.9% 9.5% |
24.7% 8.6% 11.4% 28.0% 0.9% 0.6% 8.2% 9.3% 8.3% |
| TOTAL ASSETS Growth Rate | -9.2% | -9.5% | -10.3% | |
| LIABILITIES Growth Rate | -18.3% | 3.7% | 3.7% | |
| Asset Growth – Liability Growth | 9.1% | -13.2% | -14.0% |
Index Benchmarks: Domestic Stock = S&P 500; Int’l Stock = EAFE, Global Equity = All Country World; Domestic Fixed Income = BB Aggregate; Global Fixed Income = FTSE World Gov’t (unhedged); Cash = 3 mo. T-Bill; Private Equity =10-year return for the R2500 + 2%; Real estate Equity =NCREIF Index; Alternative Investments and Other = CPI & 3%.
Liabilities: ASC 715 discount rate, produced by Ryan ALM, is 2.35% and GASB ROA is 7.0% annually
Footnote: The measurement of asset growth to liability growth is an annual calculation beginning on December 31, 2015. For periods shorter than 1-year, the observation is a YTD calculation.
Ryan ALM Pension Monitor Q1 ‘22
Ryan ALM Pension Monitor (Through March 31, 2022) Pension plan liabilities need to be measured and monitored regularly. Without knowledge of plan liabilities, the allocation of plan assets cannot be...
Source: Ryan ALM Pension Monitor 1Q
(Through March 31, 2022)
Pension plan liabilities need to be measured and monitored regularly. Without knowledge of plan liabilities, the allocation of plan assets cannot be done efficiently or appropriately.
The funded ratio/status of pension plans are present value calculations. Each type of plan is governed by accounting rules and actuarial practices, which determine the discount rate used to calculate the present value of liabilities. Single employer corporate plans are under ASC 715 (FASB) discount rates (AA corporate zero-coupon yield curve); multiemployer plans and public plans use the ROA (return on asset assumption) as the liability discount rate. The difference in liability growth between these plans can be quite significant, which will affect funded status and contribution levels.
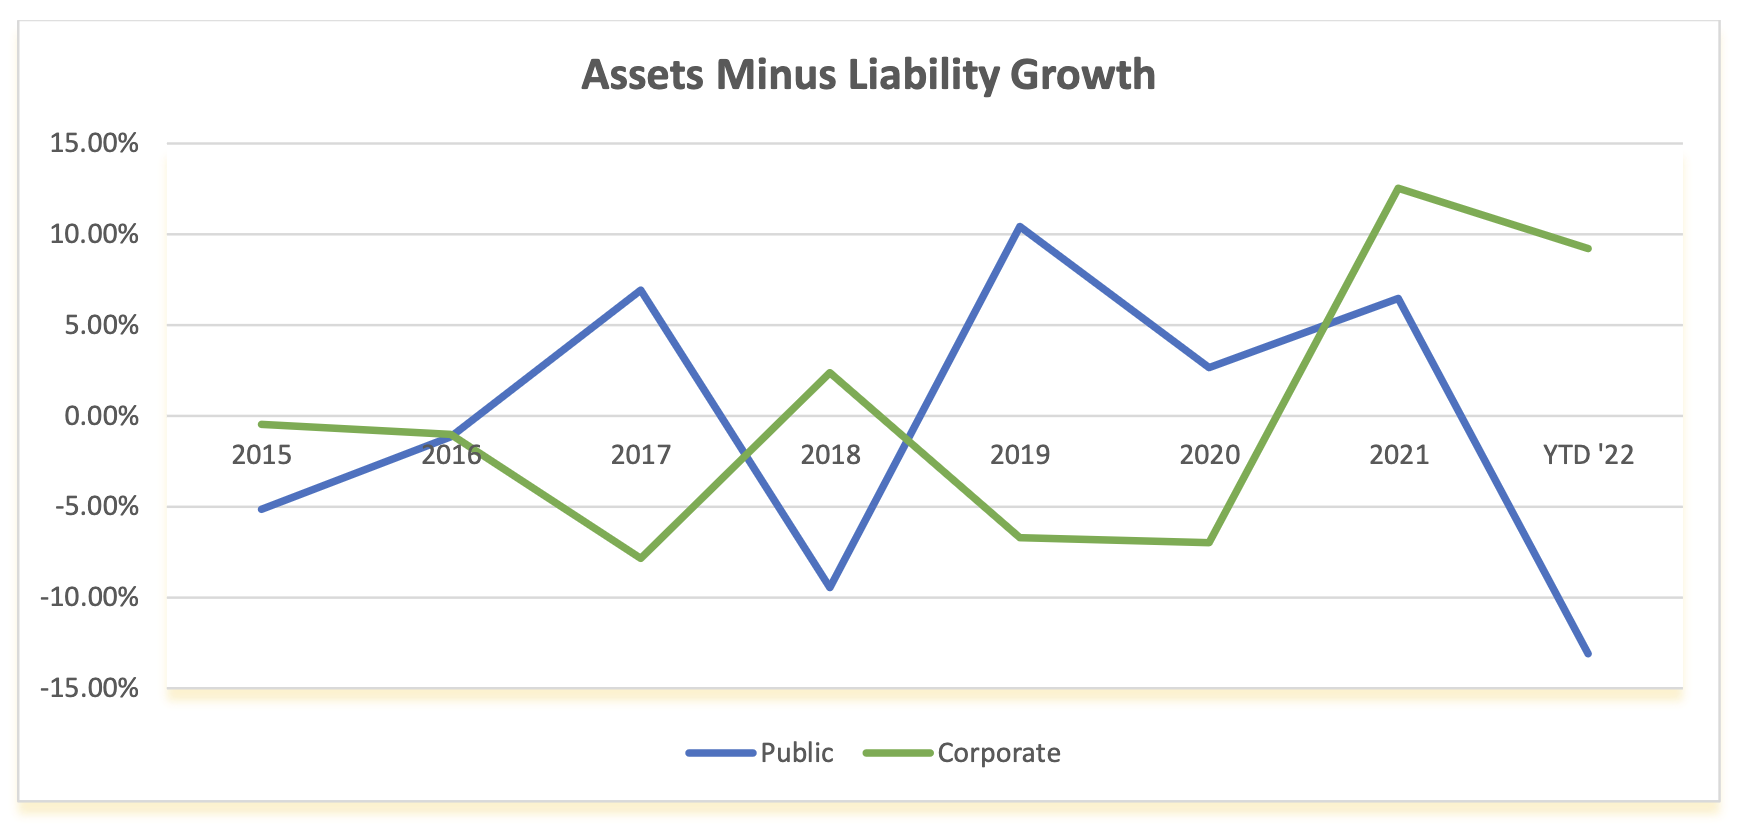
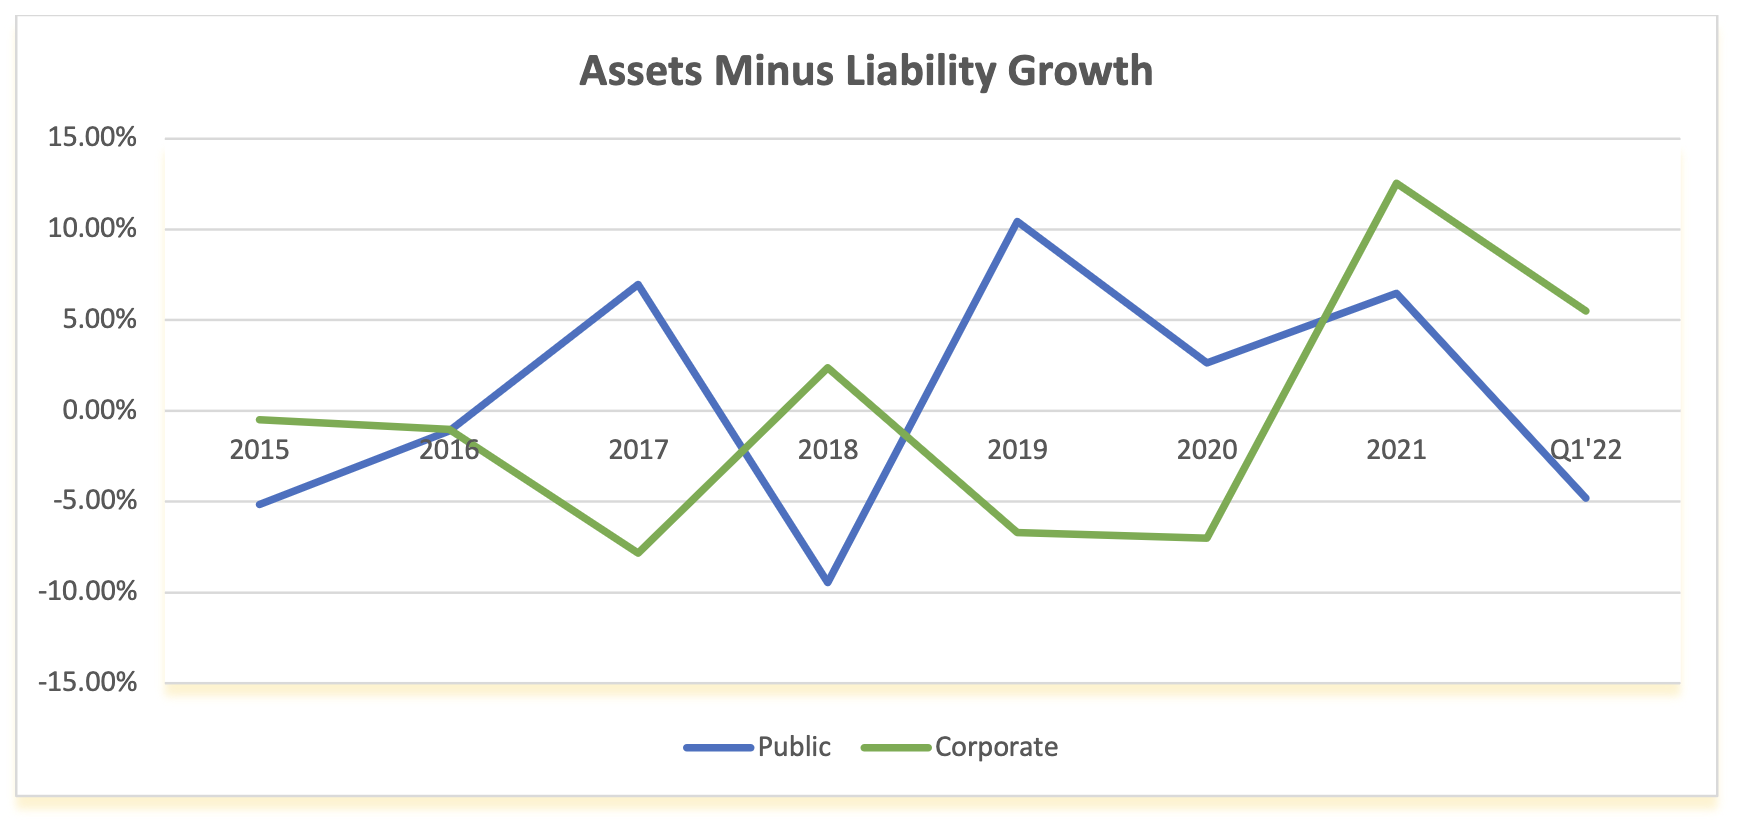
The table below compares these different liability growth rates (based on a 12-year average duration) versus the asset growth rate based on the P&I asset allocation survey of the top 1,000 plans which is updated each year. The graph below shows the contrasting annual differences of asset versus liability growth for corporate and public plans since 2015. The impact of different accounting rules is massive.
| ASSET ALLOCATION | Q1’22 Return | Corporate | Public | Union |
|---|---|---|---|---|
|
Domestic Stock International Stock Global Equity Domestic Fixed Income Global Fixed Income Cash Private Equity Real Estate Equity* Other |
-4.6% -5.8% -5.2% -5.9% -6.5% -0.1% 3.5% -1.3% 3.5% |
11.1% 6.5% 10.4% 46.7% 1.3% 2.0% 8.5% 4.1% 9.4% |
24.4% 16.3% 5.3% 20.2% 1.7% 2.0% 12.7% 7.9% 9.5% |
24.7% 8.6% 11.4% 28.0% 0.9% 0.6% 8.2% 9.3% 8.3% |
| TOTAL ASSETS Growth Rate | -3.7% | -3.0% | -3.5% | |
| LIABILITIES Growth Rate | -9.2% | 1.8% | 1.8% | |
| Asset Growth – Liability Growth | 5.5% | -4.8% | -5.3% |
Index Benchmarks: Domestic Stock = S&P 500; Int’l Stock = EAFE, Global Equity = All Country World; Domestic Fixed Income = BB Aggregate; Global Fixed Income = FTSE World Gov’t (unhedged); Cash = 3 mo. T-Bill; Private Equity =10-year return for the R2500 + 2%; *Real estate Equity =NFI-DP Index (delayed one month); Alternative Investments and Other = CPI-U & 3%.
Footnote: The measurement of asset growth to liability growth is an annual calculation beginning on December 31, 2015. For periods shorter than 1-year, the observation is a YTD calculation.