
Ryan ALM
White Papers
Ryan ALM Pension Alert Q2’23
Most Asset Allocations for pensions are based on achieving the ROA. The ROA is an annual forecast of asset returns. Each asset class is assigned a ROA then weighted by...
Source: Ryan ALM Pension Alert Q2’23
Spread between ROA and Bonds Narrowest in 20+ Years
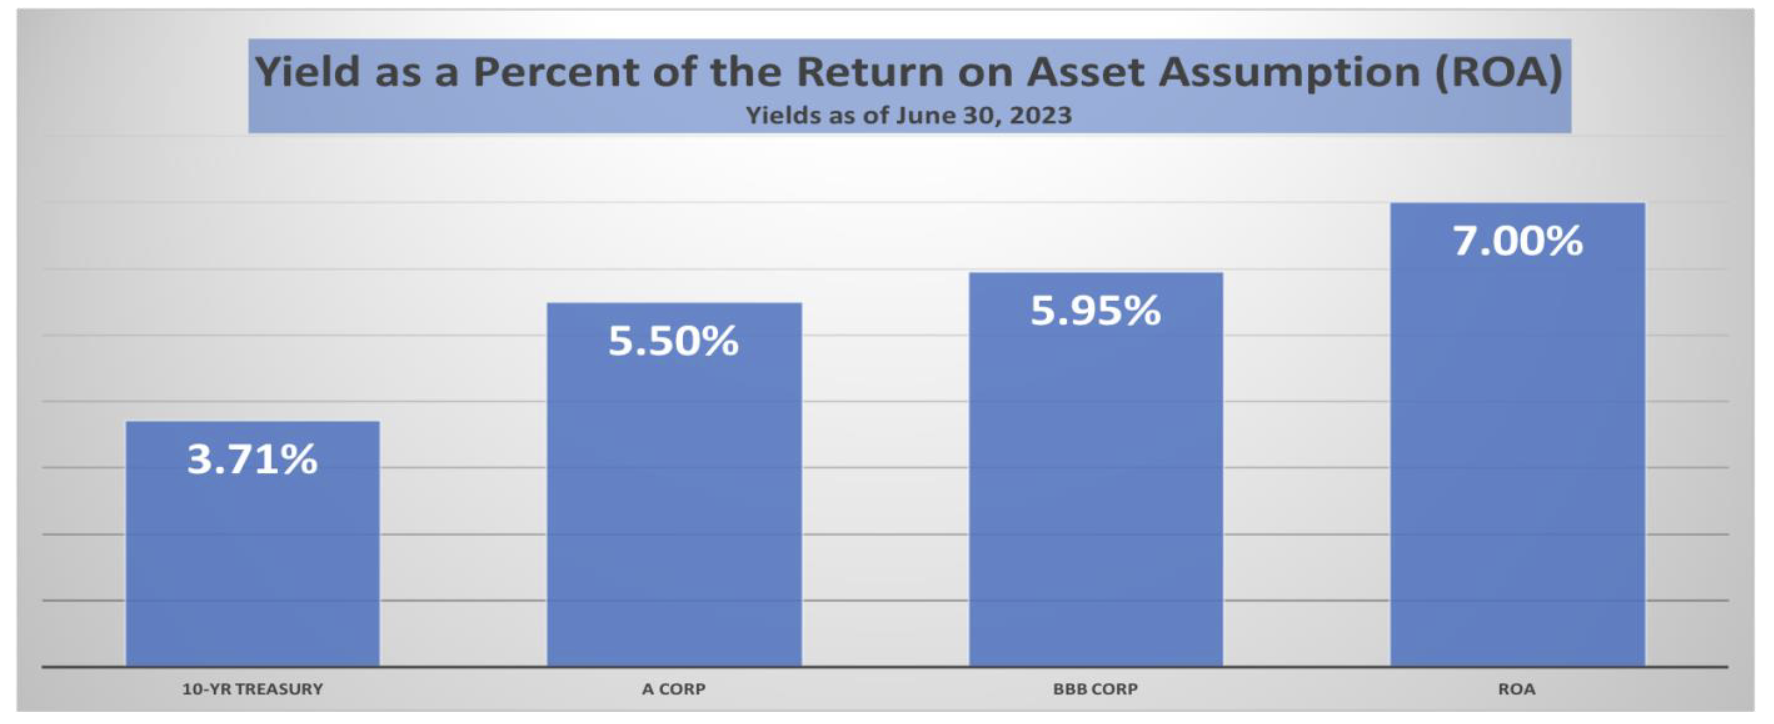
Most Asset Allocations for pensions are based on achieving the ROA. The ROA is an annual forecast of asset returns. Each asset class is assigned a ROA then weighted by the target allocation to get an average or target ROA. Currently, the ROA for most Public pensions is around 7.00%. Yields on A and BBB corporates have risen significantly in the last two years and are now fast approaching the ROA target return. With A and BBB corporate yields at 78.6% to 85.0% of the ROA, a strong argument should be made to increase the allocation to fixed income. The 2023 Milliman Public Funding Survey suggests that the ROA will continue its trend lower. With the Milliman 2024 estimate of a 6.75% ROA, A and BBB corporate bonds would approach 81.5% to 88.2% of the target return. Ryan ALM recommends using bonds for their intrinsic value… the certainty of their cash flows. Cash flow matching liabilities chronologically would be in harmony with the true objective of a pension… to secure the promised benefits in a cost-efficient manner with prudent risk.
Benefits of Higher Bond Allocation to Cash Flow Matching:
Improve Liquidity
Outyield ROA = liability Alpha
Reduce Volatility (risk) of Funded Ratio
Create CORE portfolio as anchor to earning ROA
Reduce costs to fund Benefits + Expenses (B + E)
Buy TIME for performance assets to grow unencumbered
Pension Alert: Spread between ROA and Bonds Narrowest in 20+ Years
Most Asset Allocations for pensions are based on achieving the ROA. The ROA is an annual forecast of asset returns. Each asset class is assigned a ROA then weighted by...
Source: Pension Alert: Spread between ROA and Bonds Narrowest in 20+ Years
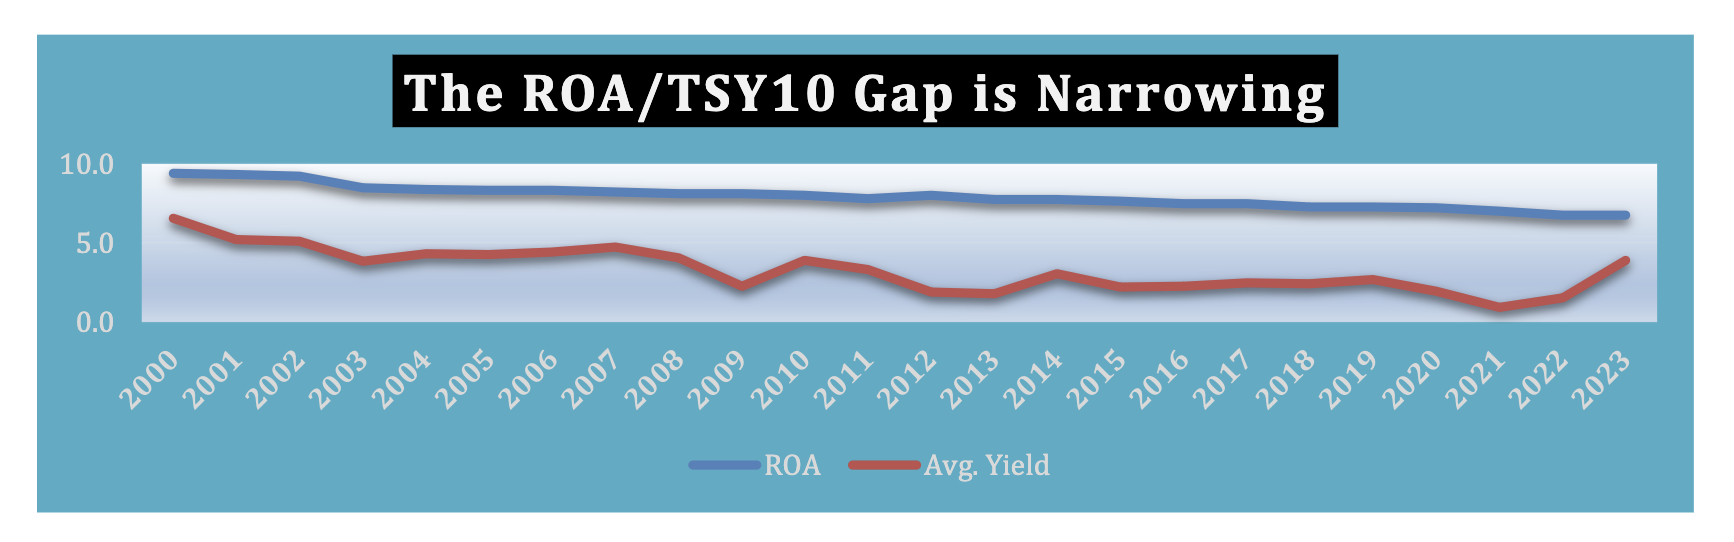
Most Asset Allocations for pensions are based on achieving the ROA. The ROA is an annual forecast of asset returns. Each asset class is assigned a ROA then weighted by the target allocation to get an average or target ROA. Currently, the ROA for most Public pensions is around 6.75%. This is in sharp contrast to the history of reported discount rates (ROA) for funding purposes as reported in the Milliman Public Funding Surveys.
| Year | ROA (%) | Year | ROA (%) | Year | ROA (%) | Year | ROA (%) | Year | ROA (%) |
|---|---|---|---|---|---|---|---|---|---|
| 2000 | 9.4 | 2005 | 8.3 | 2010 | 8.0 | 2015 | 7.7 | 2020 | 7.2 |
| 2001 | 9.3 | 2006 | 8.3 | 2011 | 7.8 | 2016 | 7.5 | 2021 | 7.0 |
| 2002 | 9.2 | 2007 | 8.2 | 2012 | 8.0 | 2017 | 7.5 | 2022 | 6.75E |
| 2003 | 8.5 | 2008 | 8.1 | 2013 | 7.8 | 2018 | 7.3 | 2023 | 6.75E |
| 2004 | 8.4 | 2009 | 8.1 | 2014 | 7.8 | 2019 | 7.3 |
Sources: Milliman Public Funding Surveys
Ryan ALM estimates for 2022 + 2023
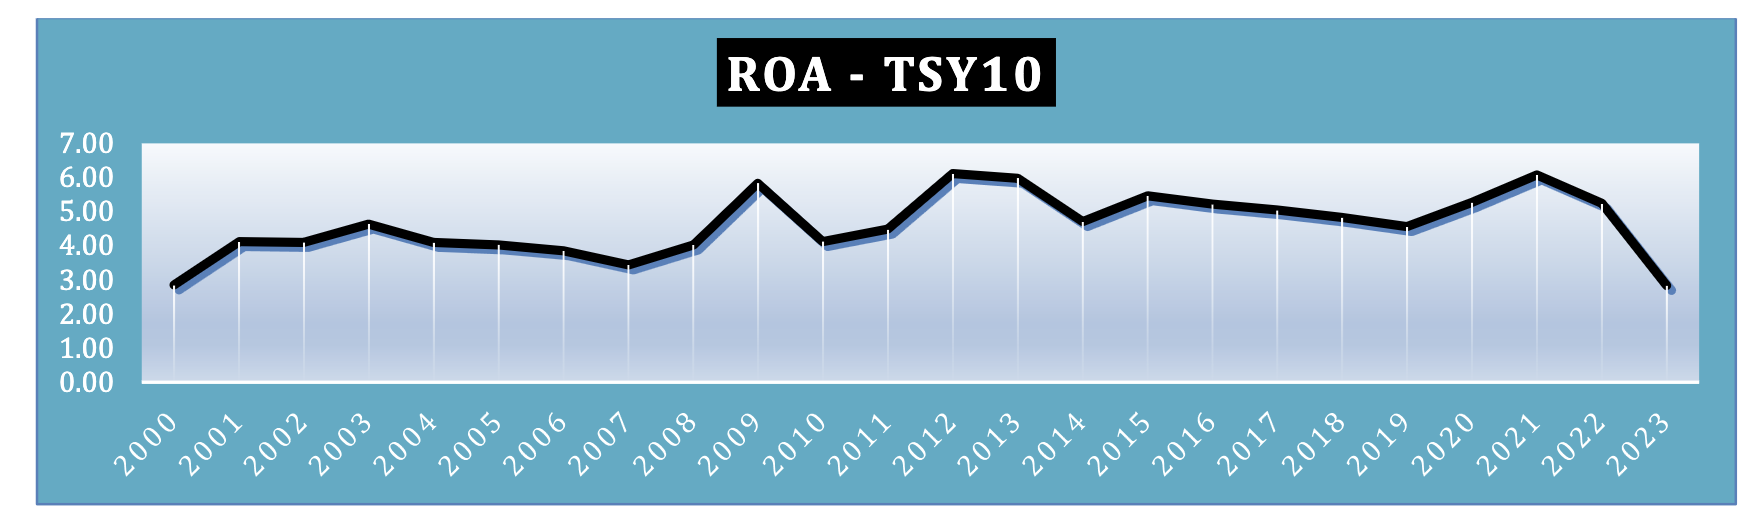
As the Milliman Surveys show, the reported ROAs as discount rates for Public pension liabilities has trended downward from a high of 9.40% in 2000 to somewhere around 6.75% today. Corporate pensions are under ASC 715 discount rates (AA corporate zero-coupon yield curve) and have been reflective of market rates which are consistently much lower than the ROA discount rates. Plotting the ROA discount rates for Public pensions versus the history of 10-year Treasury rates (source: Ryan Treasury Indexes) shows that the yield difference is now at a 22-year low of around 283 basis points (as of 12/31/22). This trend would support a greater allocation to fixed income.
Ryan ALM Advisers uses and promotes A and BBB corporate bonds to cash flow match and defease clients projected liabilities. As a result, the yield spread versus the ROA gets even narrower. The current yield spreads for 10-year corporate bonds versus the 10-year Treasury are:
AA +56 bps
A +75 bps
BBB +114 bps
Using an average yield spread versus the 10-year Treasury for A/BBB corporate bonds = 95 basis points would narrow the ROA – Corporate Bond Yield Spread to 187 basis points. This suggests that fixed income can provide 72% of the target ROA. More importantly, using A/BBB corporate bond portfolio would outyield the BB Aggregate index (bond ROA) by around 75-100 basis points. The BB index YTW levels prove this point:
12/31/22 1/17/23
BB Aggregate = 4.68% 4.32%
BB Corporates = 5.42% 5.03%
Benefits of Higher Bond Allocation to Cash Flow Matching:
Improve Liquidity
Reduce Volatility (risk)
Outyield Index Benchmark and bond ROA
Create CORE portfolio as anchor to earning ROA
Reduce costs to fund Benefits + Expenses (B + E)
Buy TIME for performance assets to grow unencumbered