Source: Absolute Versus Relative Returns
Most pensions use the ROA (Return on Assets) as the focus of asset allocation. The ROA is nothing more than a forecast of absolute returns… perhaps a poor forecast. According to the Milliman Public Fund Survey for the last 10 years there has never been a year that the top 100 Public pension assets (on average) had a return equal to the ROA. Critics would argue that the ROA is a long term forecast not an annual forecast. Maybe that is true but that is not how a pension works. Each year the pension plan actuary will calculate the funded status based on actual annual returns of assets (smoothed over five years) versus the annual liabilities return or growth rate (based on the discount rate chosen which is the ROA for Public and Multiemployer plans). It is relative returns (assets versus liabilities) that count. It is asset cash flows versus liability cash flows that should be the focus of every pension. Once the funded status (assets – liabilities) is known then projected contributions are calculated. As a result, pensions are playing in an annual ball game which may go on until perpetuity or the pension dissolves. If asset returns underperform liability returns, the pension plan will pay with higher contribution costs the next year (and maybe future years). Even if pension assets have good returns in later years, the plan does not get those extra contributions back.
Milliman 2025 Public Fund Survey
| Year | Actual | ROA | Difference | 5-year ROA Average | Difference vs. ROA |
|---|---|---|---|---|---|
| 2024 | 10.00% | 7.00% | 3.00% | 6.46% | -0.54% |
| 2023 | 12.59 | 7.00 | 5.59 | 7.61 | 0.61 |
| 2022 | -11.73 | 7.00 | -18.73 | 4.30 | -2.70 |
| 2021 | 9.79 | 7.00 | 2.79 | 9.50 | 2.50 |
| 2020 | 11.43 | 7.20 | 4.23 | 7.81 | 0.81 |
| 2019 | 15.96 | 7.25 | 8.71 | 6.16 | -0.84 |
| 2018 | -3.97 | 7.25 | -11.22 | ||
| 2017 | 14.30 | 7.50 | 6.80 | ||
| 2016 | 1.31 | 7.50 | -6.19 | ||
| 2015 | 3.2 | 7.65 | -4.45 |
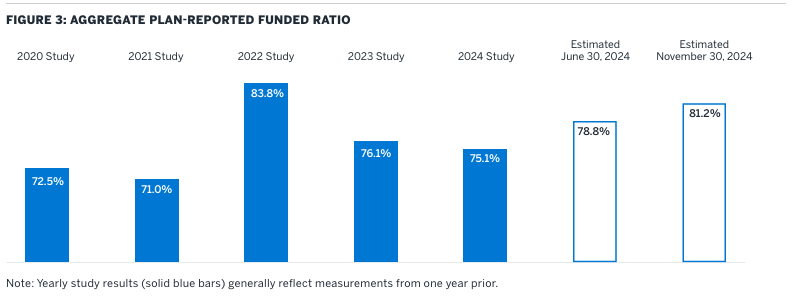
The surplus years of the 1990s were destroyed in the equity correction years of 2000 to 2002 driving funded ratios down to deep deficits. According to the Ryan ALM Newsletter pension monitor, most pension plans underperformed liability growth by about 76% in those three years. This created sudden and deep deficits with spiking contribution costs. Most Public pensions have not recovered to this day. According to the Milliman study, funded ratios have improved in the last 4 years but are still at a deficit with an average funded ratio of 81.2% as of November 2024 using the ROA as the discount rate. If market rates are used as the discount rate, funded ratios would drop by about 15% to 20%. With interest rates today around 5.00% on AA corporate bonds (FASB ASC 715 discount rate methodology) and the ROA around 7.00% there is a discount rate difference of around 200 basis points. With the average duration of pensions around 12 years then 200 bps times 12 years = a 24% present value difference in liability valuation.
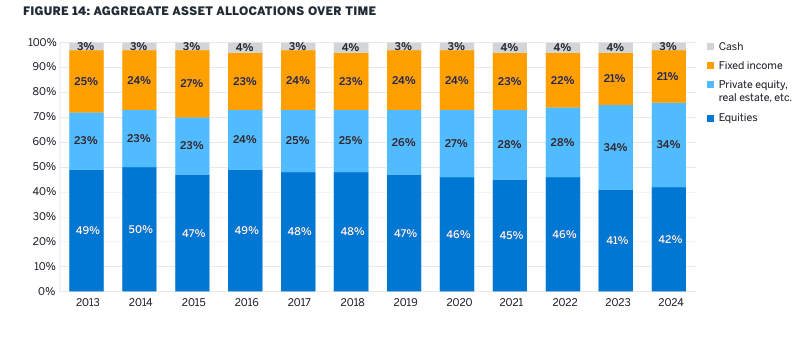
Since the ROA is the focus of asset allocation then it follows that asset allocation is skewed to equities and risky assets who are supposed to deliver higher returns than fixed income. This strategy has plagued pensions for several decades causing volatile funded ratios and higher contribution costs since 2000. What pensions should want is the certainty of asset cash flows with low volatility in their funded ratios and reduced contribution costs… this is best accomplished through cash flow matching with bonds! Asset allocation should be responsive to the funded ratio and funded status. In the 1990s when pensions were fully funded with a surplus funded ratio, why didn’t they immunize and use cash flow matching for 100% and create a surplus portfolio for the excess assets. Had pensions adopted this responsive asset allocation to cash flow matching, they would have secured benefits and a fully funded plan with little volatility in their funded status and contributions costs.
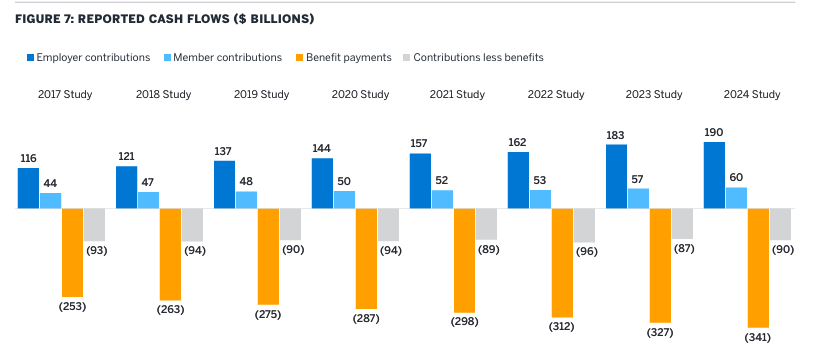
It is critical that asset cash flows fully fund liability cash flows. Contributions have become a major asset cash flow since 2000 after the equity correction caused massive spikes in contribution costs. According to the Milliman study, employer contributions grew from $116 billion in 2017 to $190 billion in 2024 or 63.8% yet the funded ratio improved from 72.50% to 81.2%. This is explained by using the ROA as the discount rate which erroneously undervalues the present value of liabilities. Contributions are calculated on the cash flows needed to fully fund projected benefit payments which are future value numbers. This is an important and critical distinction. The pension game should be one of future values not present values… it should be asset cash flows versus liabilities cash flows!
In summary, pensions are all about cash flows (future values). This is what cash flow matching is all about. It creates an investment grade bond portfolio whose monthly cash flows (future value numbers) match and fully fund monthly benefit payments with certainty.
For more info on the Ryan ALM cash flow model (Liability Beta Portfolio™ or LBP) contact Russ Kamp, CEO at rkamp@ryanalm.com.